$TGT a Clear Buy in $75 - $83 Range IMONYSE:TGT has respected the purple channel for the past 25yrs.You'll notice it also dipped below the channel twice but got up within the next 12 months. If we get that dip this time around I think it goes to $75 and is a max bid scenario. Otherwise, buys on the bottom range of the channel (bottom purple line) are good as well.
Long term trade idea that may take a while to play out!
TGT trade ideas

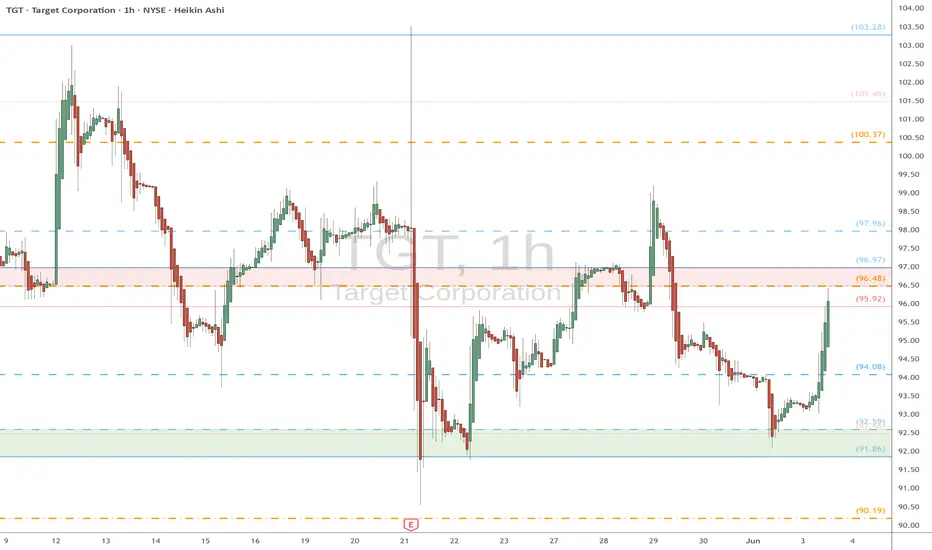
TGT watch $96.48/97: Proven Resistance could Mak / Break bottomTGT trying to paint a bottom to its huge downtrend.
About to test a key resistance zone at $96.48-96.97
Looking for Dip-to-Fib or Break-n-Retest to go long.
Target Sputters as Market Recovers Target has sputtered as the broader market recovers, and some traders may think the retailer has further downside risk.
The first pattern on today’s chart is the steady decline between early February and early April. TGT tried to stabilize after the move but barely rebounded. It also failed to hold the rally on May 12 after Treasury Secretary Scott Bessent cut tariffs on China. That feeble price action may suggest sellers remain in control.
Second, the stock spent about a month at its 50-day simple moving average (SMA) early this year before continuing lower. It’s now spent about three weeks at the same line without closing above it. Is the intermediate-term trend still bearish?
Third, the move between April 8 and May 20 may be viewed as a potentially bearish flag that’s now broken to the downside.
Next, the 8-day exponential moving average (EMA) recently crossed below the 21-day EMA. MACD has also turned negative. Those patterns may reflect a bearish short-term trend.
Finally, TGT is an active underlier in the options market. (It averages more than 70,000 contracts per day, according to TradeStation data.) That could help traders take positions with calls and puts.
Check out TradingView's The Leap competition sponsored by TradeStation.
TradeStation has, for decades, advanced the trading industry, providing access to stocks, options and futures. If you're born to trade, we could be for you. See our Overview for more.
Past performance, whether actual or indicated by historical tests of strategies, is no guarantee of future performance or success. There is a possibility that you may sustain a loss equal to or greater than your entire investment regardless of which asset class you trade (equities, options or futures); therefore, you should not invest or risk money that you cannot afford to lose. Online trading is not suitable for all investors. View the document titled Characteristics and Risks of Standardized Options at www.TradeStation.com . Before trading any asset class, customers must read the relevant risk disclosure statements on www.TradeStation.com . System access and trade placement and execution may be delayed or fail due to market volatility and volume, quote delays, system and software errors, Internet traffic, outages and other factors.
Securities and futures trading is offered to self-directed customers by TradeStation Securities, Inc., a broker-dealer registered with the Securities and Exchange Commission and a futures commission merchant licensed with the Commodity Futures Trading Commission). TradeStation Securities is a member of the Financial Industry Regulatory Authority, the National Futures Association, and a number of exchanges.
Options trading is not suitable for all investors. Your TradeStation Securities’ account application to trade options will be considered and approved or disapproved based on all relevant factors, including your trading experience. See www.TradeStation.com . Visit www.TradeStation.com for full details on the costs and fees associated with options.
Margin trading involves risks, and it is important that you fully understand those risks before trading on margin. The Margin Disclosure Statement outlines many of those risks, including that you can lose more funds than you deposit in your margin account; your brokerage firm can force the sale of securities in your account; your brokerage firm can sell your securities without contacting you; and you are not entitled to an extension of time on a margin call. Review the Margin Disclosure Statement at www.TradeStation.com .
TradeStation Securities, Inc. and TradeStation Technologies, Inc. are each wholly owned subsidiaries of TradeStation Group, Inc., both operating, and providing products and services, under the TradeStation brand and trademark. When applying for, or purchasing, accounts, subscriptions, products and services, it is important that you know which company you will be dealing with. Visit www.TradeStation.com for further important information explaining what this means.

Discover the Magic of Target!Are you a fan of Target? With its wide range of products and services, it's no wonder why Target is a go-to destination for many of us.
From food and general merchandise to clothing and household goods, electronics, and toys, Target has got you covered. And with their diverse range of brands, including A New Day, Cat & Jack, and Good & Gather, you're sure to find something that suits your style.
But what really sets Target apart is its commitment to quality and affordability. Whether you're looking for everyday essentials or something special, Target's got you covered.
So, what's your favorite thing about Target? Do you love their home decor, their clothing lines, or their food options? Let us know in the comments below!
Some of our favorite Target brands include:
* A New Day
* Cat & Jack
* Good & Gather
* Hearth & Hand with Magnolia
* Threshold
* Universal Thread

OptionsMastery: Daily Resistance on TGT!🔉Sound on!🔉
📣Make sure to watch fullscreen!📣
Thank you as always for watching my videos. I hope that you learned something very educational! Please feel free to like, share, and comment on this post. Remember only risk what you are willing to lose. Trading is very risky but it can change your life!

Long TGTI'm following a three decade trend of TGT bouncing off the 200SMA on the monthly chart. I believe there is a lot of upside for the stock and valuation. TGT has had several years of downside due to the post-covid response from consumers with significant cost of living increases. TGT has also recently been struggling with public backlash over DEI program cancellation, and tariff concerns.
With that said, I believe we should have strong support dating back several decades and most of the negative news should be priced in at this point. RSI indicates TGT being oversold.
4.76%
Annual dividend yield

Target Long PositionTarget has created a ascending triangle pattern after the change of character a bearish downward channel pattern

$TGT will continue to face boycott's and lawsuits. See the chartSee the (D) Chart provided for the timeline of their decline
Shareholders said Target's underperformance stood "in stark contrast" to results at rival Walmart (WMT.N), opens new tab, and reflected "continued backlash from its campaigns."
The lawsuit in the Fort Myers, Florida federal court seeks damages for Target shareholders from Aug. 26, 2022 to Nov. 19, 2024.
It was filed after Target said on Jan. 24 it would end DEI initiatives this year, including a program to support Black-owned businesses that it adopted following the 2020 murder of George Floyd by a Minneapolis police officer.
Target joined Walmart, Amazon.com (AMZN.O), opens new tab and some other prominent companies to scale back such initiatives, which have been attacked by many conservatives including U.S. President Donald Trump.
The case is City of Riviera Beach Police Pension Fund v Target Corp et al, U.S. District Court, Middle District of Florida, No. 25-00085.

$40 comingTGT really needs to get its crap together. TGT had not found the bottom yet, and I expect a similar collapse as happened a few years ago. They have an anchor in every town in the US and that advantage seems to continuously be waisted on trends rather than valuable staple goods. We are heading into a recession and TGT could become the store of choice for everyone, they just need to compete with Dick sporting goods and Kohls. It would be an easy move, so lets hope they wake up as most of their completion is failing already.

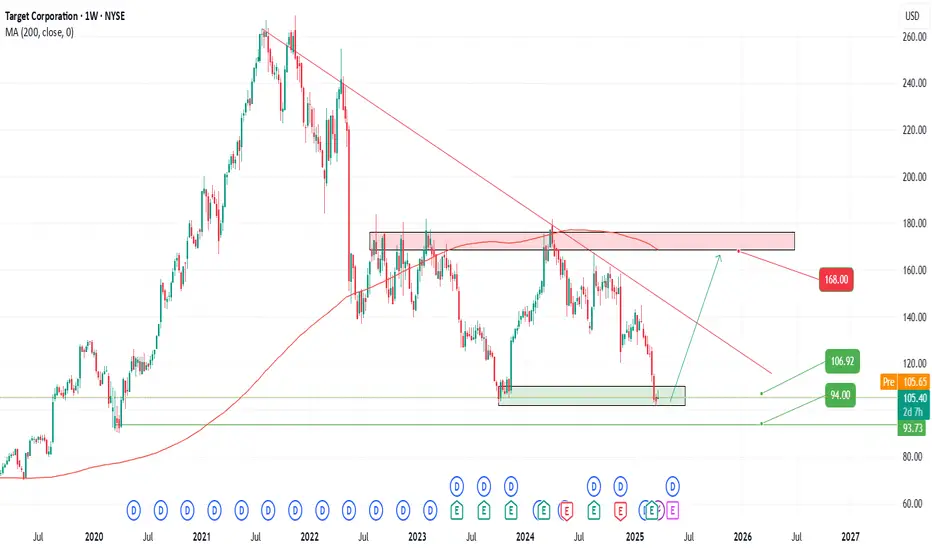
TGT Trade Idea –2025🚨 NYSE:TGT is shaping up with some juicy potential in this current market cycle 📈
🎯 Entry Points (Buy Zones):
1️⃣ $107 – Aggressive entry for early birds
2️⃣ $100 – Solid mid-range level with strong historical support
3️⃣ $94 – Deep dip buy for the patient sniper
💸 Profit Targets:
✅ $141 – First take profit zone
✅ $158 – Stretch target
🚀 $168+ – Blue sky potential if momentum keeps rolling
🧠 Risk Management:
Always position size properly and consider a stop loss based on your risk tolerance. Nothing goes up in a straight line – keep your strategy tight.
📝 Disclaimer: This is not financial advice. These are personal trading ideas based on current chart trends and market sentiment. Always do your own research and consult with a licensed financial advisor before making any investment decisions.
Stay sharp & trade smart! 💼📊
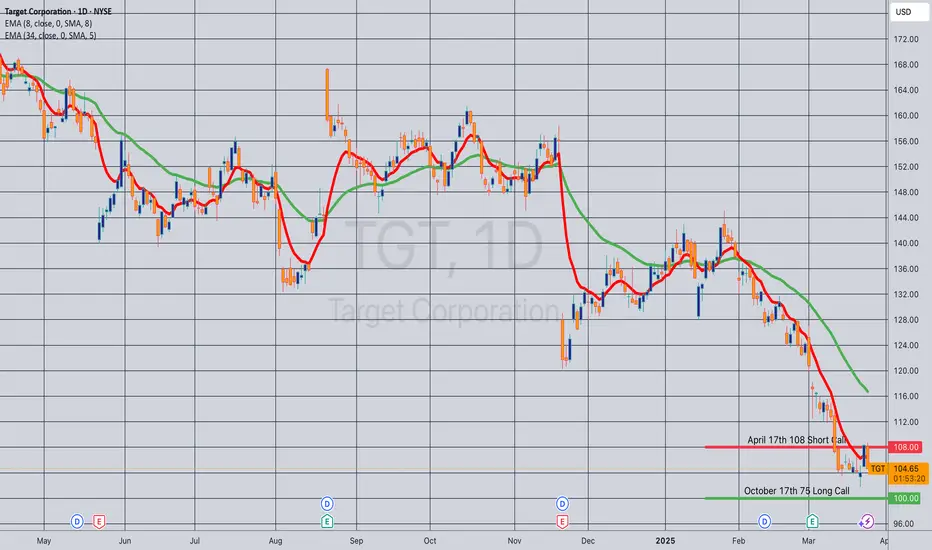
Opening (IRA): TGT April 17th -108C/October 17th 75C LCD*... for a 30.05 debit.
Comments: At or near a 52-week low. Buying the back month 90 delta and selling the front month strike that pays for all of the extrinsic in the long. (The 75C is shown at the 100 strike so that it fits on the chart).
Metrics:
Buying Power Effect: 30.05
Break Even: 105.05
Max Profit: 2.95
ROC at Max: 9.82%
50% Max: 1.48
ROC at 50% Max: 4.91%
Will generally look to take profit at 50% max and/or roll the short call at 50% max to lower my downside break even.
* -- Long Call Diagonal.
Did $TGT trigger a Bullish Divergence or is it just a Bull Trap?NYSE:TGT appears to have found support in the $100 - $105 range. I’ve been monitoring the stock and noticed a significant surge in institutional buying volume during the latter half of Friday’s session (3/21/2025), with nearly 32 million shares traded. The last time we saw such an unusual spike in volume, it triggered a gap-up and a sustained rally from 11/2023 to 4/2024.
A particularly notable development is the sharp increase in call option activity when the price dipped to the $101.xx zone early in the session. Both premiums and implied volatility (IV) spiked higher than usual. Additionally, MACD is on track for a bullish crossover by the final week of March 2025, while RSI, currently in the oversold zone, is showing signs of a recovery with a bullish divergence forming.
If Monday (3/24) and Tuesday (3/25) close green, expect selling pressure on Wednesday and Thursday. Friday (3/28/2025) will be a decisive session to determine whether Target can rebound toward $110 - $120 - $130.
However, Bearish on Weekly is the main trend, also keep in mind that Trump’s tariffs are still looming, with the next deadline set for Canada & Mexico is 4/2/2025. Don’t expect another extension. If you’re in profit, consider closing positions in this week. If Target fails to hold the $100 - $105 support zone, the next destination could be $90.
Disclaimer.

Bullseye Bounce?Target Corporation is exhibiting signs of potential bullish momentum, with a notable weekly gap around the $100 level. The stock is currently trading near its 52-week low of $103.46, suggesting a possible rebound opportunity.
A breakout above the $120 level would confirm further strength, positioning the stock to target the $139.68 resistance. This trade setup offers an attractive risk-to-reward ratio, with a stop-loss set at $98.12 to manage downside risk.
The Relative Strength Index (RSI) for TGT is currently at 23.12, indicating oversold conditions and a potential for a bounce.
This combination of technical indicators supports a bullish outlook for TGT, with a potential move toward the $139.68 resistance level.
NYSE:TGT

Target | TGT | Long at $105.75Target NYSE:TGT
Strengths:
P/E: 11.82x
Earnings are forecast to grow 4.95% per year
Dividend: 4.24%
Better "value" compared to others (i.e. NYSE:WMT )
Insiders recently awarded options
May have double-bottomed (see weaknesses below...)
Weakness
Economic headwinds / recession concerns
Debt-to-equity: 1.09x (slightly high)
Several price gaps on the daily chart are open below the current price. If recession fears are valid and news to messages "tighter consumer spending", these gaps will likely be filled (all the way down to the GETTEX:50S ). One day these will be filled, but that would be a huge opportunity for long-term investors...
Thus, at $105.75, NYSE:TGT is in a personal buy zone.
Targets
$119.75
$137.00
$150.00

TGT SellTGT Sell on Daily/2hr combo. Trend line pointing us to a sell, also our indicator is showing us a good entry opportunity for a Nice R/R.

$TGT: Target Corporation – Retail Titan or Fading Star?(1/9)
Good evening, shoppers! 🌙 NYSE:TGT : Target Corporation – Retail Titan or Fading Star?
Target’s at $116 on March 4, 2025—is this a golden ticket or a clearance rack trap? Let’s unpack the cart and find out! 🔧
(2/9) – PRICE PERFORMANCE 📊
• Current Price: $ 116 as of Mar 4, 2025 🤑
• Past Peek: Down 20% from $145.65 earlier this month 📉
• Sector Vibe: Retail’s feeling the squeeze, folks 🎮
It’s a bumpy ride, but deals might be hiding! 🛠️
(3/9) – MARKET POSITION 📈
• Market Cap: Roughly $53.15B (458.21M shares) 🏬
• Footprint: Around 1,950 stores, online sales popping 📡
• Trend: Brand loyalty high, but rivals are circling 🛡️
Still a heavyweight in the retail ring! 🏋️♀️
(4/9) – KEY DEVELOPMENTS 🔑
• Retail Scene: Spending’s tight, consumers picky 📅
• Digital Gains: E-commerce up, per past trends 🖥️
• Market Buzz: $116 hints at cautious buyers 🎤
Pivoting fast, but aisles are jammed! 🧭
(5/9) – RISKS IN FOCUS ⚠️
• Rivals: Walmart, Amazon playing hardball 🚨
• Economy: Inflation biting, tariffs looming 💸
• Swings: Retail stocks dance to a wild beat 🎶
Rough waters, but storms pass! 🌪️
(6/9) – SWOT: STRENGTHS 💥
• Name Value: Trendy goods, solid rep 💎
• Reach: 1,950+ stores, wide net 🗺️
• Online Edge: Digital sales climbing 📱
Loaded with ammo for the retail fight! 🔥
(7/9) – SWOT: WEAKNESSES & OPPORTUNITIES 🧐
• Weaknesses: $116 shows hesitation, margins tight 📋
• Opportunities: Push Target Circle, grow e-sales 🚀
Can it snag the prize or just scrape by? 🤷♂️
(8/9) – 📢Target’s $116, retail’s shaky—your call? 🗳️
• Bullish: $130+ soon, undervalued 🚀
• Neutral: Holding steady 🚬
• Bearish: $100 coming, trouble ahead 🕳️
Drop your vote below! 👇
(9/9) – FINAL TAKEAWAY 🎯
Target’s $116 price paints a shaky picture 📈, but its brand’s a rock 🌎. Swings are our playground—dips turn into DCA wins 💰. Buy low, aim high! Hit or miss?

Target Corporation (NYSE:TGT) To Report Earnings Before the BellTarget Corporation (NYSE: NYSE:TGT ) a company that operates as a general merchandise retailer in the United States is set to report earnings on Tuesday, March 4, 2025, before market open. In like of that manner, NYSE:TGT shares surge 2.27% in Tuesday's premarket trading.
With the 1-month low acting as a support point, in the case of a pullback the 1-month low seems strong enough to hold off sellers. With the RSI at 40, a bullish reversal could be feasible in the case of a favourable earnings outlook.
Financial Performance
In 2023, Target's revenue was $107.41 billion, a decrease of -1.57% compared to the previous year's $109.12 billion. Earnings were $4.14 billion, an increase of 48.85%.
Analyst Forecast
According to 31 analysts, the average rating for TGT stock is "Buy." The 12-month stock price forecast is $159.45, which is an increase of 32.04% from the latest price.

$TGT on Fresh food, fresh savingsDid you know that Target has been around since 1902? Founded by George Draper Dayton, the company has grown into a retail leader with a wide range of products. From fresh produce to dry groceries, dairy, and frozen items, Target has got you covered.
What's your favorite thing to buy at Target? Share with us in the comments!

TGT to $134My trading plan is very simple.
I buy or sell when:
* Price tags the top or bottom of parallel channel zones
* Money flow spikes above it's Bollinger Bands
* Price at Fibonacci levels
So...
Here's why I'm picking this symbol to do the thing.
Price in channel zone at bottom of channels (period 100 52 & 26)
Stochastic Momentum Index (SMI) at oversold level
Money flow momentum is spiked negative and under at bottom of Bollinger Band
Entry at $130.37
Target is $134 or channel top


Target 134.61Following weekly chart.
I got a long signal from one of my power indicators.
I'll only bet for close resistance.
TP1 134.61 which is first resistance
TP2 139.3 next critical fibo level.
I'd stop under 129.23 candle close. RR is perfect.
Let me know if you ride it

Major Price Movement Incoming for TGT!Signalist has detected a precise pattern in NYSE:TGT trading activity, signaling that a substantial price movement is imminent. This isn’t a random fluctuation—it’s a carefully analyzed precursor to a significant market event.
📅 What to Expect:
⌛ Timeline: Anticipate a major move within the next 1 to 4 upcoming 3-hour candles.
📈 Monitor the Charts: Keep an eye on TGT’s price action over the next few candles.
Prepare Your Strategy: Whether you’re bullish or bearish, have your trading plan ready to capitalize on the move.

Still DCA on TargetStill DCA (dollar-cost-averaging) down on TGT as this is in my swing trade setup. Currently down around 9% on this position, but im still overall optimistic on Target as a company.
Will likely look at closing my position at a 10% gain, so will continue to invest and hold my cash in Target until that 10% ROI comes into play.
