Let's Not Be Blind to our Blindness..!Nassim Taleb's:
“My lesson from Soros is to start every meeting at my boutique by convincing everyone that we are a bunch of idiots who know nothing and are mistake-prone, but happen to be endowed with the rare privilege of knowing it.”
He also said:
"The only economic research that seems to replicate out-of-sample is the work of Daniel Kahneman on behavioral biases."
This phrasing reflects Taleb's critique of traditional economics and his acknowledgment of Kahneman's work on human decision-making, which can be tested and applied in real-world scenarios.
Taleb has discussed Daniel Kahneman's research on behavioral economics, particularly Prospect Theory, which studies how people make decisions under uncertainty.
A Wisdom from Daniel Kahneman:
Not only are we sometimes “blind to the obvious,” but also we are “blind to our blindness.”
We all have our own unique experiences and ways of thinking. This can make it hard to see things from a different viewpoint and recognize our own blind spots.
Here are some things you can do to overcome this blindness:
Be open to feedback: Ask trusted friends or colleagues for their honest opinions.
Seek out diverse viewpoints: Read books and articles from people with different backgrounds.
Challenge your assumptions: Actively question your own beliefs and biases.
By being aware of our limitations, we can start to see the world a little more clearly.
Prospect theory is a behavioral economics model developed by Daniel Kahneman and Amos Tversky in 1979. It challenges the idea that people make decisions based solely on logic and maximizing expected utility (total value of possible outcomes). Instead, Prospect Theory argues that:
Decisions are relative: We judge gains and losses relative to a reference point, often our current wealth or situation.
Loss aversion: People feel losses more intensely than equivalent gains. A $100 loss might feel worse than a $100 gain is satisfying.
Diminishing sensitivity: The impact of gains and losses diminishes as the amount increases. A $10 gain might feel more significant than a $100 gain.
Here's how these ideas influence decision-making:
Risk aversion for gains: When faced with choices involving gains, people tend to be risk-averse. They might prefer a guaranteed smaller gain over a risky chance of a larger gain.
Risk-seeking for losses: When faced with choices involving losses, people might become risk-seeking. They might choose a gamble with a chance to avoid a loss, even if the odds are not in their favor.
Prospect theory has numerous applications in understanding human behavior in various fields, including:
Investment decisions: Investors might be more likely to hold onto losing stocks to avoid the pain of realizing a loss.
Marketing and sales: Framing promotions around avoiding losses can be more effective than highlighting potential gains.
Public policy: Policymakers can use prospect theory to understand how people respond to incentives and risks.
Is it possible to be wrong and right at the same time???
My answer is Valid Yes..!
look at the following chart published 70 days ago
it moved in the opposite direction:
Now we can see why Claude Shannon said: “We know the past but cannot control it. We control the future but cannot know it.”
TLT trade ideas

Rolled (IRA): TLT Jan 17th 2025 Short Calls to Feb 21st... for a .28 credit.
Comments: Rolling out the short call aspect of my covered calls (See Post Below) a month for a small credit. Cost basis/break even in the setup is now 90.20.
The small consolation prize is that this keeps my break even right around with the underlying is currently trading.

TLT for 15.04 big bear attack is comingFor TLT, I just wanted to share my own ideas, which are not investment advice, about the interaction of recent geopolitical events and expectations, as a note to history.
In the pre-trading hours, I expect 88.3 with the opening and maybe 86.9 with reaction sales. Since I foresee a movement around 1.045 in terms of Euro / Dollar parity, I suspect that there will be a serious withdrawal with possible reaction sales. In the meantime, I will make a loss as I am in a long position.

TLT Treasuries Long breaks down under VWAP SHORTTLT on a 120 minute chart has continued its trend down since early December after a suddent
uptrend in November lasting for a two month until the end of 2023.
Inflation data is kicking the rate cut down the road of time.
Price has now fallen under the VWAP and all of the EMA lines including the EMA20.
Relative strength trending correlates with price . I conclude, TLT continues to be set up
SHORT or alternatively TBT LONG . I will take short trades at weekly highs on a 30-60
minute chart until signs of a reversal are seen on the chart.

TLT- #TLT Long Idea- $TLT BuysEntry: Price broke through the 4H and 1D swing highs. Will be looking for longs/buys if the market taps the bullish zone.
Stops: Close below the all time lows will invalidate the idea.
Take Profit: Discretionary.

Bullish Falling Wedge continues on TLTBullish Falling Wedge continues on TLT. Inflation Data is screaming higher for longer, however the Bond Market continues to "prophesy" a Pivot from the Fed. Does the Bond Market see a massive Bank Failure Event in the near future?

TLT- Are rate cuts postponed? LONGTLT has been in a broadening wedge and formed a falling wedge within the larger pattern.
Price bounced off the lower supoort trendline in the mid-morning of trading then rising
to break out of the falling wedge. I see this as an opportunity to take a long trade in TLT
and close out a TBT position at the same time. This reversal may be due to the value of
existing bonds with the implications of a rate cut postponed beyond June. The faster RSI line
has recovered to cross the 50 level lending further support to this long trade.

TLT to $200 by EOY 2025?This is a possibility for TLT brought to you by Goodtexture who is hoping you can appreciate this artwork for its noble character and enthusiastic reprise

$TLT bull flagCan long NASDAQ:TLT here...with a 0.50 cents SL per share
Hourly shows SMA support at 93.85
Daily shows SMA support at 94.25

TLT price action after FOMCMajor buying under 92.66 . The day closed higher even after briefly touching a new low.
Fed Chair Powell : Long-term goal is to move to a balance sheet that's mostly treasuries
Source : www.youtube.com

TLT Small upside before FOMCBroke out of a falling wedge pattern. Oversold on the 1hr. There's a great risk to reward ratio here. Set your stop losses accordingly.
Uncertainty still looms...

TLT very bullish energyI dowse stocks and this morning it told me to let the pendulum pick. This seldom occurs, but it went to TLT. It has very bullish energy. Idk if there's news of some sort, or what, but this will be a very large move probably within the next week. Possibly later today.
I'm not going to post a target because it seems too unlikely to hit the answer I have, but I'll update when things are moving and I can maybe get more clarity.
It did say this will be a spike up and reverse down, so there will be a short opportunity as well if we can get the high nailed down.
That's all.

Opening (IRA): TLT May 17th 88 Short Put... for a 1.08 credit.
Comments: Laddering out on weakness, targeting the strike paying around 1% of the strike price in credit at or below the cost basis of the shares I've currently got.

TLT to $90 by 3/22/2024TLT hit resistance at its' 03/2023 weekly channel and its' 12/23/2023 daily channel and is likely to move down to $90 per share by 03/22/2024.

$TLT an Underdog StoryIf it was Rocky Balboa vs the NASDAQ:TLT I'd take the TLT every time..
Not only is TLT Bull Flagging on the dominant chat, it also formed a mean double bottom.
Combined with the divergent and imminent positive crossing on the CCI, i'd say we have one hell of a breakout on our hands Coming Soon™

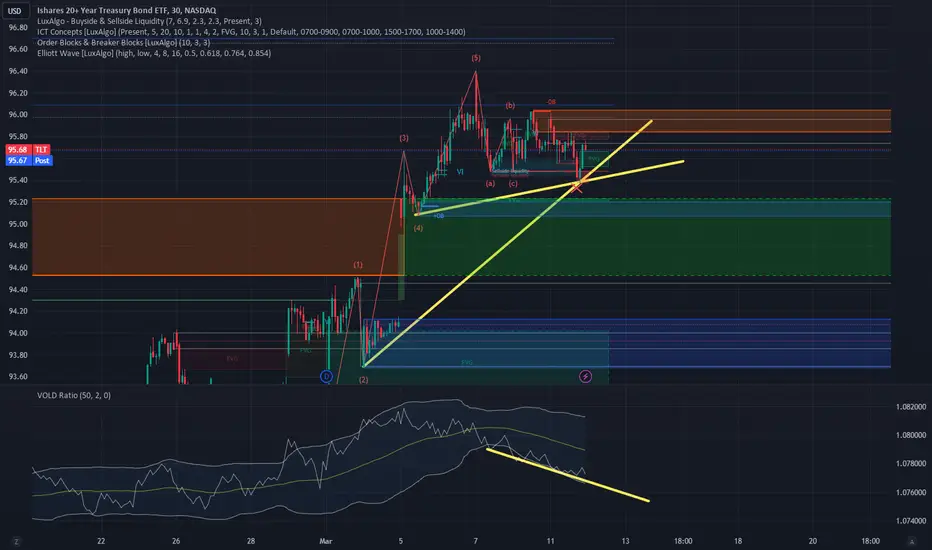
Hidden Bullish Signals Detected Ahead of US Inflation ReportTomorrow it's time again: The US inflation data will be released. Over the past two years, the significance of this report has increased significantly, as it allows conclusions to be drawn about the future monetary policy of the Fed. Accordingly, the monthly event is associated with a lot of volatility, comparable to that seen when the labor market data is released - at least. A look at the 10-year government bonds gives us an idea of how the data will turn out and, in particular, how the market will react to it. Initially, from a chart technical perspective, we see a clear hidden bullish divergence between price and the VOLD indicator. This divergence is most pronounced on the M30 chart, allowing for conclusions about price movements within the next few days, roughly until the end of the week. A look at the put-call sentiment of the bond futures (ZNM24) also shows a very bearish assessment by investors - a signal that has repeatedly proven to be an excellent contrarian indicator. Therefore, we expect the bond price to be positively influenced by the upcoming data and accordingly, interest rates to decline. This, in turn, is bullish for the US stock markets. There are thus good reasons to be optimistic about the new week.
Bond outlook is improvingThis week the TLT long-term US Treasury bond ETF bounced from a key support level.
Meanwhile, the three-month rate of change on core PCE—the Fed's preferred inflation measure—dropped to 2.2%, near the Fed's 2% target. With a looming government shutdown, we're also seeing the first serious Congressional effort to impose fiscal discipline in a long time. Any serious spending reduction would be positive for US bonds.
I don't think the economy is in imminent trouble, so I don't expect bond prices to rapidly climb from here. But I do think the worst of the selloff is probably done and it's a decent time to lock in that ultra low-risk mid-4% return.

Are you ready for Bond ?We have seen how the interest rates increase has been affecting people with mortgages but in the equity/bond market, it also reflect a similar picture.
When interest rates go up, the bond prices fall. And you can see from chart, it has fallen close to 50% from the peak of 180 to 92 before it recovers recently to 106.
Now, if you believe my predictions that FED will start to reduce the interest rates next year, then we can see the bond prices returning back to its glorious days.
So, you can park a certain % of your portfolio funds to this Bond ETF if you like but imo, a large part of your investment capital should still be in equities. The percentage can differs as people believe in portfolio restructuring by different fund houses, etc.

TLT bull caseSame analysis as ZROZ same pattern possibly forming which again coincide roughly with fed decision timetable.
Cup and handle formation.
Could see and initial finalizing of the handle which would take us 7% by April.
Could see that giving us a bull run to end of May for a 20% total gain...
This is not financial advice... it's crystal ball territory. For an accurate future market prediction please immediately see a FNRA licensed qualified tarot reader.

TLT: Piercing Line on the Quarterly Chart Signaling Lower YieldsTLT (The 20-Year US Treasury Bond ETF) has recently completed the measured move of the Ascending Broadening Wedge Breakdown and has now confirmed a Piercing Line on the 3-Month Chart while closing above the 0.886 Retrace. We can also see that the RSI has begun to break out of its downtrend and these combinations of variables seem to point towards the TLT reversing the overall downtrend which could lead to a major move up towards the 50-61.8% retraces between $130 and $143 this would come with bond yields falling off significantly and may also be a sign of investors seeking safer investments over the coming months.

TLT Very close or already bottomedTLT in a fantastic zone here, with TD9 timing next week. Either bottoms here or one more low (even better RR)

Opening (IRA): TLT April 19th 90 Short Put... for a 1.10 credit.
Comments: Although I have a long-dated covered call on in TLT, starting to ladder out some short put at intervals that would result in an improvement of my cost basis in the covered call were I to be assigned shares.
Targeting the strike that's paying around 1% of the strike price in credit.

TLT long 85.8 add 82 can keep sl at 78 , inspired by a chart post I saw somewhere I love these the of set ups , catch a falling knife and put in in your socket and save it for a rainy day
