TLTTLT was a 3:1 compression ratio which was broken. It is now a 2:1 ratio which I believe is still tradable to the upside if broken.
TLT trade ideas
TLT - Successful Three Week Test of the LowTLT tests the closing low of three weeks ago. This used to be a pretty reliable indicator and a buy signal for me. Took a pilot position at 99.80. Stocks appear to be overextended so any selloff might cause a move to bonds.

TLT, PFIX lightFeeling that this along with the gap to be filling in TLT means we are going to have lower CPI and PPI. TLT targeting 89, care of TLT gap PFIX shines a light.
PFIX is the only bond like security that has clarity in trades

Yields Prepped to Spike Higher after a Confirmed TLT BreakdownThe TLT has broken down an Ascending Broadening Wedge and given us one Bearish Confirmation back test; now we are looking for a second lower high within the range of the breakdown to truly get convicted on the move. However, for the time being, I do think this chart should be watched, as I have a suspicion that a lot of the shorter- and midterm bond yields are going to spike higher along with the US Dollar for reasons I already explained in this post here:

TLT- full tilt!100 to 95 in 3 days! Containment ratio about 2:1 so I’ll look to get long on higher high maybe. Could be an intractable downtrend but I’ll trade for a decent bounce.
Every gap we need to fill is above priceNow is that a reason to take a trade? Of course not
however it is not a matter of if, it is a matter of when for the recession, and rate cuts.
a credit crisis thrown in there will only make a holder richer quicker
don't fear the refunding either, supply creates it's own demand (Say's law)

TLT | Watch this one RIP Higher | LONGiShares 20+ Year Treasury Bond ETF seeks to track the investment results of the ICE U.S. Treasury 20+ Year Bond Index (the "underlying index"). The fund will invest at least 80% of its assets in the component securities of the underlying index, and it will invest at least 90% of its assets in U.S. Treasury securities that the advisor believes will help the fund track the underlying index. The underlying index measures the performance of public obligations of the U.S. Treasury that have a remaining maturity greater than or equal to twenty years.

TLT: Double Bottom, Buy LEAPS! Following our successful S&P 500 Index trade from last February, it is time to consider the next major trade of opportunity: TLT. This trade consists of buying January 2025 TLT LEAPS (long-term call options) currently trading for $8.50. That means TLT has to hit $108.50 before January 2025 for you to break even.
The Fed forecasts that the Fed Funds rate will be nearly 1% lower by the end of 2024. Some forecasters, however, predicts even lower rates. www.morningstar.com
Politics: With Biden running for reelection (likely vs Trump), political pressures may mount to prop up the economy, although that is beyond the scope of this analysis.
Nearing End of Hiking Cycle : In any case, we can confirm based on the Fed's own statements that its hiking cycle is nearly up. In the past two hiking cycles, TLT has surged significantly following the end of the Fed's hiking cycles, within 18 months of the end of each cycle. If the past two hiking cycles, are any guide TLT could reach levels of 140 or higher. Notably, the end of the 2018 hiking cycle led to a surge in TLT without a recession.
Venus Retrograde: for whatever reason, Venus Retrogrades every 18 months have recently corresponded with major changes in direction for TLT. The current massive selloff began in early 2022, and as of July 25, Venus is again in Retrograde until the first week of September. Thus, TLT is likely to once again reverse.
Technical Analysis : At 97, the risk/reward ratio of January 2025 LEAP Calls at 100 are a strong trade. TLT has made an apparent double bottom in an upward sloping linear regression channel going back to last October.
I'm going to buy some January 2025 TLT calls at a 100 strike and hopefully watch them rip by up to 10x over the next 18 months. Crypto doesn't give us 10x runs anymore, so we have to get creative.

TLT ratio compared to Tech (QQQ)Lots of news this week, wow. Besides fundamentals and what everyone thinks, we might have a trade setting up that is very... unusual? The narrative has switched very quickly from bull market to fear. Interest rates are surprising everyone (not me, I've been long rates and short indexes this week) ; although, ratios are lining up for a favorable r/r in TLT.
TLT has long been a safe haven trade, if we get a safe haven type event here soon, owning spreads on these with 2-3% upside in the coming weeks is paying off multiple 100s of %.
Taking a stab here, have spreads exp next week friday.
I've closed some of my short spreads on QQQ's and DOW, this is a small insurance play to protect the other half of the trades and to give myself exposure to potential upside.
Ratio to tech and indexes right now show bullish signs, but no confirmation yet.
You've all seen the chart overlay of stocks compared to bonds, this could be an event that triggers a short term price reversal, even though the news may not present itself as an event for bonds.

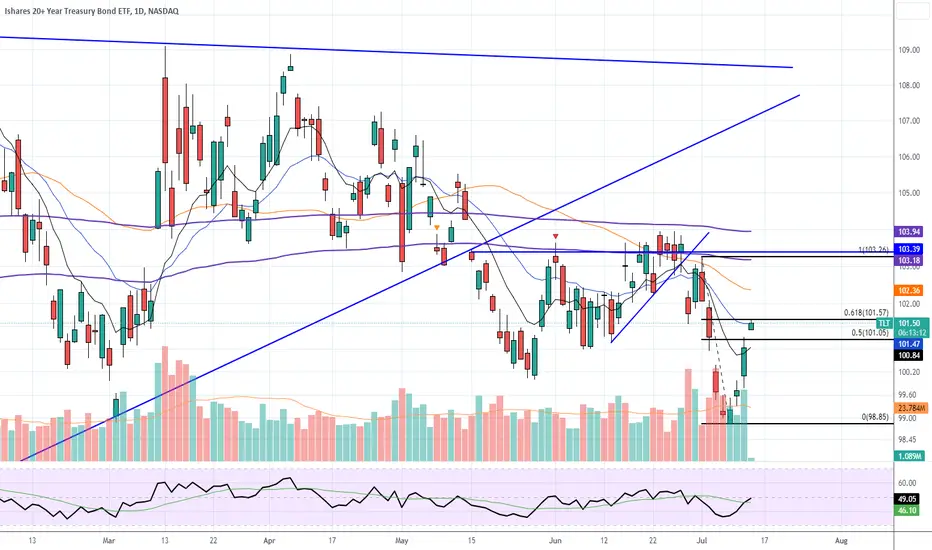
Bonds in the week ahead look for TLT to rally now back to 103.1The chart posted is that of the TLT we seem to have made another wave B low I would look to see it now hold and rally back to 103.1 this week

Opening (IRA): TLT December 15th 91 Short Put... for an .86 credit.
Comments: Laddering out at better strikes than I've got on currently, targeting the 16 delta strike, wherever that lies. I doubt the underlying goes this low, but if it does, I'm fine with taking assignment of shares and selling call against.

Opening (IRA): TLT November 17th 92 Short Put... for a .79 credit.
Comments: Hitting on some of those treasuries ... . Targeting the 16 delta strike. I'm fine with either getting assigned shares and proceeding to sell call against or taking the risk premium and going home.

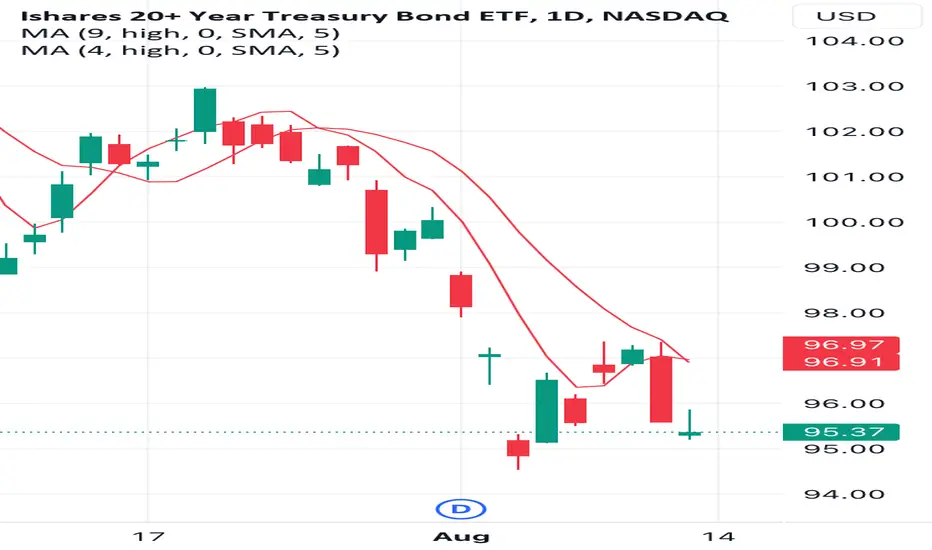
TLT Short term Treasuries Bullish LONGTLT as shown on a 30 minute chart shows TLT in a narrow range last week and then a pivot
down to begin this week followed by a downtrend and a small correction until then the fed
news of the rate hike came out. Today the general market dropped after some federal financial
data came out and a treasury auction was a dud bond auction with little transactions occurring
confounded by Bank of Japan actions inconsistent with the path of the US Fed.
The mass index indicator has signaled a reversal as the signal rose above the reversal zone
and then dropped below the zone thus triggering. The Relative Trend Index documents
the end of the red downtrend with the signal line nearly returning above zero. Overall, I think
TLT traders overreacted to the federal news and the catalyst from Japan. I believe
this to be a good point to enter long using the pivot low as the stop loss. Targets are 100.5
just below the mean anchored VWAP and 101.5 just below POCl line
volume area of the intermediate term volume profile. This offers modest potential profile
for a relatively low risk. However, I intend to trade this intraday as a same day expiration
(0DTE) option striking 101. I will set a set a stop-loss on the option of 15% while expecting
potentially 50-200% ROI making for an acceptable ratio.

TLT 2H 2023Keeping an eye on TLT, considering the way treasury yields have been moving. This could get ugly.

TLT - is now the time to start accumulating?Long duration treasury ETF's have long been touted as hedges against risk and inflation. However, treasury prices and rates have an inverse relationship. When the US Treasury issues new bonds during a rate hiking cycle, it depresses the prices of the long duration treasuries within these ETFs. Conversely, when rates reach their peak and subsequently start to decline, these ETFs will hold treasuries with higher rates than the newly issued ones. This explains why we see TLT price increasing in a low rate environment and decreasing in a rising rate environment.
If we are near the conclusion of this rate hiking cycle we should see a little more consolidation in TLT, followed by price increase. I have been and will continue to add to my position anytime we are close to $100 during this consolidation. I'll begin to take profit $112-114 and then re-evaluation market conditions.

Opening (IRA): TLT December 15th 94 Short Put... for a .89/contract credit.
Comments: Here, targeting the 16 delta strike in the 20 year+ paper exchange-traded fund to round out short put rungs in the third quarter.
I may continue adding rungs into 2024 if the underlying continues to hang around this level, since the Fed is supposedly forecast to cut rates at some point going forward.

If we take the 200 we're goodIf we overtake the 200 day moving average and that $103 level we could push to the $109's.
I'm really not worried about hikes as we priced in another one and no more are expected by the mass amounts of economists
inflation is at 3%, let's see if it stays there bc of base affects.
Looking for the upside move, the Yuan and Yen are also point of this trade that support it's upside. Also the UK Gilt market.
I'm confident in this, we also just got a week jobs report maybe that continues.
Target for me is $115 - $120

Biggest most amazing short squeeze TLTThe iShares 20+ Year Treasury Bond ETF seeks to track the investment results of an index composed of U.S. Treasury bonds with remaining maturities greater than twenty years.

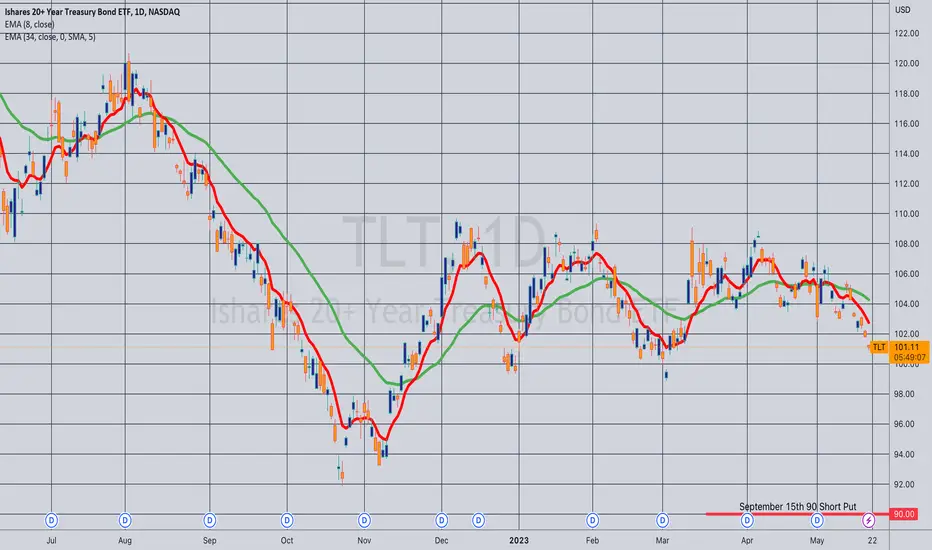
Opening (IRA): TLT September 15th 90 Short Put.... for a .73 credit.
Comments: The third rung of a TLT short put ladder. Will look to add at better strikes should we get additional weakness.
Bonds Bull Flag?You can ignore my arrow prediction but just for fun let's see how correlated it is.
But what we see here is that the NASDAQ:TLT broke below its triangle and now seems to be reversing after a cool CPI print. It seems to have make a bull flag and big consolidation range that I drew out in those purple lines.
Let's see if the bond market can continue with the bullish moves as it does make sense due to the way that the rate decisions have been priced in.
IMO one more hike then cuts next year and 2019 level rates by end of 2025.
NASDAQ:TLT can get to $115-$120 by May-July 2024
Exciting stuff let's see.

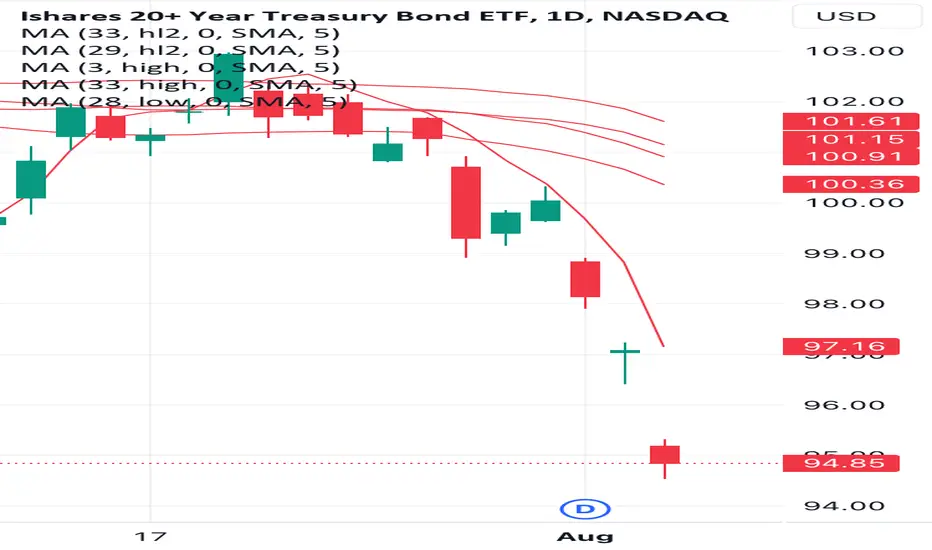
TLT major support 98 and whyThe chart posted is the last bullish possible wave structure . within the sideways movement since oct cycles We are setting up for a MAJOR PANIC INTO AUG 25th and a lower low in oct 10 week trade with this in mind

One of the most beautiful charts $TLT Wow what a beautiful chart. Almost done with a full market cycle. You may know this as a "dead cat bounce" or the "ANGER" part of the cycle... lol.... but we haven't even hit depression!? woooooo lol. What this indicates is that ole Jerome Powell boy isnt done raising rates..... and he is for sure going to keep them higher for longer... the next couple of years according to timing on this chart. "higher for longer"
Self explanatory chart.... just a thing of beauty
