Potential Future Price Action for BondsA dip of TLT into the high 60's is certainly a possibility, and a prime opportunity for further accumulation.
These things come and these things go, do not be surprised and act as if you did not know.
The underlying economic indicators are certainly abysmal at this time and place. Pretending otherwise will certainly end in disgrace.
Perhaps we see a short term "resolution" to the Chinese trade wars. Only to have something else trigger the eventual downside in markets, leading to bonds as a safe haven along with Federal Government intervention to encourage stabilization
TLT trade ideas

The Bitcoin Trust Flow Cycles Model: What Comes Next (chart)b]📉 The Bitcoin Trust Flow Cycles Model: What Comes Next
Video idea here:
Friends, if you’ve seen my last two posts, you already know — we’re no longer relying on broken halving cycles or outdated narratives.
We’re now in the realm of The Bitcoin Trust Flow Cycles™ by FXPROFESSOR — a framework that maps how trust moves between Bitcoin and traditional assets like U.S. Treasuries .
And today’s update? It might be the most important one yet.
🔁 Quick Recap: What Is This Model?
This model tracks Bitcoin’s relationship to long-term U.S. Treasury Bonds (TLT), cycling between:
• Correlated Periods (Blue): BTC and TLT move in the same direction
• Inverted Periods (Green): BTC and TLT move in opposite directions
And here’s the magic:
These flips often occur right at key structural levels in the bond market.
🧠 Where Are We Now?
We’re still in an Inverted Period — the 6th major one.
• TLT (Treasuries) are dropping again
• Bitcoin is rising against that backdrop
• The previous support at ~86.8 failed — we are now sliding toward the next major level
That level?
📌 71.32 – the all-time structural support for TLT going back to 2004
It’s the same zone that sparked Bitcoin’s explosive moves in the past.
📉 My Expectation:
• TLT continues sliding lower
• It finds support around 71–76
• Once that happens, we enter a Reversion Phase — where Bitcoin and TLT rise together again
• Bitcoin doesn’t just “survive” the macro shakeout — it thrives on it
This would be the 6th inversion-to-correlation flip in the model — and historically, these have marked powerful Bitcoin trends.
📊 Why This Model Matters
This isn't just about price.
It’s about trust .
It’s about rotation .
It’s about macro capital flow .
Forget halving hype — this model focuses on how institutional trust migrates between old systems (bonds) and new systems (Bitcoin).
When TLT fails, Bitcoin rises.
When TLT finds support, Bitcoin joins in.
This is not just a macro hedge.
This is the new cycle narrative .
🔍 What to Watch:
• Does TLT drop to 71?
• Do we find a bottom and reverse?
• Does BTC correlate again and break out above 115?
If so — we may be on the cusp of a new correlated bull leg .
This post builds on the foundation I laid here:
📌
📌
This is part 3.
The signal is there.
The rotation is happening.
The trust is shifting.
Are you watching?
One Love,
The FXPROFESSOR 💙

The Bitcoin Trust Flow Cycles Model: What Comes Next📉 The Bitcoin Trust Flow Cycles Model: What Comes Next
Friends, if you’ve seen my last two posts, you already know we’re not talking about your average halving theory anymore. We're entering a new era of Bitcoin cycle analysis — and this model may change the way we look at macro rotation forever.
This is an update to The Bitcoin Trust Flow Cycles™ by FXPROFESSOR — a cyclical framework built around one question:
When trust flows in and out of traditional assets like Treasury bonds... what does Bitcoin do?
In this post, we zoom into the latest data: • TLT is testing key support again • Bitcoin is still rising — but in an inverted period • The next major reversion event may be approaching
I'll walk you through what happens when correlation flips , why these cycles compress over time, and how we could be approaching the next Bitcoin surge — not because of supply, but because of macro trust flow .
If you’ve been wondering what’s really moving the market... this might be the chart you’ve been missing.
One Love,
The FXPROFESSOR 💙

New era: 'The Bitcoin Trust Flow Cycles'🏆 The Bitcoin Trust Flow Cycles™ by FXPROFESSOR
Friends, today I’m sharing what may be the most important Bitcoin framework of 2025.
Forget the broken halving expectations. Forget the chaos of macro headlines.
What if the real signal has been here all along?
What if Bitcoin’s true rhythm follows the capital rotation between itself and the U.S. Treasury market?
📊 Introducing: The Bitcoin Trust Flow Cycles™
This is not a model of where Bitcoin could go (like Stock-to-Flow)…
This is a model of when and why it moves — based on the trust rotation between U.S. Treasury Bonds (TLT) and Bitcoin.
What I’ve found is a repeating structure — not based on supply or halvings, but on macro trust dynamics .
🔁 The Two Core Phases:
• Correlated Periods 🟦 (Blue zones): BTC and TLT move together — both rising or falling
• Inverted Periods 🟩 (Green zones): BTC and TLT move in opposite directions
These aren't random — they're structural rotations that occur at key technical levels in the bond market.
🧠 The Cycle Timeline:
Jan 2019 – Feb 2020 → Correlated (pre-COVID calm)
Feb 2020 – Sep 2021 → Inverted (Fed QE, Bitcoin moon)
Sep 2021 – Nov 2022 → Correlated (everything dumps)
Nov 2022 – Oct 2023 → Inverted (TLT collapse, BTC recovers)
Nov 2023 – Aug 2024 → Correlated (sideways digestion)
Aug 2024 – Now (Apr 2025) → Inverted again — and compressing fast
We're now in Period 6 — an Inverted Period — but all signs point to an upcoming Reversion.
📉 What Happens at Each Flip?
These transitions tend to occur when:
• TLT hits major channel support or resistance
• Macro fear or liquidity shocks drive trust shifts
• Smart money starts reallocating across asset classes
Right now, TLT is at channel support — a zone that has previously triggered reversions into correlated periods.
📌 What Comes Next:
According to the Bitcoin Trust Flow Cycles™ :
→ We are statistically due for a reversion** back into correlation
→ If TLT bounces from 76–71 zone… BTC may follow — not fight
→ The target remains: BTC breaking above 115 resistance
This flip — from inverse to correlated — has historically marked breakout windows for Bitcoin.
🔮 This Is Bigger Than a Halving
Plan B’s Stock-to-Flow gave us valuable insight into long-term valuation.
But it doesn’t explain timing.
This model isn’t about supply mechanics.
It’s about macro trust mechanics .
When institutional confidence leaves Treasuries…
And enters Bitcoin…
That’s the rotation we track.
That’s what moves the chart now.
🎯 Watchlist: • TLT support: 76 → 71 zone = reversal signal
• BTC breakout trigger: 115 resistance
• Cycle shift: Reversion = Bitcoin joining TLT upside
If this plays out, it could mark the most important trust cycle breakout we’ve seen since the COVID inversion.
Bitcoin doesn’t need permission anymore.
It just needs a macro trigger. And this model helps us spot it.
One Love,
The FXPROFESSOR 💙
📌 Missed the full credit market breakdown? Check my recent posts on BKLN, HYG, LQD, and TLT to understand the full Trust Flow rotation.

How Will Uncle Sam Strike Back? – U.S. Treasuries on the Edge📉 How Will Uncle Sam Strike Back? – U.S. Treasuries on the Edge
After covering leveraged loans ( BKLN ), junk bonds ( HYG ), and investment-grade corporates ( LQD ), we now focus on the most important piece of the U.S. credit puzzle: Treasuries.
Specifically, the long end of the curve — tracked by TLT .
📊 What the Chart Shows
Left Panel (3D Chart)
• All-time highs in Feb 2020 at $179.80
• Long-term trendline going back to 2004
• Critical support was broken in 2022 — a structural breakdown
Right Panel (8H Chart)
• Clear descending channel since 2020
• Price has rejected from the channel top multiple times
• Recent bounces off the lower channel suggest a potential final flush
🧠 What Happened in 2022? (can't blame Trump for that...)
This wasn’t politics — it was policy.
• The Fed's fastest hiking cycle in decades
• Liquidity evaporated
• Long-duration bonds were abandoned
• The key trendline that had held for years was finally lost
That line — once support — is now resistance.
📐 My Technical Expectation
I expect one final slide before a reversal.
• Channel base sits at ~$76.32
• My projection targets $71.30 or even $68
• That would mark new all-time lows for TLT
🟡 After that? I expect a macro reversal , targeting:
• 🔼 $101 – mid-channel reversion
• 🔼 $112–115 – former support zone (2019–2022), now resistance
🔍 Macro Context
This chart isn’t just about price.
It reflects how markets are pricing confidence in U.S. debt .
And right now?
That confidence is shaky . With Trump turning 'orange' and taking it out against almost everyone else: China but also his allies(EU, Canada, Japan, etc )
🔄 Recap of the Series So Far:
• BKLN – record leveraged loan outflows
• HYG – junk bonds bounced at historical support
• LQD – investment grade bonds holding steady
• TLT – U.S. Treasuries under pressure, and possibly breaking down
📌 Next up?
🟧 CRYPTOCAP:BTC
Because when the world begins to question Treasuries , the search for alternative stores of value begins.
One Love,
The FXPROFESSOR 💙
ps. wait for the next posts...they might be epic!

TLT Long and NeutralCurrent demand Zone (85) confirmed,
Long entry 87.4
no Stop ,
Target 89
Risk management is much more important than a good entry point.
I am not a PRO trader.
In my trading plan, the Max Risk of each short term trade should be less than 1% of an account.

Is TLT Nearing a Rebound After Significant Selling Pressure?
-Key Insights: TLT’s persistent decline reflects heightened selling pressure
amid rising Treasury yields and bearish macroeconomic sentiment. Oversold
conditions suggest a potential technical floor near $84, creating an inflection
point for contrarian traders. Investors should closely monitor macro trends and
foreign entity Treasury sales to gauge recovery potential in the bond ETF
market.
-Price Targets:
* Long Position Strategy:
- Stop Level 2 (S2): $82.80
- Stop Level 1 (S1): $83.70
- Target Level 1 (T1): $87.60
- Target Level 2 (T2): $88.90
-Recent Performance: TLT has experienced notable weakness, declining by over 6%
in recent sessions as Treasury yields climbed sharply. Investor sentiment
remains bearish, with foreign entities selling off U.S. Treasuries, further
pressuring the fund. The ETF now hovers near critical technical levels, with
support potentially forming around $84.
-Expert Analysis: Market experts highlight TLT’s oversold condition as a
potential turning point, contingent on easing macroeconomic tensions. However,
continued selling pressure and rising yields present challenges. Price action
near $84 will be key in determining whether the ETF can stabilize or faces
further declines. Upside recovery depends on shifting sentiment and potential
safe-haven reallocation.
-News Impact: Increased U.S. Treasury sales by foreign entities such as China
and Japanese hedge funds significantly amplify selling pressure on TLT,
contributing to rising yields. The broader market's focus on equities and
cyclical shifts adds to the headwinds facing the bond ETF. Investors should
remain cautious amid signals of extended weakness and breaking technical levels.

Ishares 20+ Treasury Bond | TLT | Long in the $90sIshares 20+ Treasury Bond NASDAQ:TLT are particularly sensitive to interest rates: the price moves up when they are lowered and down when they rise. Locally, I'm witnessing banks lower their interest rates for CDs and shorten the duration for those with high-yielding returns. The general political rhetoric, especially due to the election cycle, is a push for the Federal Reserve to drop them. Now, despite the possible negative economic implications of lowering interest rates too soon if inflation is high, there is a good probability they may be lowered (even slightly) in 2024... perhaps September?
This analysis isn't to time the bottom perfectly, though. Instead, it's a probability assessment. Personally, TLT in the low $90s is in a long-term "buy-zone".
Target #1 = $104
Target #2 = $122
Target #3 = $170+ (very long-term view / economic crash... let's hope not, though)

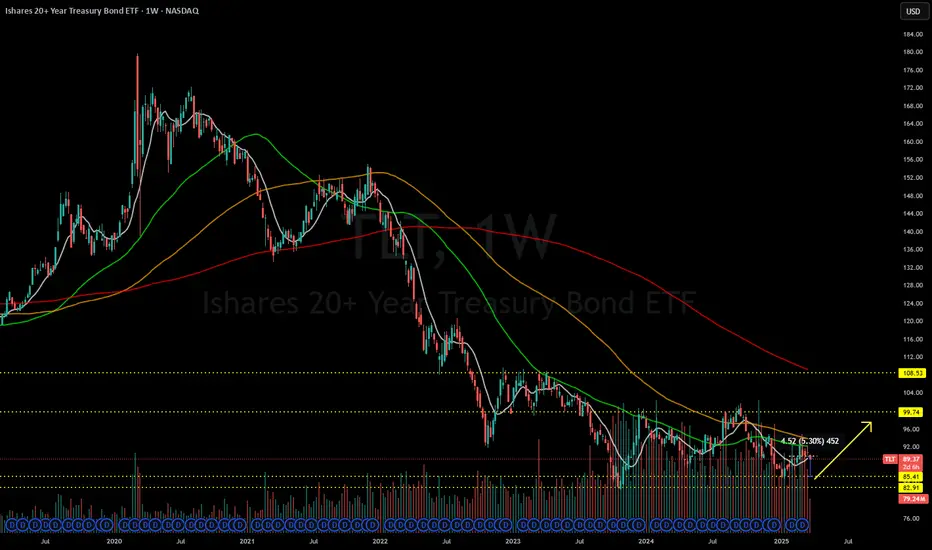
iShares 20 Year Treasury Bond | TLT | Long in the $80sFor the patient, one of the "safest" investments is in long-term treasury bonds (specifically NASDAQ:TLT ). For those who may not understand why, bond prices move inversely to yields. If interest rates drop (which the Federal Reserve has stated is going to happen this year), NASDAQ:TLT will rise. If interest rates rise (like what happened in early 2022), NASDAQ:TLT will fall. But all information from the Federal Reserve points to interest rate cuts starting this year *or* in the near future.
As of April 1st, 2025, the dividend yield for NASDAQ:TLT is 4.52%. That interest rate beats the vast majority of savings accounts right now. I don't think we will see NASDAQ:TLT prices in the $80's longer than a year or two. A contrarian may argue "inflation is rising!", but the data continue to point to it actually stabilizing. Yes, prices are higher compared to 4-5 years ago for just about everything... but the higher prices are "stable". Tariffs may put a slight wrinkle in this stability in the near-term, but I think the economy is already slowing and the Federal Reserve will be pressured to start dropping interest rates sooner than later.
I believe a global economic bust is inevitable - but no one knows when. Anyone who says they can time it is a charlatan. If/when a global economic bust occurs, the Federal Reserve will drop interest rates (like what happened in 2020) to get the economy juiced up again. NASDAQ:TLT will double in price or go further.
My general point is I *believe* NASDAQ:TLT is nearing a low and any future declines (especially below $80) are personal opportunities for buy-and-hold. It's a solid hedge with a good dividend. Options don't give you that and timing events is a guessing game for every retail trader. So, as someone who tries to think beyond the "now", I am gathering shares, enjoying the dividend, and not touching them until a global economic bust occurs. Currently holding positions at $85, $86, $87, and $90.
Targets:
2027: $100.00
2028: $105.00
2029: $110.00
2030: $115.00
Bust (unknown timing): $170+

Is TLT in a new down trend?Just simple marking of the various lows and highs of TLT shows that the last swing high of the chart was lower than the previous one as was the low. Therefore this could indicate that the bond bear market is actually continuing and that the previous apparent reversal was a false breakout. If we close this week below the previous swing low I think that spells trouble.

TLT Short Term OutlookHere we have TLT moving according to our previously published chart. We think TLT will move sideways, consolidating in the near future before finding direction. Although the outlook for TLT and the Bond Market is positive, in the near short term we may see a decline in the bonds market and choppy movements. We anticipate a zigzag move followed by a possible price retest of near $85 before bouncing back up.

TLT Analysis: Bonds in Turmoil Amid Tariff ChaosThis week, we've witnessed a dramatic shift as equities and U.S. government bonds cratered simultaneously. Trump, facing intense market backlash, notably reversed his aggressive tariff stance—forced by China's strategic response and market realities. At the start of the week, the yield on 10-year U.S. Treasuries stood at 4.00%, skyrocketing to 4.51% in just a matter of days—a massive jump by typical investor standards. This rapid rise significantly impacts mortgage rates, car loans, and credit card borrowing, reflecting broader financial stress.
The sharp rise in bond yields resembles the forced-selling reaction to Liz Truss and Kwasi Kwarteng's mini-budget crisis in 2022. Trump's tariff-induced inflation fears and notably weak demand in recent U.S. Treasury auctions further intensified bond selling pressure.
Technical Levels & Analysis for TLT
Hourly Chart
TLT has clearly broken crucial support levels, highlighting significant bearish momentum:
• Resistance Zone: $90.00 - $90.50
• Current Trading Zone: Approximately $88.50
• Support Zone: $86.50 - $87.00 (critical level to watch)
Daily Chart
The daily perspective confirms bearish sentiment with substantial price drops and increasing volatility:
• Major Resistance Area: $92.50 - $93.50 (strong overhead resistance where trapped longs may reside)
• Immediate Support Area: $86.50 - $87.00
Trade Ideas & Scenarios
Bearish Scenario (primary):
• Entry Trigger: A confirmed break below the immediate support at $86.50.
Profit Targets:
• Target 1: $85.00 (short-term follow-through)
• Target 2: $83.50 (potential deeper continuation)
• Stop Loss: Above $88.50, limiting risk in case of unexpected bullish reversal.
Bullish Scenario (counter-trend play):
• Entry Trigger: Strong recovery and hold above $89.00.
Profit Targets:
• Target 1: $90.50 (initial resistance)
• Target 2: $92.50 (secondary resistance level)
• Stop Loss: Below recent lows near $86.50 to tightly manage risk.
The rapid shifts in bond yields and tariffs are causing heightened market volatility. Investors must remain vigilant and maintain strict risk management. Watch these key TLT levels closely, especially amid ongoing tariff news and bond market reactions.

Analyzing TLT's Current Technical SetupRecent price action in TLT has raised questions about whether the recent sell-off reflects foreign selling pressure, potentially driven by liquidity shifts into equities, or simply represents healthy profit-taking. Key economic data from Japan may provide context to this move, as Japan's current account surplus hit a record high at JPY 4,060.7 billion in February 2025, driven by strong exports and reduced imports.
Technical Analysis:
TLT experienced a sharp reversal after testing resistance levels around $93-$94, indicating significant selling interest at these upper bands. Currently, the price is approaching crucial support levels, with key areas of focus being $89.78, $89.20, and $88.60. Price action in these zones will be critical to watch for confirmation of further direction.
Bullish Scenario:
Entry: Look for support confirmation around $89.78 or slightly lower at $89.20.
Profit Targets:
First target: Rebound towards the previous resistance around $91.25.
Second target: Extended move towards the upper resistance zone around $93.
Stop Loss: Clearly place a stop-loss below $88.60, protecting against a deeper breakdown.
Bearish Scenario:
If price decisively breaks below $89.78 with strong volume confirmation:
Entry: Consider short positions on confirmed break and retest failure below $89.78.
Profit Targets:
First target: Next immediate support at $89.20.
Second target: Stronger support area at $88.60.
Stop Loss: Set a stop-loss slightly above $90.30 to manage risk effectively.
Market Context:
Japan's record current account surplus could signify reduced foreign buying pressure on US Treasuries, potentially contributing to the selling in TLT. This macroeconomic backdrop underscores the importance of watching these key technical levels closely.
Final Thoughts:
Keep a close eye on volume and RSI for confirming indicators, ensuring trades are executed with clear risk management. Given the macroeconomic context and current technical setup, caution and flexibility in trading decisions remain essential.

From Keynes to Adam Smith: SPY & TLT React to Policy Crossroads
NASDAQ:TLT and AMEX:SPY have experienced significant declines at the open today , with the latter signaling a market shift away from a Keynesian economy—dependent on government spending that favors a handful of well-connected corporations—toward an Adam Smith-inspired liberal economy guided by the invisible hand. Could this transition, amid all the talk of tariffs, potentially drive inflation? The future direction of NASDAQ:TLT will hinge on how these new policies are implemented, particularly given that $2.2 trillion from the Fed’s 2020–2022 quantitative easing still lingers in the system. Pushing for interest rate cuts at this stage would certainly be a hasty move. Today’s rejection of technical resistance at $94.86 speaks volumes

TLT - Monthly Targets (Long Term)Markets are currently tight squeezing due to Trumps terrifs etc, something has to give in, based on this chart:
- TLT has found a bid at .963 Fibonacci level @ $82.42 (EXTREME RETRACE)
- Dec 2, 2024 = the 369 ratio in time for $82.42 (time & price 📐)
NEXT TARGET PROJECTION IS 50% OF THE MAX TARGET ANGLE = ($121)
(BETWEEN 2025 - 2029)
MAX TARGET = $183 - $212
(BETWEEN 2025 - 2034)

Opening (IRA): TLT May 16th 96 Covered Calls... for a 92.13/contract debit.
Comments: Taking refuge in 20 Year + Paper until this market sorts itself out, targeting the strike that pays around 1% of the strike price in credit (the -96C paid 1.15).
Will generally look to roll the short call down at 50% max to the strike paying 1% of the strike price in credit if greater than 30 DTE remain; roll out at 50% to the next available monthly if <35 DTE remain.

TLT poised for bull flag breakout this weekIncreased volatility from tariff news will likely send us out of this channel if TLT shows even slightly bullish price action.

TLT 103American 20+ bonds continue to hold a significant weight in my portfolio, and most importantly, the factors supporting their growth are increasing day by day.
Inflation in the U.S. will decline not due to monetary policy but because of economic stagnation and potential risks. Tariffs will raise goods prices, but at the same time, they will negatively impact consumer sentiment.
TLT is heading toward 103, which aligns with my technical outlook.

TLT longer term high...I do dowsing and checked on TLT today. My work is suggesting this is a longer term high and that TLT will move down to around $85.
I'm not the best at getting time frames for things to occur, but I ask anyway. At a minimum dates more often than not signal some kind of reversal - though it may only be short term. Anyway, I get $85 in about 21 days, or 3/19. I like TLT options. They're cheap and if TLT can keep from any close higher than these highs, I think good odds for down.

Long TLT/Short Bitcoin.Good morning everyone here’s an idea that I see playing out; someone or some entity found arbitrage by shorting the long end of the curve (TLT) and going long bitcoin. We could see the bonds rally and bitcoin sell off. Cheers,

TLT Wyckoff accumulationTLT appears to be in an accumulation pattern. Bond Yields look distributive, so that correlates.

TLT hitting bottomTLT near the bottom.
Rates go down, bond face value go up.
Long-term bonds rates need to come down otherwise US government interest payments will take up a high parentage of their budget.
Gold vs. U.S. Government BondsIs gold safer than government bonds? The data suggests so.
Since March 2020, long-term U.S. government bonds with maturities over 20 years have fallen close to 50% in value. Gold is up almost 100% over the same period.
Do you think these trends will continue? I certainly do.
