LONG Term Treasuries With the yield curve inverted, inflation slowing rapidly and global growth expectations revised downwards, long term treasury bonds are looking like an excellent allocation right now.
A reversion to 2% on 30 Year yields over the next couple of years would produce double digit Annualized returns.
Full story here: matthewiesulauro.substack.com
TLT trade ideas

TLT Trade Levels & TargetsIn this update we review the recent price action in TLT and identify the next high probability trading opportunities and price objectives to target

TLT - US 20 Year Treasury SELLOFF Treasury yield is the effective annual interest rate that the U.S. government pays on one of its debt obligations, expressed as a percentage. Put another way, Treasury yield is the annual return investors can expect from holding a U.S. government security with a given maturity.
Treasury yields don't just affect how much the government pays to borrow and how much investors earn by buying government bonds. They also influence the interest rates consumers and businesses pay on loans to buy real estate, vehicles, and equipment.
Treasury yields also show how investors assess the economy's prospects. The higher the yields on long-term U.S. Treasuries, the more confidence investors have in the economic outlook. But high long-term yields can also be a signal of rising inflation expectations.
Treasury yields are inversely related to Treasury prices.
Treasury yields can go up, sending bond prices lower, if the Federal Reserve increases its target for the federal funds rate (in other words, if it tightens monetary policy), or even if investors merely come to expect the fed funds rate to go up.
An inverted yield curve on which the yield on the 10-year Treasury note has declined below that on the 2-year Treasury note (to cite just one popular benchmark) has usually preceded recessions.
A rising yield indicates falling demand for Treasury bonds, which means investors prefer higher-risk, higher-reward investments. STONKS GO UP, FORCING THE FED TO REMAIN HAWKISH! A falling yield suggests the opposite.

TLT BONDS TREND UPTLT is showing insider buyers into this etf... showing inflation might have peaked and bonds will be worth invest now... levels on chart... INSIDERS buying it

Update On Interest Rates TrendThis is a short video showing the possible reversal in the interest rates trend and direction for the improvement.

Trade of 2023? TLT! Big Boring BondsWhat is the big trade for 2023? I think it is going to be BONDS. This is my thesis on going long NASDAQ:TLT to start 2023. I walk through the reason that when yields go up, bond values go down (as did TLT) and why I think that TLT is likely to go back up over the course of this 2023 and beyond.

TLT Inverse Head & ShouldersI was too busy singing the Bull Blues yesterday to notice.
Today had flipped upside down to form a 15m Inverse Head & Shoulders on TLT.
Price target is 102.13
I was worried all hope of a bullish start to the new year was lost.
Jan 10 will be the next date to put on on my Calendar.

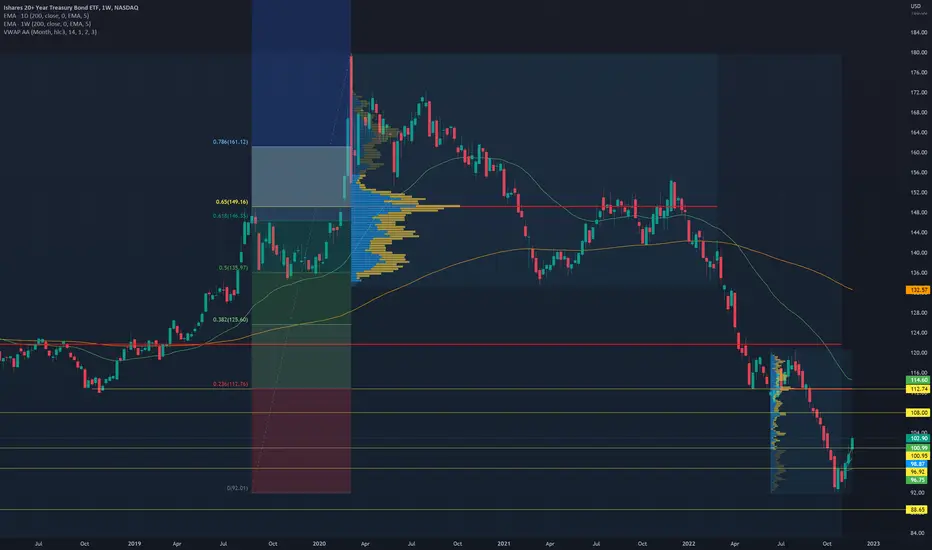
The Anatomy of the TLT; Cycle analysis by ThestructuredThis is my dissection of the TLT chart into the classic stages of a bubble, with time cycles. Each stage is present and the TLT appears to be in a bottoming process. I'm a big fan of using Fib channels combined with time cycles, because with fib channels, you are looking for a certain line to get hit, wherever that may be, as opposed to traditional fib retracements and extensions where you are looking for exact numbers. I find that with regular fibs, price often overshoots or undershoots them, whereas using a channel, it is more so a time based touch of a line, which si why it works so well with time cycles.
Last year I had used these fib channels and cycles to find the current bottom on the TLT, which was an exact touch of the 161.8, right at a (red) time cycle trough region, and also at a strong volume profile node.
There are larger, converging cycle troughs shown which should be somewhere in the September area of 2023. It is unclear at this time whether that region will be a higher low, or 'the bottom' (assuming that the 92 area wasn't already 'the' bottom, which it might have been.
In any case, I am planning on investing this fall in that major trough zone, regardless of if price is higher or lower than it is now, when that timing region comes.
Disclaimer: These charts and posts are a reflection of my own analysis and opinions based on my own analysis. I could be wrong, nothing is guaranteed, and my posts are for educational purposes only, as they are my own pure speculation, and should not be taken as investment advice of any kind. Do you own DD!

Ishare 20+ Years Treasury Bond Fund USA Ishare 20+ Years Treasury Bond Fund USA
#debadip #profitsolutions

Bonds to Start the YearAs I mentioned in my 2022 EOY letter... with actual meaningful interest rates now a thing bonds can return yield. While bonds issued in the last decade (or two) are getting hammered in value as higher rate bonds are being issued presently. I think the market is pricing all of this in and if we do get a tapering of rate increases we will see bond values increase.
TLT NASDAQ:TLT has a good setup for a TS recapture on the Weekly timeframe from last week. The trade going into 2023 is for the October 2021 low on TLT to hold and move up over the year to recapture 135.

long term bond yields still bear, but go toward bottomim in favor of smashind long term bond yield curve, and inverting the front years more for obvious reasons, namely boj inflation/interest rate planning for example. the bottom is obviously not here for TLT, but i would look towards these boxes in this order.

TLT short term Elliott wave analysisWaves do tell how TLT will move in short term.
(Not investment or trade advice!)

TLT New trade > Naked Put
New Trade $TSLA
Naked Put
Strike $99
Premium $0.41 x 3 contract = $123.00
Adding to the previous contracts Strikes 96 and 98 for a total credit of $563.00

TLT nearing exhaustion. Shorting here with target of 100 Custom indicator on 4HR flashing a short signal.
Trend is nearing exhaustion.
Target 101-99
Stoploss: 109.67

TLTHit the 0.618 retracement almost to the penny. Looking for a pullback here to the 9 ema at least.

TLT Trades Through 108 Target, What Next ?In this update we review the recent price action in TLT and identify the next high probability trading pattern and price objectives to target

TLT rally faces some tough testsText book V shaped reversal pattern on TLT now faces a duel with a previous support/resistance line with volume and the 200 day EMA shown in green. If the price can get above these levels then it could mark a convincing point in the bond market with a return to a rising value.

TLT 107 Target Achieved, New Pattern EmergingIn this update we review the recent price action in TLT and identify the next high probability trading opportunity and price objectives to target

Bond Bear is Over - Long TLTNASDAQ:TLT [/symbol
TLT has bottomed.
Big Money accumulated over the past 3 months.
The bear trendline that has held price for the past year has just been breached on massive volume.
Ichimoku Cloud = Buy
For the purposes of this idea, I've selected the 50 or 61.8 Fibonacci retracement level as targets.
However, I believe price will continue to rise in the long term.
Buy Buy Buy.
Target 1 = 50% Fibonacci = $123.50
Target 2 = 61.8% Fibonacci = $131
Fat_Fat

Mortgage Interest Rates Current TrendPlease review the video for a quick brief of current interest rates and the trend that we are seeing.

Possible V bottom on TLTLong term treasury bond ETF TLT looks like it may have put in a V bottom pattern in the last few weeks. This is also reflecting the current yield curve inversions between short and long term yields. I am keeping an eye out to see what the next pull back looks like.
One more low for $TLT before we see a rally -$88 targetUnless price can break resistance here, we're just seeing another lower high. This sets up $TLT for one more move lower.
I think price is likely to retrace from here and take out the recent lows-- then we should see price bottom in the $88 range.
Let's see how it plays out from here.

TLT 102.85 Target Achieved, New Pattern EmergingIn this update we review the recent price action in TLT and identify the next high probability trading pattern and price objectives to target
