TLT bearish until the 5.816 fib circleFrom the last major correction , drawing extending trendlines. Measuring from the high of that correction to the low of the apex intersecting trendlines, we get 2 points to draw a fib circle that caught the Feb 2022, Jun 22 bounces.
TLT trade ideas

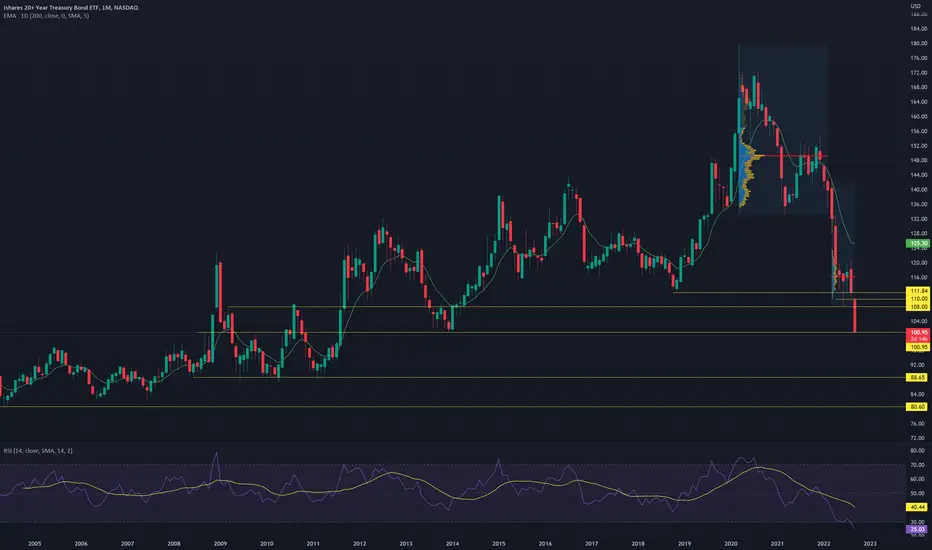
If you did not notice, 20+ year bonds (TLT) are down 50%You think the stock market correction is painful. The bond market is seeing its worse decline since the 1940's. It is down 50% since March 2020. My suggestion is that retirees don't look at their 401k. I sure hope it finds a bottom soon.

Bonds are cheapHello friends.
This chart of the TLT bond ETF adjusted for both dividends and money supply changes has fallen out of it's accepted range and to a new all-time low. We think that this presents an excellent buying opportunity since the market has already hiked interest rates to right around what the federal reserve's terminal rate will be, and since you can collect passive income from the dividends while the Fed continues to hold rates at high levels. After the rates start to ease off in a year or two, the bonds will also rise in value to reflect this, which could present a chance to sell them for a far higher price.


Treasuries accelerating their decline from oversold conditionsTreasuries accelerating their decline today free falling from already historic oversold conditions on multiple time-frames.
Feels pretty broken to me, but that doesn't mean we can't break further.
On watch for a true dislocation/break down/panic on further weakness.

impulsive A looks near completionLooks like a good bet for a short term bounce here in the next several months. Hitting a consolidation zone where demand should be strong and long positions will be defended. Weekly RSI is crazy oversold.

TLT @ MMA200 support; Bond market didn’t trust today’s bounce!TLT still going down despite today’s big bounce in equities. TLT stopped exactly on the monthly mma200 red line after breaking below 100 today Monday.
TLT should hold mma200 this week or else bonds & equities have a lot more to fall.
Not trading advice.

Great Trades are Rarely Crowded: Long TLT and Short Twitter IQEveryone is a good trader in a bull market, but in a bear market, these good traders are reduced to hopium-fueled twitter analysts watching core CPI and interest rates. The former and latter data points serve nothing more as useless, out-of-context generalities for the single-celled Wall Street Bet retail enjoyer. But recent activity across the pond has sparked interest in the bond. These traders are now converting en-masse to self-proclaimed bond market experts with the thesis:
"The bond market is broken"
Except, the bond market is not broken. It is operating as intended, although two lines on a chart may disagree with anyone unfortunate enough to buy at the start of the year. Why is retail sentiment like this?
The simple answer is that the fed is late, but a more-elaborate explanation follows:
Bond yields rise because bond prices fall. It is the acquisition of a bond at a specific market price that determines that bond's yield, as a function of the difference between that bonds underlying rate (which is fixed) and the resale price. When interest rates rise, bond prices fall because newer bonds spawn with the higher base rate. This makes prior bonds, which have a lower fixed rate, less valuable because they output less extra cheddar. People then resell these bonds for a lower price and the yield rises according to market forces (the fed does not directly control this). Shorter duration treasuries follow interests rates very closely, whereas longer dated treasuries are difficult to influence by rate hikes. Either way these are secondary or tertiary market effects. This phenomenon is what results in an inverted yield curve: you can be paid more money to lend money for a shorter duration than a longer one.
But why would something so illogical even happen? The answer is because the treasury market is not just any pig, it's a truffle-sniffing pig. For every brain cell in the equity or corporate credit market, the treasury market has a thousand-fold more. With these one-thousand brain cells, this pig (specifically the longer-dated pig) is rewarded by looking further ahead into the future. What does this pig see when they look that far ahead? An recession that will obliterate the equity market like Exodia. The long dated treasuries have started to price in a recession (very slowly) by pricing in rate cuts. This is why stocks and bonds are still correlated, but the correlation has started showing signs of weakness. The longer tail of the curve is smarter and refuses to sell these bonds like a fire sale.
Recessions imply a fed pause and eventual rate cut, so no more high-interest treasuries. This makes bonds desirable, and this process is only starting now.
I can already feel the credit market enjoyers seething and muttering: SLR relief expired! Reverse Repo! Basil Tea! No, none of these buzzwords matter. It's true that the pandemic has modified the initial conditions of the bond market. The TLT suffered immensely as the federal reserve promised to not raise rates through forward guidance, broke those promises (as is should have), and also allowed SLR Relief exemptions to expire. This made bonds less sexy and glamorous for banks like JP Morgan because the expiry affected treasury exemptions: banks didn't need to hold additional collateral to slurp bond yields, and now they again do. It's much easier now to park money with the fed overnight and get a little more back. The RRP is a much better facility than treasuries as a result, so bond indexes have dropped even harder. SLR relief is a cherry on top, but this truffle has always tasted good without it. It's absence, and whether it is reinstated or not, should not be a determining factor in the recovery of bond prices, because:
No market has currently priced in a recession, and interest rate expectations demonstrate that without a chart, but when that happens, the bond market will get top billing. Bonds will decouple from stocks and TLT will rise from the ashes like a phoenix in the next quarters, incinerating twitter and reddit soys drawing lines on a chart and shorting the index. Nobody saw it coming, they will say, but good trades are never crowded. Smart money extracts the deep value from TLT in the pre-recessionary market by going long (DCA or otherwise). Degenerate smart money is gambling with TLT long calls. Whereas most of the market is still buying stocks, crypto, and chanting that the markets are broken and the fed will come roaring in. These pigs won't find any truffles in this market.
Interest rate expectations are unrealistic and the fed will have to pause sometime early 2023. The recession will destroy demand, taking growth, inflation, and equity market with it, rising bond prices and dropping bond yields. The stock market will crash (I don't consider this current price action a crash yet) and continue burning even as the fed pauses, and dip buyers will be buying a dip that keeps on dipping while you're selling your new truffles on ebay because you lost your job due to mass layoffs across the entire economy.

TLT about top reverseInflation is close to topping imo...we should see TLT reverse in the next 2 weeks...the bottom could actually already be in...but expect a beach ball move on TLT soon. You can therefore anticipate what is about to happen to commodities, and other asset classes...stocks too the moon...new all time highs.

#TLT approaching long-term channel supportStarting to get interested in US bonds here... If you look at this chart since 2023 using fibonacci channels and uptrend support.. we could well start to see a bid in Bonds here. Also note that the weekly RSI is starting to show signs of divergence here which could be warning of a rally to come.. We could still flush down to 103 but i think i would start building a long term position here with a view to add as we move lower

TLT Bottom Near?TLT made a big head and shoulders top. Based on this formation, one could expect TLT to bottom at 97

SLR Policy Decisions the root of InflationThis idea is a primer for ideas on how the FEDs decision to suspend the Supplemental Leverage Ratio for COVID and Implement the Overnight Reverse Repo while printing QE has led to the complete collapse of the bond market and began the era of sticky inflation.
If you overlay the 10Y Breakeven Inflation rate with Year over Year then circle the dates when Jerome Powell Eased SLR for covid and when it expired and implemented changes to overnight repo.
You get a clear sense of how the policy decisions around SLR/Overnight Repo while continuing to print dollars is a clear driver for a decline in bonds and equities while also driving up inflation, DXY and Commodities.
TLT has completed a massive multi-year head and shoulders and over a half dozen daily bear flags.
TLT recently broke through 2014 lows and already flagging lower to 2008 levels.
More to come. It's a fascinating time to analyze markets.
Wish you saw this coming? Hit the like and follow.
Below are charts and ideas I created with warning signs over the past 2 years (I didn't know what some of them meant at the time) but I do now.

TLT Trading A Profit Taking PauseIn this update we review the recent price action in TLT and identify the next high probability trading opportunity and price objectives to target

TLT starting to look very interestingIs this the big debt bubble popping? Or a great buying opportunity of secure debt instruments?

$TLT needs some supportWhat a crash. Coming up on major support here around $97. The break below $100 is hella bearish on real terms and psychologically, but the day is not over, and we could easily still rebound by the end of today although I am not expecting that. We are so deeply below the moving average I am looking for a sign of a reversal. Need to see heavy volume.

TLT retraced more than 0.786It looks increasingly likely that TLT will now retrace 100% as it has now gone below the 0.786 retracement level. The way I think the market interprets todays unemployment report is that it gives the Fed more opportunity to raise interest rates further.

Bullish until end of Jan 2023?Its way oversold with heavy volume. All signals points to bullish short term for three months. $120 soon...

TLT long term chart as the bond bull endsWe are at support of the green box and should move to the red box ( this will be a counter trend move , so bullish till the red box and then will make new low). The move to new lows as we make all time new lows ( long term bearish)

TLT, UST10Y and SPY - a heads up relationshipI read somewhere recently about two co-relationships between bond prices/yields and the SPY.
First was about TLT - where TLT goes, the market (SPY) follows it was said.
Second, was about the UST10Y (US Treasury 10 Year Yields) having to abate its bull run before the SPY cools its bearish rout.
So, I took the opportunity to put these thoughts together visually and overlaid their charts.
Interesting observations between these three it seems...
There are three highlighted periods in 2022, all of which provide a very similar pattern.
Notably, the UST10Y has a tight inverse relationship with the TLT (UST 20Y Bond ETF), which is expected. And if we follow the markings in order...
The time line starts the cycle where TLT brings the SPY higher as the two are in alignment to move higher, where the UST10Y drops. Then there is a period where the UST10Y rises, and the TLT falls, but the SPY continues to countertrend (from TLT) and head upwards. This is not sustainable and TLT gave heads up of that (red shaded red box). Int he rest of the red box period, this is where the SPY stop diverging with TLT and follows TLT int he downward move. The shaded red box is the period where TLT is like a leading indicator of the SPY. To restart this whole cycle, it also seems that TLT needs to have a MACD crossover, and a MFI Histo crossover; the time lines mark the MFI Histo crossover after the MACD cross over.
Given these patterns, the current situations appears to favor a continued downside drift, at least until a MACD crossover, post MACD bullish divergence, and then a MFI Histo crossover. This would appear to take several weeks more.
Heads up!

TLT ShortTLT broke below support and is targeting $100-$101
Current play holding $106 puts for November

TLT: Order Flow, Auction Process & Failures To RotateHey traders,
If we zoom out to check the price action in TLT from a daily perspective, what do you notice?
Every single time there is a failure to rotate (hinted via diamond labels), the new expansionary wave leads the market towards a new equilibrium point that so far has been found at much lower prices.
I’ve circled each and every instance where these failures to rotate back up occurred. Each market is an auction process, and via the OFA script , we are able to get a pristine read of the constant ebbs and flows.
The structure depicted via the script should also be a clear red flag that in this type of well-anchored bear market, being a hero typically gets you in trouble, so stay with the trend.
Remember the two key main features of the OFA indicator:
Magnitude: A major clue that will help determine the health of a trend is the type of progress by the dominant side in control of the trend. We need to ask the following question: Are the new legs in the active buy-sell side campaign as identified by the script increasing or decreasing in magnitude?
Velocity: When it comes to the distance the price moves, the magnitude is only ½ the equation. The other ½ has to do with the velocity of the move or the speed. Was the new leg created after a fast and impulsive move? Or did price make a new low or high with the movement being sluggish, compressive and taking too long to form? A good rule of thumb is to count the number of candles it took to achieve a new leg.
DISCLAIMER: This post contains commentary published solely for educational and informational purposes. This post's content (and any content available through links in this post) and its views do not constitute financial advice or an investment or trading recommendation, and they do not account for readers' personal financial circumstances, or their investing or trading objectives, time frame, and risk tolerance. Readers should perform their own due diligence, and consult a qualified financial adviser or other investment / financial professional before entering any trade, investment or other transaction.

$TLT - 20Y Bond index - BUY?Clearly, inflation is a problem and I for one thought the rates rising were overblown after the first hike. (I was very wrong here) With that said, we are likely in the topping process for inflation, pending any new black swan events happen. The indicators show 4 things in regards to this bond. 1. No momentum, 2. Bear market trend 3. below the historical anchored V-WAP (so most who own this EFT are underwater) 4. Bottoming on a Fib.
The best way to play this is to buy tail-risk long-dated calls. Keep position small given the macro market, but clearly, this is an opportunity that hasn't been available for a while in the bond market.

TLT at support but for how long?TLT the ETF of 20+ year treasuries has dropped to a support level last seen on a significant trend change in 2013. 20 year yields are at 4.17% at the moment. This means that if yields were to rise to say for example 6%, TLT would fall to approximately 70$ a drop of 30%.