TLTThe market is trying to have its cake and eat it too....
The market priced in a rate cut for next year which is why long term bonds rallied recently. Meanwhile they pumped stocks because earnings were good. Can't have it both ways, either we're headed for a recession and stocks should go down or we're not and TLT needs to head down.
TLT and the market heading up at the same time really doesn't make sense based on what the Fed is doing. Probably just money flowing out of commodity trading which now appears to be a dead play. I said this a couple of months ago, if they keep pumping oil prices then the Fed will keep raising rates so it's done.
Anyways, chart pattern is similar to the December top, made some money overnight with TLT puts, I figured employment numbers would be good.
TLT trade ideas

TLT chartHere's how I interpret the TLT chart: A shallow upward sloping channel overall long bull trend which was severely disrupted by the Covid crisis where we saw bonds spike to extreme low levels as yields plummeted which was then followed by an extreme reaction the other way to the downside as investors bet against US debt. It looks to me like the current rally may be this TLT ETF getting back to its more 'normal' channel from its extreme low. It is not there yet.

New bullish trend is growing on US DEBTAfter the rate shock comes the big DOWN on rates so bond will grow again, HUGE movement inc

TLT to the moonWe really need this to break the 35 level to confirm a change in the trend. If it does not hen somewhere in the 70's would be a high point at which it would be prudent to consider removing some chips from the table. The plan is to wait for confirmation and a retest then it's off to the races, or maybe the moon.

$TLT - Inverse H&S$TLT bottoming???
First target $130, then reassess.... would consider it a failed pattern with closures below $1113.

Update on long duration bondsHello everybody! I wanted to make a quick update on where I think the 10y and 30y bonds will be headed in the next few months, as in the past, I've been talking quite a bit about deflation and a recession being close. We have seen TLT rise significantly, yet I think there is more upside. In the short term, I can see a further pullback, but in my honest opinion, the drop over the last two days was caused mainly by Pelosi visiting Taiwan and bonds getting overbought on lower timeframes.
The 30y yields were rejected at the monthly pivot, while the 10y yields bounced at support and were denied at resistance. Yields are still in a short-term bearish trend, and there is no confirmation of a reversal yet, although the trend might have changed. It all depends on the situation between China and the US, as the more the tensions between those countries increase, the higher inflation will be, and therefore the higher rates will be. If China starts aggressively selling US bonds, this could create chaos in the funding markets. If the US starts banning Chinese imports or exports, the US bond market could explode, and yields go to the moon. This would force the Fed to step in and do unlimited QE / yield curve control. Essentially we are stuck in a scenario of mutually assured destruction here, and there is no way either one will come out as a winner in the short term.
I believe that we are in a deflationary/disinflationary period, which could be disturbed at any moment if China invades Taiwan. The Russia/Ukraine war pushed inflation higher at a time when inflation was about to start slowing down, and a China/Taiwan war could push inflation higher at a time when inflation was about to slow down. TLT could quickly reach 125-135 in the next few months. However, I don't believe bond yields are going negative soon. It will be challenging for the market to have negative nominal yields when inflation is so high and at a time when the Fed might be forced to intervene and do YCC.


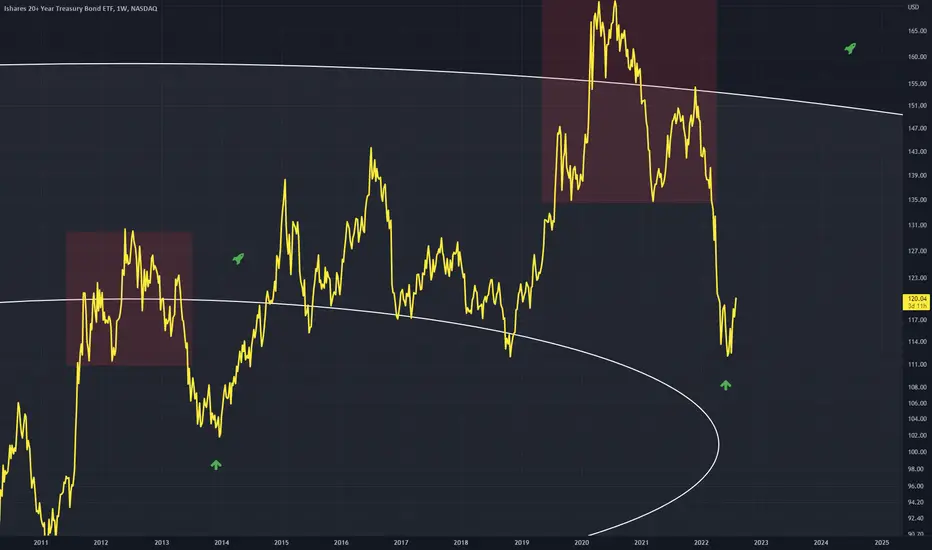
TLT - Similar Tops Leading to Further RiseThe similar tops are in red, formed against different fib circle lines A sharp rise follows once these formations are complete and creates a new ATH
TLT First Profit Target Achieved, What Next?In this update we review the recent price action in the TLT ETF and update the trade strategy and price objectives to target


Monthly TLT Historic Oversold Reading NASDAQ:TLT
TLT, the long bond ETF is approaching a historic oversold monthly reading due to the coming rate hikes.
The Fed would like us to believe that they will raise rates 6 more times this year, which would of course destroy bond prices.
It's not going to happen....
The Fed has raised rates once thus far, by just 25 bps and the market is already down 15-20% from the highs.
The US National Debt has ballooned above $30 Trillion, and every 100 bps adds 300 Billion in ANNUAL debt service expense.
Those who time the interest rate peak, will be handsomely rewarded by going long bonds as the Fed is forced to stick their foot in their mouth and admit that the US economy is hostage to it's debt and dependent on low rates to sustain growth and keep the markets afloat.
The interest rate threshold that causes a major systemic event gets lower and lower as the US is more and more indebted.
twitter.com
I believe that a combination of an intense market sell off and/or peaking rates somewhere around 150 - 175 bps will mark the bottom in bonds.
I own no TLT at the moment; however, I will start scaling into a position over the next few months depending on the market reaction as we progress through the coming gauntlet of FOMC meetings (May/June/July)
A test of the lower bound of the Modified Schiff Pitchfork will be my signal to go long.
I'll update this idea with any TLT moves I make.

TLT Bearish DivergenceLost the mid bolli-band and if not regained will fall to the lower bolli band I'm guessing in 2024. Double bottom buyers here are ignoring the lower RSI and MACD readings indicating lower strenght than at the previous low.

$TLT Trade?$TLT, the ETF for long dated bonds just gapped up to break out of a bullish-reverse-head-n-shoulders pattern (daily chart). Also, the 21EMA is begging to cross the 50sma.

Timing in TLT tomorrowI do dowsing and intuitive work in the markets and I'm starting to get pretty consistent with dates, mainly for reversals. Sometimes they are for news events as well if they impact the market in question. Anyway, I've gotten that TLT will have a significant move (I believe down) starting tomorrow (there's also timing on the S&P btw). S&P and TLT moved inverse today, so it could be TLT goes up, but I have more negative energy, so maybe indexes and bonds will move together in this case.
TLT already has a pretty ugly candle today atm. I'll try to update what the next date will be and see if we can get in flow with the potential dates for reversals or whatever is in store.

Potential TLT Inflection and Notes onProcessWhat started as a short post describing a potential, but dangerous, weekly inflection in the TLT chart has evolved into a much longer discussion around process and how I organize and view the basic information. As I wrote, I realized how difficult it is to describe process, particularly the more nuanced aspects. 40 years spent staring at literally millions of charts and focusing on rates and credit have internalized much of what I do. But I hope this at least provides you with a place to begin. I have ordered the steps, but the order isn't particularly important. And finally, there isn't a right or wrong process. What process is and what it accomplishes is different for everyone. What is important is that you have a process, particularly surrounding your risk and trade management, and that you implement it consistently.
Note also that there are different processes for different trend states. A market with bearish momentum that appears to have plenty of life remaining in its trend requires a different approach than one making a potential inflection. Finally, most markets only provide two to three good tradable inflections a year. TLT is showing many of the characteristics I monitor for in these inflections.
I like simple things. I prefer to find confluences of support and resistance and then to monitor for price volume behaviors around those confluences. This is how I go about it.
Background: Momentum and price trends in daily, weekly and monthly perspectives are clearly lower and the price volume relationships in the trend of higher degree (monthly) strongly suggest that rallies will prove counter trend. The three momentum trends pertinent to the analysis are covered in the “triple screen” section below.
Identify and organize the major chart elements:
Buying Climax and Failed Test: March 2020 produced a clear buying climax. The spike high, subsequent close near the low of the price spread and below the close of the prior weekly bar with volume at nearly 4X the average was unambiguous. Note that over the two week period the market roundtripped nearly 41 points or 23%. At the very least, this kind of volatility can be expected to exhaust the market.
The market then spent 21 weeks moving laterally. Two attempts to rally with no sign of expanding volume strongly suggested a lack of demand. In my view, the break below TR1 strongly suggested that the test of the buying climax had been completed.
Identify Horizontal Support and Resistance:
The market is framed by major support at 111.90 (Nov 2018 low) and major resistance 179.70 (March 2020 Covid high). What were significant supports at 133.19 and 155.12 are now strong resistance.
Price did violate the major support @ 111.90 but not to a meaningful degree and it certainly didn't post a weekly or monthly close below. PENDING A SUCCESSFUL TEST, I am tenatively viewing this as a weekly hold. It also demonstrates the danger of selling breakouts, particularly when the market has been trending for an extended period or the preceding move has been violent. Again, to be trusted, the recent low @ 108.12 needs to be tested. In lieu of a test, unequivocally bullish behaviors would need to develop. To this point, that has not happened.
Identify Dynamic Elements:
There are three dynamic elements in play. Price is pressing against the bottom of the large declining trend channel drawn across the 175.25 -155.12 highs with a parallel drawn from the 133.19 low. The supply or overbought line of the channel currently intersects price in the 148.00 area, but is constantly declining. You can think of the bottom of the channel as the oversold/demand line for price. It intersects in the 116.61 zone.
There is also a broken uptrend (LT1) that had defined the trend for the last decade. The clear break of the TL in April moved the long term trend from up to neutral. The broken uptrend should now act as resistance. It currently intersects price in the 121 1/2 area.
Of lesser interest is the steep downtrend drawn across the 155.12 and 142.33 highs. A break above would add confirmation of a short term trend change.
Characterize Volume:
Are the price/volume relationships bullish or bearish? Volume has been steadily rising/heavy on the B-C leg. This is consistent with a supply driven market. This increase in volume is particularly evident on the monthly chart. See the detailed volume breakdown below for a more in detailed look at the daily perspective chart.
Categorize the Momentum State:
Weekly perspective oscillators like MACD (shown) and moving average and volatility envelopes (not shown) are deeply oversold. I use deeply oversold/overbought conditions to help identify charts and time frames that should be monitored for bullish or bearish price behaviors and chart setups. I also use oscillators as a trend filter. But I rarely use them to generate actual buy or sell signals. Last weeks close nudged the weekly MACD oscillator onto an oversold buy signal. But, to be trusted the crossover MUST be coupled with bullish price behaviors.
Evaluate the most important Fibonacci objectives and retracements:
Fibonacci objectives generated from the 179 .70 - 133.19 - 155.12 sequence: Equality at 108.34, 1.38 @ 90.51 and 1.618 @ 79.49. The market found support at equality.
Fibonacci Resistance generated from the X - C & B - C declines: I prefer to look for clusters. The most likely resistance cluster falls in the 132-135 zone.
When it comes to Fib levels, I like to keep it simple. I hate to see charts with dozens of Fibs scattered about. In my opinion, it devalues the more important levels.
Examine the price/volume relationships in the trend of lower degree:
Volume Detail: The footprint of a subtle shift from supply driven to demand is evident. Two bars in particular, May 5 and June 13 (circled) drew my attention. It would have been easy to dismiss these two as supply, but on my charts I labeled them as demand. Both bars are large gap down days, but note that they closed well off the lows, in the upper portion of the periods range and on much higher than normal volume. Note also that volume pulled back on the decline from the May 27th high (rectangle). This reduction in volume represented a significant lessening in supply. In other words, selling was far less urgent than the selling that had characterized the earlier portions of the decline. Over the last few sessions signs of supply have developed but volume on the pullback has been modest compared to price spread.
Examine the perspectives of higher and lower degree:
Triple Screen: The chart of higher degree will help determine how aggressive trade positioning and risk management should be. The chart of lower degree is used for trade placement, tactical entries and stops.
Monthly: Trend of higher degree is clearly bearish and not oversold. Rallies in the weekly perspective will likely be corrective/countertrend as opposed to the start of a new long term trend. A large head and shoulder top is visible in this perspective that projects as low as 88.00. Volume (not shown) has been extremely heavy, confirming the trend, but perhaps being a bit on the exhaustive side. Against this backdrop rallies will have a tendency to fail early and surprises will tend to be bearish in nature. This suggests that positioning in shorter perspectives should be conservative and stops should be raised aggressively behind trades. Trade management should be generally conservative.
Daily and other: If the weekly chart supports positioning, move to daily and hourly perspectives to build trading and risk management plans.
Other Considerations:
Are there any seasonal tendencies in play? Bond prices have very strong seasonal tendencies, weak into the May - June time frame, stronger into the middle of September, and weak into the end of the year. TLT has entered a time of the year when bonds often transition from weakness to strength.
Are the related markets supportive? Industrially sensitive markets like copper and crude appear to have made significant inflections as the market’s attention shifts from inflation to recession. The same can be said for TIPS breakeven rates. On balance, the related markets are supportive.
Do the charts of other U.S. maturities and yield curves support the idea? 2s and 5s are testing strong yield resistance levels and momentum is threating to reverse, particularly in fives. Remember that the two year is very sensitive to the Fed, fives are a combination of market forces and Fed and Long rates (TLT is longer duration) are generally more responsive to the economy and inflation.
Is positioning or sentiment offsides? In rates, Commitment of Traders, options open interest, open interest data from futures, TIC data and fund flows are all fair game. When trading was my job, I monitored all of the above. Now, in retirement, not so much. Breadth, % of stocks above or below moving averages and VIX fall into this category.
Evaluate economic relationships that impact bonds: For example, are the slopes of the ISM and surprise indices consistent with the trade? With the ISM slope clearly negative, bonds are more likely to be bid. What are credit spreads doing? The widening in high yield and investment grade credit spreads is also supportive.
Do I have the sense that there are systemic issues building that might impact the trade? Systemic issues are typically bullish for bonds. While I see less potential for dislocation in this cycle, rate increases of this magnitude usually wreck someone.
Finally, I take a sanity check, am I falling prey to behavioral bias? Am I being dispassionate?
Reach a Conclusion and Design a Trade:
While monthly trends are unequivocally bearish, the market is testing a major support confluence generated by the combination of horizontal support, oversold channel and fibonocci levels. Weekly momentum oscillators are oversold and there are tentative signs of demand developing in the price volume relationships. Recent inflections lower in industrial commodities, TIPS breakevens, and energy are supportive and suggest a growing recession narrative. Bonds are entering a seasonally strong period of the year. While trends are clearly negative, the balance of the evidence suggests that conditions are conducive for a weekly perspective inflection/correction to develop. I will begin monitoring market behaviors in the daily and hourly perspective charts for opportunities to enter. It is likely that a rally into the third quarter will set up a very high percentage selling opportunity.
Design the trade:
For liability reasons the CMT Association precludes me from making direct recommendations. So, this is where I leave you hanging. My goal was to show you how I do the analytic steps leading up to designing a trade. But a few general thoughts:
Trade entry should be timed using the charts of lower perspective (daily and hourly). Remember, the recent low has yet to be tested, and the market is far away from a logical stop loss placement.
Since a long trade will be counter trend, strict attention to risk control and entry tactics will be required. Surprises are inevitably in the direction of the trend… plan accordingly.
The Fibonocci retracements and overhead resistance zones outlined above can be used to ascertain if a trade has a reasonable reward for the risk taken. Look for confluences of horizontal, dynamic and Fibonoci resistances to build objectives.
Which brings me to my final points in regard to process. I believe that simplicity leads to robustness. I consistently follow the same basic building blocks/process for all my trades, no matter the context or the market. Most importantly, most of the considerations described above are just details. Support, resistance, trend and the price volume relationships get you almost all the way there. I’m not going to pass a trade with a good risk reward because the seasonal is wrong or the trend higher degree isn’t supportive. Analysis paralysis is real. Decide what the most important elements are in your process of focus most of your attention there.
And finally, most of the topics and techniques covered above are part of the CMT Associations Chartered Market Technician’s curriculum.
Good Trading:
Stewart Taylor, CMT
Chartered Market Technician
Shared content and posted charts are intended to be used for informational and educational purposes only. The CMT Association does not offer, and this information shall not be understood or construed as, financial advice or investment recommendations. The information provided is not a substitute for advice from an investment professional. The CMT Association does not accept liability for any financial loss or damage our audience may incur.

Long $tlt vs short $lqd or $jnk Seems logical to meRates are backing up again on the false presumption that the economy is ok and that FED will keep raising rates to combat inflation. I believe a global recession is all but certain at this point. Plus, if China opens back up and inflation is pushed higher it is more likely priced in on treasuries and the impact not fully priced in for corporate bonds or junk. We will see I also think that we are at the early stages of a deflationary break in commodities that will be muted by China reopening. this is supportive of long dates bonds vs short

TLT Bear flagMight want to target 108 here. My LIS for more bullish continuation would be a close over 118

How long could deflation last? What about bonds?As most commodities are currently collapsing, it is very hard to keep believe that inflation is going to go higher from here. June could be the first month with a negative MoM CPI print, but it probably won't be the last. As deflation is taking inflation's seat, bonds have been looking attractive for some time. Essentially we got a blow of top in yields (capitulation bottom in bonds), and now bonds are rallying. It's totally normal as bonds took out the lows, and are now showing major strength at a time where the dollar is strong, while commodities, stocks and real estate looking weak.
The truth is that there is no escape from a major global recession. Commodities could fall a lot more until Central banks reverse course. There is too much debt and the only way to get out is by printing, while all the rate hikes will only eventually result in a crash. It's just that rate hikes have a delayed effect and most investors haven't realized what is coming yet.
Is the inflation story over? I don't think so. We are just in a very a nasty recession, that could lead to a deflationary collapse. Essentially a liquidity crunch that would cause investors to capitulate, and then force the Fed to step in to save the system. There is no way the Fed will hike rates more than 0.5-1% from here, and there is no way the Fed won't be forced to cut rates and resume QE by June 2023. The bond market reversing like this is an indication that the Fed is about to make a mistake by raising rates once or twice in the next few months, as bond yields are already coming down.
It's interesting that bond yields rose more than in 2018 before they reversed and fell below the Fed Funds Rate (FFR), yet FFR is currently 0.75% lower than when the Fed paused in 2018. Could easily see FFR getting down to 0 in the next 12-24 months as the financial system faces collapse yet again, but I don't see bond yields going as low as they did during Covid.
What I see is long duration bonds going up to the key breakdown zone, around 130-135 on TLT or bond yields going up to 2.4-2.6% before moving higher again. Essentially I do see a major deflationary episode ahead, I do believe bonds can go up, I don't believe the Fed will ahead of the problem and that there isn't much they can do. However at the same time I don't believe that the inflation story is over, as I do see higher inflation coming once we are done with this episode. Why? Because a lot of production of stuff will go offline, while governments print a ton of money to save the system. Less goods, more money... No way inflation won't happen again. The debt bubble is popping and long term this is inflationary.
So far we've seen bonds divergence from their long term trends, first with a blow off top, and then with a rapid decline that swept the lows. Could we get back into the main trend? It's possible, but I don't think so. All I see is a similar retest to what we go in 2021, where bonds broke down and then retested the breakdown level before going lower. TLT will fill the gap and then decide where it wants to go. Definitely wouldn't be surprised if bonds chopped in a certain area for a while, but ultimately I think we are going lower. Of course we could go lower even during a deflationary period, as everyone is liquidating whatever they can. If people need dollars, they will sell anything for them, including dollars. At the moment bonds are still very attractive, yet this doesn't mean that if people need cash they will hesitate to sell them.

TLT - Lemmon / Royer 714Quaaludes.
Stumble Cookies as we used to refer to them.
Half a dozen in a pitcher of Beer and it was down
to the ground.
Ah, the good old days, when Mommy's suffering from
manic depression we're Sub'd these little ones.
__________________________________________________
Bond Vigilantes might be suffering from Sopor Ingestion.
If so, please - the hookup.
__________________________________________________
The Degen Class of 007s has never quite learned the game.
Rip it up, move down
Rip it up, move it down to the ground
Rip it up, cool down
Rip it up, don't hang me on the borderline
On the edge of oblivion
And all the world is Babylon
And all the love and everyone
A ship of fools sailing on
(Wang Chung )
___________________________________________________
No matter we'll continue to take their Bacon and eat their
Cake. Everything is better bacon-wrapped.
Even Cake.
Sweet and Sour.
____________________________________________________
After dismal 13 / 26 week auctions.... 2's and 5's sheet the bed as well...
7's had a rough day... less than 50% uptake on JunkCo Gov Bongs.
Savage X Fenty, we're surmising.
_____________________________________________________
Our favorite Velociraptor is back... toothless and starving ever so
slowly. Wondering why the Dolt O' Whirl is imploding again.
Looking for a "Massive RT!"
A quick review of Dino's revisionist Track Record who was Wildy
Hog Calling 180 for TLT and buying every Dip...
T-r-X
∙
Sep 9, 2021
Wrong boy is wrong.
T-r-X
∙
Sep 10, 2021
@HK_L61, US treasuries are still cheap.
T-r-X
∙
Sep 14, 2021
@HK_L61, TLT is actually AAA quality government bonds (not junk).
Btw JP Morgan is a large buyer of US treasuries.
"Jamie Dimon says he wouldn't touch Treasurys with a 10-foot pole at these rates." Just do the opposite.
I will enjoy seeing you lose money.
T-r-X
∙
Sep 15, 2021
∙
TradingView for Android
I allocate between SPY, TLT and cash (DXY). I don't use options.
T-r-X
∙
Nov 9, 2021
How's your short going?
T-r-X
∙
Dec 29, 2021
@jscheurichiv, JP Morgan wants them.
T-r-X
∙
May 12
@HK_L61, Still convinced in my 30 year US treasuries position. 30 year yield will drop to around 1%.
T-r-X
∙
Jan 19
∙
TradingView for Android
@HK_L61 Nothing changed. Your calls were all wrong.
________________________________________________________________
Losers lose, Winners Win - T-REX Wrecked.
TY for your $.
xoxo - Hunter Killer

Can 10-Year Notes (TLT) Recover From This Sell-Off?My answer is most likely. Technically we will see 110.96 hold (GREEN) and make a push higher above 111.26 & 111.72.
Fundamentally, it's likely we have peaked in terms of inflation. Many measures suggest that is the case and sentiment is skewed towards being too bearish on Notes/rates. Certainly a contrarian play, but not just for the sake of being contrarian.

TLT - RT into further CollaspeHow the Fed manages another slug of $20B in 10 Year purchases... it won't last.
Every flight to safety has been met with one outcome.
Wreckage.
We began TLT ZN ZB Sells @ 2% Friday.
Scale up, Scale in for round 2 of eating the Dinosaurs.

TLT bottoms in weekly hammer & divergence;but 108 still possibleTLT may have already bottomed out & the US10Y topped out with weekly hammer candles. TLT may find equilibrium at 132, my inflation pivot zone while US10Y may stabilize at 3.6% inflection point retesting its upchannel.
TLT is now completing its M-pattern & has just entered my bullish BUY ZONE at 114 to 120. DCA Dollar cost averaging up from this point presents a very good risk-to-reward ratio.
MORE DOWNSIDE? TLT may still go down to retest 108 where it bottomed multiple times in the past.
Inflation expectations are slowing & the economy is starting to contract with oil & commodities turning down last week with investors pricing in a coming recession.
Not trading advice.

RSI trendline crossover indicates bottom for TLTThe bullish RSI trendline crossover is indicating a bottom for 20+ year U.S. government bonds. I expect the stock market to follow bonds in the rally to higher prices.
