$TLT head & shoulder$TLT just broken down from a weekly head & shoulder pattern. If measured move plays out, could see under 100.
TLT trade ideas


TLTHead & shoulders on bonds. Could be a volatile year. Either it resolves to the downside & is a false breakdown & rips hard to the upside imo. Potential bullish RSI divergence noted. Bullish above $135, bearish below $133.

Rates Gone WildInterest rates are flying off the chart, is there an end in sight? Most likely... Yes!

VIX vs TLT/LQD suggests bear is near. Back away slowly! VIX has been spiking with TLT/LQD, but the last few times just seemed to help turn it around. Looks similar to the new year, in orange. Volatility has been exploding, per usual. Every 2 years since 2008, Vix has made a new support 3pts higher, shown in solid white. I just read an analyst saying 18 is likely the bottom for some time. TLT/LQD has also been on a years long up trend as well, at a similar pace. So I'm inclined to belief this is a good spot to watch for a long scalp VIX entry, and shorts on the indices.

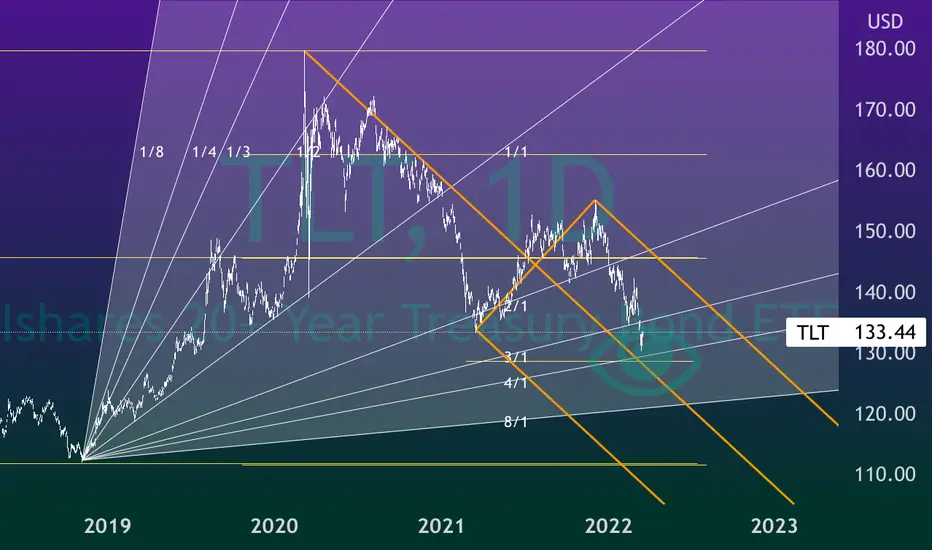
TLT BreakThe iShares 20+ Year Treasury Bond ETF (TLT) tracks an index composed of U.S. Treasury bonds with maturities greater than twenty years. The price of TLT goes down as interest on 20+ year U.S. treasuries goes up. High inflation is driving interest rates ever higher . If inflation does not slow soon, a decades-long trend could end, as this chart is warning.
The monthly exponential moving average (EMA) ribbons have experienced their worse violation in the fund's 20 year history. Typically the monthly EMA ribbons act as very strong long term support. The lower 55 month EMA band can act as a low risk to reward long entry. The price at which the monthly candle closes is determinative.
Fortunately, there is roughly an 80% chance that the 20-year bull trend in the price of TLT will hold in March 2022. (This probability comes from the standard deviation from the monthly mean). So for now, at least, the trend is likely to continue. However, the chart suggests that the decades-long trend is dangerously close to breaking.


buy TLT Calls $130 1/20/2023I buy $785 for one contact is TLT Calls strike $130, expired 1/20/2023, entry $7.85
its nice to invest it and we will have time until Jan 2023!

TLT - Daily / An Abomination of DebtEventually, perhaps... the 007s will come to understand and accept that the Bond Bull has ended.
TLT will be reduced to a Double-Digit Midget - another JunkcCo ETF used to entangle the Kingdom of
the Rain Dilletanttes.
Nixon knew it back in 1973.
Volker knew it in 1979 when Debt to GDP was nearly Nada.
Now it's well over 200% by Non-Fuzzy Math.
Unsure how anyone conceives of buying this using any/all rationale metrics but they do.
Simply an amazing denial of reality.
To each their own.

Treasuries Continue to Toss their Cookies20-year US Treasury bonds already broke an important level of support (red arrow) and yet again, the ETF finds itself at a crucial crossroads as rates continue to rise, punishing the long-end of the yield curve.
"We" have been taught (as a country) to think "bonds are safe," yet we can clearly see that these 20-year bonds, backed by the full faith of the U.S. Government, are getting curb stomped, losing almost -20% over the course of the last 18 months.
But are bonds "safe," really? It's a seriously problem in our industry - at least I think so...
For any investor with a "Balanced" (i.e. - 60/40) or worse yet, "Conservative" (40/60) portfolio model, how do you (as the investor) react to a portfolio that's losing money, not only because stocks are falling in value, but because bonds are getting taken to the cleaners as well?
Not to go out on a limb here, but I'm going to make the assumption that most of those on TradingView are a little more knowledgable than the average investor. Furthermore, I'd go so far as to say that most are probably avoiding the bond market like we avoided COVID-19 in March of 2020.
I won't make blanket advice here and say to that, "Well.... good, then!"
However, I WILL say that at our office, we've been underweighting bonds, overweighting stocks and commodities, and tweaking the target allocations a bit (to all our models) to make up for the possibility that we might be coming out of a 35-year bull market in bonds, as the pendulum swings toward higher long-term rates 3, 5, 10+ years from now.
While we don't own any 20-year Treasuries at our office, if you DO, I'd be looking at the horizontal line in the sand below current price, which could act as a potential level of support... but if broken, all bets are off.


TLT vs DXYTLT will follow the dollar up
But don't listen to me
Do as thou wilt
GRI 2022
NOT TARDING ADVICE

TLT - LongBought a little bit 141, a little more at 137 and am loading to max size in this position now. Everything in increments.
Reason is same as previously stated for this security and position. Inflation peaks and in Q2 we will have a continued slowdown in growth and inflation. CPI is peking.
Then there is the larger time frame chart pattern that we like.


TLT - LongWe bought some earlier near 141 were buying some more here. Chart is setting up for a nice move higher but more importantly the macro tells us growth is slowing, in spite of rate hikes (6+) priced in, the fed will realize raising rates as growth slows would be disastrous and we will probably not get more than 2 and the inflation peak in commodity prices is likely already in. Consequently, we will remain shorting commodities, buying gold on pullbacks, out of equities excapt maybe our existing longs in XLP.

Volatility/Treasury Unwind coming.Lots of buyers came in at the low 130's, people mistook these buyers for long volatility positions, volatility rose, people dumped equities for algo driven VOL strategies. I think we seen a spiral of bets unfold that don't represent the true market. Of course hedgies piled on to TLT, knowing full well that it is a great short term trade (and that adding uvxy calls to their reporting would be in bad taste). But that's just it, short term trade. Long term holders have added at the low 130's, the price they want. These adds aren't for profit, but for hedging government balance sheets and equity portfolios (huge whales). I expect the Fed to unwind more treasuries onto the market and for us to retest the lows around 130 which is where the Fed put on interest rates will feel comfortable for the rest of the year. The US treasury will yet again raise funds for whatever populist mid-term election strategy they have in mind, and for sure they need cash to send to Ukraine for kickbacks. Yes the DXY can handle a haircut, but no the bond market won't rally under these conditions as they are inflationary and bonds are a dead end for inflationary market.
tldr: possible more upside to squeeze enemy hedge funds and safely bet on volatility, but expect the trade to unwind over the next few months.
I'm not looking to make a play on treasuries, but instead long $xlf and low p/e banks like $gs

$TLT BULLWith the current Macro backdrop, entities will go for protection in bonds and dollars.
Russia being cut off is going to possibly cause a liquidity event. I have a feeling that this will cause mid term volatility, but the true sell-off crash won't happen for another 3-6 months... I can always be wrong, and it could start this week. I will be shorting equities this week if I see SPY reject 450s...will post on that soon
I have been quiet for a reason, now I see the way.
CHEERS

TLT gave the DEATH CROSS last weekWe currently Bear flagging post the cross. I know fear holding bonds at the moment but honestly we need to trade the bigger theme. Bonds in bubble of all bubbles. This is going to get brutal. GOLD screaming tell, I am right.

Bullish & bearish analysis for bondsThe common narrative currently is that yields are going to go higher due to inflation which means bonds will sell off. While there may be a possibility of that, my bias is towards bonds looking very bullish next few months.

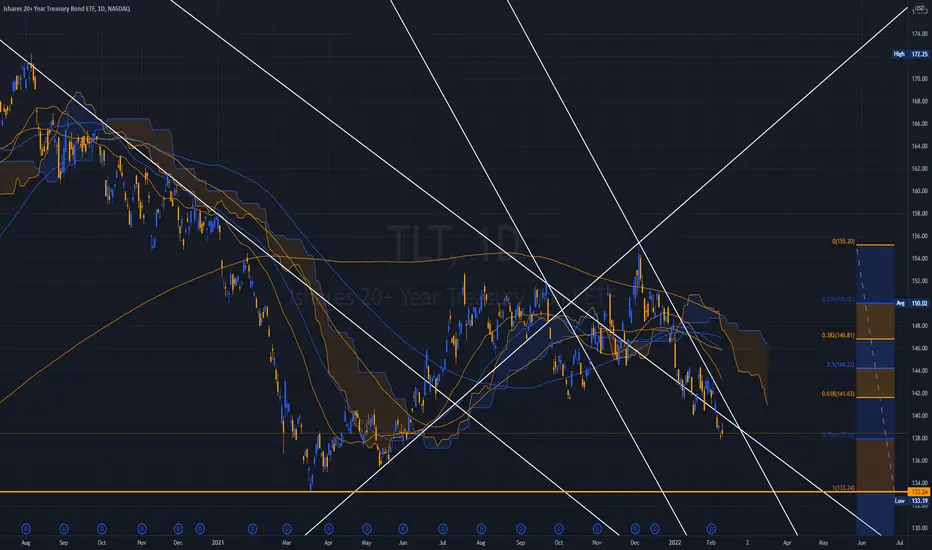
Shark/RectangleTLT is also trading an a Rectangle.
A Bullish shark is also noted within the rectangle. Peak 2 is higher than peak one, so clues me in that this is a cypher or shark. PCZ passed the .786 which is landing pad for the Cypher. The .886 to .113 is the landing pad for the Shark.
These 2 are very similar patterns with different landing pads. There are differences in the 2nd retracement leg as well. The shark has no rules for this leg other than it can not go below O. Also differences for the PCZ (Point of completion zone). The cypher lands at the .786 of XC and the shark lands at the .886 of OX.
The shark is labeled OXABC and the Cypher is labeled XABCD.
Both have peak 2 higher than peak 1. They both look like crooked Ms.
The bottom trendline of the rectangle is support and there are several close bottoms there. There is also a negative crossover of the longer term moving averages marked with an orange X.
The top of the rectangle is 151.30 and the bottom is 132.05. Mid rectangle is 142.95.
No recommendation. A rectangle is a neutral pattern, the shark is not.
Possible stop under rectangle support line where Mr. Market can not find it.
Fund Profile
iShares Trust - iShares 20+ Year Treasury Bond ETF is an exchange traded fund launched by BlackRock, Inc. The fund is managed by BlackRock Fund Advisors. It invests in the fixed income markets of the United States. The fund invests in U.S. dollar denominated fixed rate U.S. treasury securities with remaining maturity of greater than or equal to twenty years. It seeks to track the performance of the ICE U.S. Treasury 20+ Year Bond Index, by using representative sampling technique. iShares Trust - iShares 20+ Year Treasury Bond ETF was formed on July 22, 2002 and is domiciled in the United States.
The investment seeks to track the investment results of the ICE® U.S. Treasury 20+ Year Bond Index (the "underlying index"). The fund generally invests at least 90% of its assets in the bonds of the underlying index and at least 95% of its assets in U.S. government bonds. The underlying index measures the performance of public obligations of the U.S. Treasury that have a remaining maturity greater than or equal to twenty years. Benchmark: ICE U.S. Treasury 20+ Year Bond TR USD

Higher interest rates soon!Drew this scenario 6 months ago and sent it to my community members showcasing a possibility of future rates hikes and that is exactly what ended up happening. Additionally, keep in mind that there is always a negative correlation between bond yields and bond prices and when rates go up, the shares 20+ will continue going down. Bond prices will plummet.
Note that I still think inflation will keep getting higher as I believe that only positive real interest rates matter at this stage and nothing else. Small increases will do nothing to inflation.

TLT - JunkCo ETF / Not a BuyAs the protestations grew and delusions spread, the Wood Panel
Cult learned the hard way, it's never Sunny at the Loch.
Take heart Bond Dgens, as soon as the Equity Complex reaches it
Lows in March so will the Tilt O' Whirl.
Until then, enjoy.
You received exactly what you indicated you would not.
________________________________________________________
2.5% will push this Junk ETF to 134s.