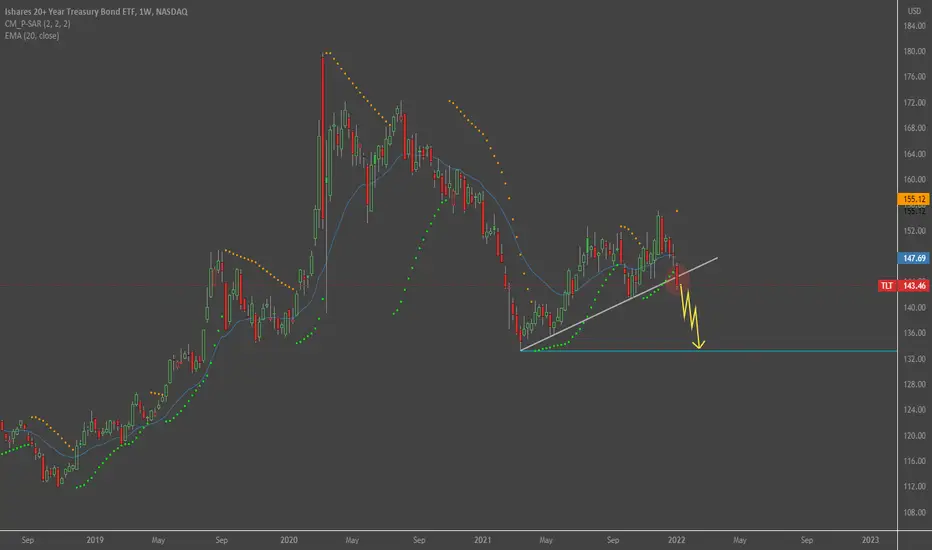
Rates UP, Bonds DOWNThe FED has and will be hawkish until (if ever) they get these markets under control and back to reasonable valuations. TLT has fallen out of its wedge and heading further to the downside. Mid-term target is $122 and possibly further as rates rise.
Not Financial Advice
TLT trade ideas

$TLT selling off to $138-141 before rallying higherTLT looks to be close to finding a bottom. I could see TLT finding a bottom in the $138-141 range then basing for a couple of weeks before rallying higher in early November.
Key dates and levels on the chart.
My macro thesis is that we're at the start of a larger pullback in markets and money will flow to treasuries as a safety net. Dates align on both the S&P bottom and TLT top around March... Let's see how it plays out.

Interest Rates Rising - Short TLTTLT breaking down on weekly trend line as long term treasury rates spike. This could spill trouble to equity markets particularly high valued growth. Keep on eye on TLT or TNX.

TLT and MOVE Index, going in opposite directions soon?What is MOVE Index trying to tell us about TLT in the immediate future?

Pivots or Swing Highs and Lows- IPivots are essential in many forms of TA- including the TA i mainly use which is Action-Reaction aka pitchforks
Pivots may also be termed swing highs or lows
Pivots and swing highs/lows may be harder to define than one first imagines
I would define a pivot or swing as follows:
A focus of Price Action (PA) which becomes a reversal point
This is important because either a V shape or inverse V in PA does not equate with a pivot/swing
An acute angle in price may become a pivot or swing in hindsight IF it breaks the trend which price was previously moving along
G.R.I. Dec '21
KEY
P1 pivot one - price in uptrend along blue diagonal
P2- becomes a swing high WHEN blue diagonal is broken to the downside
P3- becomes a swing low WHEN yellow diagonal is broken to the upside
P4- becomes a swing high WHEN green diagonal is broken to the downside
P5- becomes a swing low WHEN pink diagonal is broken to the upside
P6- becomes a swing high WHEN purple diagonal is broken to the downside
P7- becomes a swing low WHEN green diagonal is broken to the upside

TLT - DailyRemarkable how poorly this has performed.
The 2 / 10 is causing some issues as there is a fear of contagion.
After $12 Trillion in Corporate Junk Issuance to BUY Shares in 2021...
Convention would lead one to assume UST's would be bid in greater size
and yet the Short end is now catching the attention as 2Yr's went off without
a hitch, No Fed, No Need.
The ISsue is the Long end of the Curve is eating itself as it believes Inflation
will be a persistent RISK.
Housing... another issue Globally.
___________________________________________________________________
ZB isn't wrong, nor are the Buyers on Strike with 3 back to back failed auctions.
TLT breaking the 50 with ZN Pointing South require a wait n' see position.
The AO has dipped into Negative territory... while the price struggles to hold.
Neagtive Divergeences abound.

BOndS ONly GO upThe blow off top will be cool
Lol
Simple chart
But if you're betting in inflation now you're betting against this
Welcome to a degrowth world
TRADE AT YOUR OWN RISK
G.R.I. Dec '21

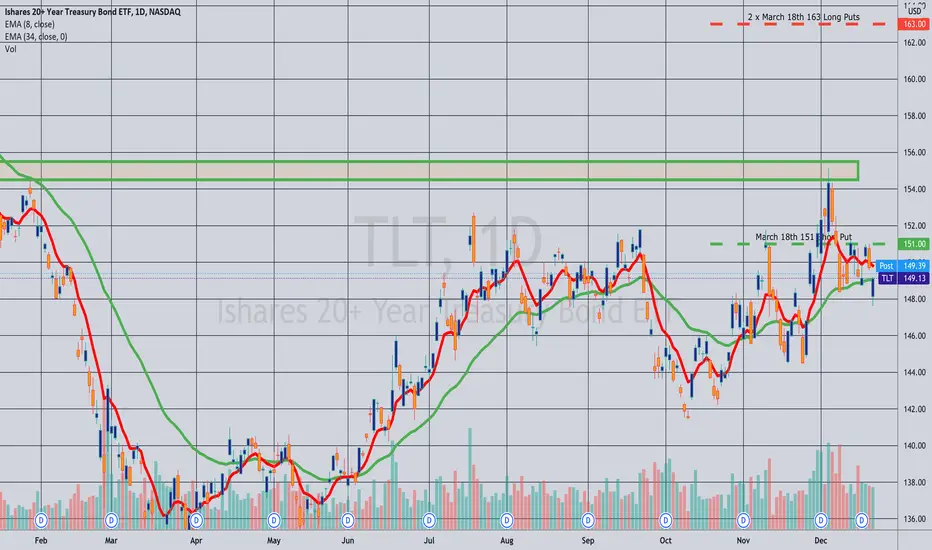
Closed: TLT March 18th 151/2 x 163 Ratio Backspread... for a 26.21 credit.
Comments: Filled this bearish assumption back ratio on TLT strength for 23.99 (See Post Below). Manually closed it today for a 26.21 credit; 2.22 ($222) profit; 9.3% ROC.
TLT Predicted Path (UGC)On the basis of previous ideas
I have switched to linear scale
And assuming the cycle low is in
This might be the path
NOT TRADING ADVICE

TLT Unified Global Charting '21-'25 CyclePlease see my previos UGC ideas
Using geometry, cycles, pivots and time
This is what i expect for TLT
For the next 3 years
NO ADVICE GIVEN TRADE AT YOUR OWN RISK

TLT: Unified Global ChartingIn this idea we analyse the TLT chart
From the perspective of
Time
Cycles
&
Geometry
TLT has been making 3/4 year cycles since the GFC
G.R.I. Dec '21

Unified Global Charting III: TimeFrom the GFC in 08/9 we can observe a circa 4 year cycle for TLT (high to high)
In this idea i plan to turn our attention to time
I have used the fibonacci time (trend based) tool to further subdivide this
Let's see what else time/cycle analysis can tell us about goverment bonds
G.R.I. Dec '21

Unified Global Charting: IIThis is the evolution of a charting concept based on time, pivots and price
We are looking at the 20+ year treasury bond ETF TLT as i think this is a vital chart for the coming decade
Here i have added in a 'mother' pitchfork off the three marked major pivots
I plan to add some analysis below
G.R.I Dec '21

Unified Global Charting I : Geometry And Time I have decided to share the evolution of this charting concept
It centres upon:
pivots
Geometry
TIME
Here we have the macro chart for TLT, a marker of risk on; and the bellwether for the 40 year bond bull market vs the current 'inflation' narrative
Here I have marked the major pivots and trendlines which relate to the cycles

TLT - Ranging for nowLike everything Else the 007s are contending with an aggressive FED
which is hell-bent on Full control.
Long End 30/20 Cross, Short end muted to heavily Intervened, to put it mildly.
Regardless - in Real Terms, Inflation continues to Eat and Feed on everything.
___________________________________________________________________
Even the DX is confused as to where to go and what to do there.
Crypto continues to perform its SOAK FUNCTION.
Sopping up excess liquidity in order to prevent errant behaviors elsewhere,
by example AMC GME NOK and Penny's.
____________________________________________________________________
Keeping everyone and everything in a "Manic State" is working well for them.
Not so much for Us...

The Only Trade You Need to Make This Year. #SteeplongendThe long End Of Yield Curve will steepen.
Inflation running hot and CB can't hike rates.
Nobody will buy 20-30Y.
Yields Run, TLT Plummets
Double Top with Divergence.
Both, fundamentals and Technicals there.
This may be the only trade you need to make this year.
Everyone will continue to believe inflation is under control until they don't.
This is a trade we can actually see happening in front of us but, nobody has this priced in yet.

BULLISH ON TLT and the DOLLARThis will be an idea i have to explain below
So sorry for the busy chart on the left
On the right we have the DXY showing a classic pitchfork reversal- ABC pivots and price reversing before it gets to the median line which bisects BC from A
TRADE AT YOUR OWN RISK

TLT five pivots down completeFurther evidence we are in a new bullish wave up
But time will tell
Trade at you own risk
See my linked ideas
G.R.I. Dec '21

TLT- when to sellSee my previous idea
If this indeed is a bull move then the sell of longs would come when price hits the median line (yellow)
Trade at your own risk

TLT TARGET 157 by EOMOther targets on other ideas
Bullish on bonds
Trade at your own risk
NOTE- this chart uses the action-reaction technique plus some Bressert cycle analysis

Spike Reversal Pattern on Bonds (TLT)Yesterday's close on NASDAQ:TLT broke the day's range causing many to think it was going lower. However, today's open reverses that sentiment by opening back above that short term range.
Bonds are a very cyclically trending instrument (see below) and at some point the down move of the last few days was likely to reverse. This could be the setup with a low risk stop to get long TLT.

20Yr / 30YrAny issues here?
Of course not...
It's' all good.
I swear.
___________________
When the 30Yr Yields remain
below the 20Yr JunkCo ETF Rates.
There is a problem.
___________________
Borrow more with no consequence.
Why is Gold under $200,000 an ounce...
Anyone willing to walk this back
______________________
Remember as Crude Leads, NYSE COMP
and YM beginning crapping themselves
again...
Divorced from Fundamentals
Reality is "Unstable"
