TLT long setup TLT has started to uptrend and in the recent dip holds support on the 76 retracement levels. This is one of the easier buy/hold sort of plays to bet against a bull market.
TLT trade ideas
TLT ShortWedge for potential lower
Fractal given for an idea of what to expect
Fractal from 2H20 when reflation trade started

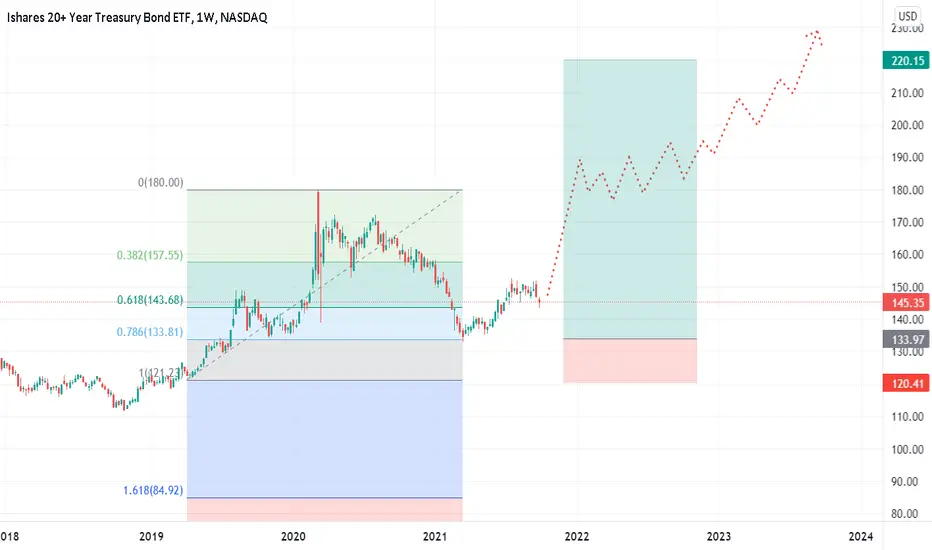
tlt \\ wave 5 swingmorning,
tlt looks to have been in a prolonged triple 3 correction for this complex wave 4
triple 3's can be described as an area of re-accumulation by smart money, before the next mark up phase begins.
after hitting the downside wave 4 algo target perfectly today, i do think the triple 3 has been completed.
possible it hangs out around this range for a few more days to meet the fib-time ratio for this w4.
-------
my upside target sits at $157, but there's a good posibility it goes higher than what i am current projecting here.
stop loss below the 0.382
ps. the debt ceiling vote later today might play a big influence on where tlt goes next - so def make sure to keep a tight stop, just in case that vote ends up flopping.

$tlt DOWN MOVE last week tlt made a swift dropped on Friday. this could be the beginning of the drop coming.
so what does this mean ? when the price of bon goes down, we should expect interest rates to stay low or lower.
So could this mean a lower USD ?
Let's hope so.
TLT - 145.25 and it's a confirmed Sell on >TFs.Book Clearing 9/27/2021
TLT Position Closures Today @ > 131.40 ZN
Closing 100 x 152 Puts
Closing 100 x 151 Puts
Closing 100 x 150 Puts
Open 100 x 151~
Open 100 x 149
Open 60 x 148
Open 60 x 147
Open 60 x 140
We will closely watch 145.24 Level for the Support Level, should it trade below the
trade is cast to 139s with a minor retracement to SELL the ETF.
Put ladders will be close in total and gains captured.
The 007's are yet to see the light and will Buy the Dip, we will oppose their ST Bid in
TLT.
Longer-term, TLT Structure looks Negative.
FED - What not to say this morning beginning @ 10 AM EST> 8:00 AM EST positioning will
provide the Micro Trend into Fed Reserve Bullhorns.
The attempt to calm the losing battle with YCC could see on more attempts at gaining the
upper hand.


TLT - The Trap SprungYou can lead to reason, discussion, and a rationale.
For some, it simply goes against the Cult of Obedience.
We will simply take their $ and no longer engage Cultists.
It is a fascinating study in Delusions of Crowds.
139s will fill.

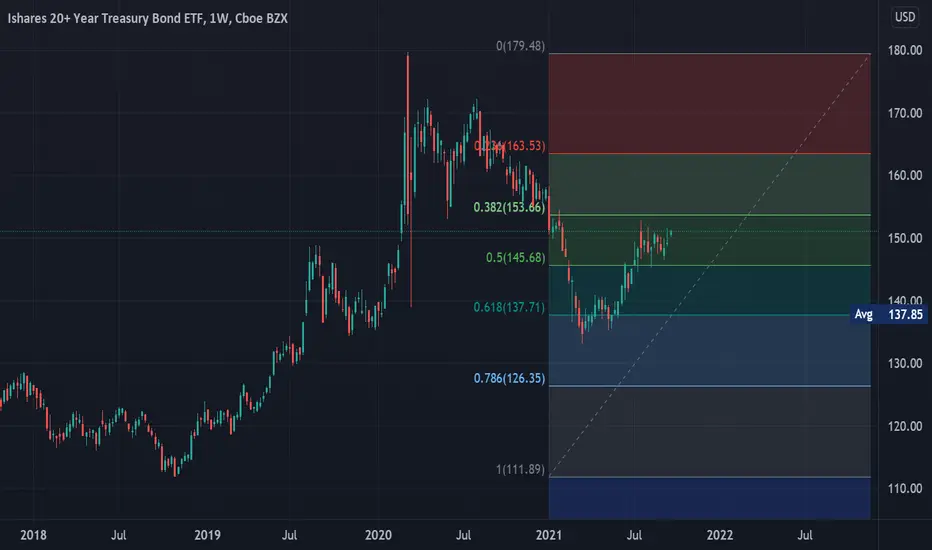
TLT 20YR bond ETF - breaking up from triangle consolidation Pay attention to the bond market folks...
Break out of this triangle can see TLT move up to 157 if the projected target out of the triangle is reached..

A TLT Reality Tilt, Strng the Long BondAdmittedly, the above Chart is Richly Busy.
The Crux
this is the true "Don't Fight The Fed" expression.
Long Strong the Final Bond, with this upside breakout.
NASDAQ:TLT


TLT - Waiting on the RainIn the Kingdom of Wood Paneling TLT remains in a divdergent pattern as the Indicies continue
their Downside Objectives.
Bondies believe this is there Trump Card.
Indy Sell, Bonds ON for Bid.
Although this can true in the very short term, Wednesday will have a decidely different look
and feel to it.
It's good to see the usualy Baggies tossing their "Banter" into the discussion, it amounts to
"hey bro, how much are you down now?"
LOL, we're fine, thank you. Posiotnals are not for the weak, but those who have done the
work and analysis, seeing the larger game afoot.
We'll enjoy comparing notes soon enough.
We're patient, you all... not so much, as evidenced by your incessant and pedantice need to
"tout" your correctness...
And why not, you're in the lead for now :)
Adding 140-170 TLT Puts remains our trade plan as Bonds will join the downside events as
things in the Kingdom of the Rain are not at all well imho.
Stick around Fellas and keep loading up.
We're looking for the 139s to be whacked after Reality sets itself in...
$TLTClose to new highs .taking out C high would make this a 5 up ..thus both entailing subsequent correction and new leg up

Further evidence towards the stock market and crypto market crasTLT has formed a weekly cup and handle. I am very bullish on TLT, hence an upward shift would cause the markets to crash.
Supporting theories to my thesis of stock market crash
- S&P 500 has broken major trendline
- China's debt crisis
- Increased political tensions between US and China
- COVID consequences of restrained productivity and increased debt.
- Inflation concerns.

SPX500 vs TLT : Are you expecting a big than ever drop? When...Just a fast idea about correlation between SPX500 (US500) and TLT.
I'm more bearish than bullish over Sp500, however I just find out TLT correlation with market. Just read more...
I was expected a major drop here in September, but seems not strong enough.
My other target is around March / April. Why? Because of Financial results.
Can we expect super good gains in a market that drained every stock reserve in 2 year where retails "buyed everything they can find, while at home?" I suppose no.
You simply can't sell a 10$ Toys for 100$. If you can't find enough supply, at least you can rise price a little to 15$, maybe 20$. But if before you where able to sell 200.000 pcs x 10$ = 2M$, now you only have 10.000 x 15$ = 150.000$. Freaky!
Can we expect a faster recover in production while there are production "bottle necks" everywhere? I suppose no.
If I need 200.000 toys, I must find them. But if production limit is 1000 toys for week, and there are no stock reserve and high demand, my order must be shared with others. Price will be rise a little. And if my production machine broke, I must wait for a spare part. And if I produce Spare Part I must wait for chip supplier to produce it. To many "bottle necks" everywhere.
Can we expect a fast FED tapering? Maybe not, will only accelerate collapse. So anyone will stay in silence, waiting ... for collapse.
BUT WAIT... WHY TLT? IS IT WORTH?
Maybe not so worth, but higher TLT prices means less buying interest on Governative Bond. Lower prices means more are buying TLT, and this means "standard stock market credibility" just slowing down , melting off. Reads : sell stock & buy bond / commodities.
As always is only a matter of "capital movement" not to HODL till die. Just learn from Pro. Small gains everydays just build more capital than HODL.
YES BUT MY BTC STORE VALUE IS GREAT! TO THE MOOOON!
Ok, free to believe this. Only ask your self if Pro will really trust on BTC as temporary Store Value (like GOLD is only temporary) or if... they are going to screw every small retail.
TO MAKE IT SIMPLE
Whatever will happen, Oil prices, Tapering, Yield Interest, BTC to the moon... from a perspective of "simple buy and sell goods" we are already screwed. We need time to recap production, to fill warehouse, to arrange product stock supply reserve.
Hope is oil price will no go up any further, hope is in some sensate economical intervention, hope is... in cypto decentralization Fomo anarchic mind set.
Ok... We are all screwed. No way, only matter of time.
ONE LAST THING...
Can you figure the "Black Swan" when will enter in the play field? Who or what will be the Jolly Joker for a complete decline?
Share your vision.
-----------------
This is not Financial advice. Only my idea. Feel free to share, comment or add missing information.
And why not? Will you consider to donate something for some other post like this? Just contact me.

TLT - Review for discussion10Yr Yields declined as international Capital Flows began demanding dollars out of the fear as to what is occurring outside the USSA.
Yields will remain under suppression due to YCC Interventions.
It is axiomatic the Trade is contrary to the Vast Herd of Bond Buyers, master of the obvious type
statements withstanding, We are opposing the TLT trade for the Interediate durations.
Demand for perceived "Safety" - the very last thing it actually is imho.
Europe, as we have indicated for months now, remains a basket case.
For as bad as it is here, it's worse there.
However, this is short term in its duration as the USSA is losing favor as a "Partner" of actual substance.
The Long Con remains in trade.
It will get a lot worse outside the USA which remains bullish on capital inflows.
Simply watch France as they are teetering on another Bastille Moment.
That said, the objective of the Level Pullers is not friendly.
Sending hoards of cash into the Fed Reverse Repurchase Market - reduces the cash in the Banks. This ONLY accelerates the liquidity crisis, which, in the very short term can have an important effect on Yields.
It is temporary.
Christine LaGarde, has been inferring that a policy shift is taking place which will be a transition in 2022. Stimulus policies have totally failed and the negative interest rates have destroyed the European Bond Market. Inflows to USTs is axiomatic for the EU, for the UK... not so much as they have shown a clear and present desire to position to China's Bond Market... slowly.
The ECB's ONLY tool remaining is the rather hurried rush to digital currency ASAP for Europe is out of time.
It will not go over well and lead to immense Social unrest.
France, Ireland, Spain, Greece, Italy won't simply roll-over.
80 Central Banks around the Globe desire digital currencies according Lagarde - "We think that it's a duty of us to actually have available digital currencies that would operate to the benefit of consumers."
There is nothing the governments ever do that is for the benefit of consumer citizens unless it benefits the Government 1st.
LaGarde intends to end Private Cryptocurrencies.
In her own words - "funny business" in Crypto needs to end, once and for all.
They will be regulated out of business... plan for it.
When you replace "Currency" which comes into existence from DEBT, Governments no longer need DEBT MARKETS
aka Bonds.
Currency no longer exists, Unlimited Pokemon Cards do however.
The ability of the ECB to continue buying endless debt from its member states is coming to an end.
Pressures to break up the EU is growing and this above all is driving the ECB to take drastic actions.
They will cancel the Euro ahead of schedule, sending the FX Markets into a tailspin.
UST Bond HODLers somehow believe this works well for them... it can in the very short term.
Ultimately, the Tide begins to approach our shores as Confidence itself evaporates.
The game of borrowing forever with no intention of paying anything back is coming to an end
and with it the US Bond Markets.
What will be the Value of your Bonds?
They will become "Perpetual" - you will be allowed, permitted and forced to accept a coupon
with no return of principal, that will be in Lock Down for good.
BY Q3 2022, the axiom will be in full swing.
This is why the Equities Complex will begin a very rapid ascent
as Bonds and Real Estate Fail.
You can't keep a good bunch of Degenerates DOWN when
the TINA's are Nil.
Preteding Bonds are winning against Real Inflation is a large mistake imho, as in no
way are the underlying REAL VALUES keeping pace.
The USSA is heading into Chapter 11 and with it, it's primary feeder lot of Debt.
We continue to position within Options from 140 - 170.
Trading the TLT into Sells has repeatedly worked on 7 seperate occasions, it has more
than offset Put losses.
Today is simply another example of 151s failure to low 150s, yesterday it was the 151.50s
failure to lows. It is clockwork trading, simple, direct and to the point.
Pandering to losses seems to be en vougue for the Bond HODLers, a defense mechanism
for the Herd.
All's fair here, no issues there.
We will simply continue constructing a large SELL Position into the wreckage.
It will become 12.5% of Capital allocation,it is presently 3.9%.
No Margin required as that sits with the Buyers.

TLT - 150 Puts - ZN 133.125 TLT continues to Wedge out into the Break Down.
Althought the Yield Curve appears to be heading into
an inversion into 2022, the Long End of the Curve remains
in peril... Countdown to Depression is ticking into Q2-Q3 2022.
Fed language and statements are beginning to shift into 2022
indicating they are off balance NOW.
Volaility will increase well ahead of the Fed's change in stance.
We anticipate a pullback in the VIX Curve into Settlement providing cover
for today's Squeeze in the Index Instruments.
AAPL and Tesla have been used to provide adjustments to both the ES and NQ,
These will be transitory... as Q3 EPS warnigns need a distraction...
China incidently decided on MOnday - "there is too much completition in EV's
within China"
Adios Tesla, Giga Berlin and Texas will have to manage...
China closing the doors on Tesla.
Confidence will have the intended influence on the Bond Markets, for now
it's game on into completion of the Wedge in 10Yr Yields.
Risk off dead ahead.
There is no recovery in the Economy, rather there are increasingly dangerous
issues which will begin to manifest shortly.
We will be continuuing to Build Out a Large Put Position in TSLA, APPL, ARKK, AMC.
Crypto Scam LiteCoin took the short WalMArt CON to undermine confidence in the space.
A 20% decline in LC took chasers downtown in mere seconds.
Crimnal Fraud in the Space is an operating axiom.

[TLT] October Disaster - Fast rate high ratesExpecting a pivotal day around October 15th, sending TLT lower and rates higher.
Is that Taper coming ? China selling ? Who knows and who cares ?

$TLT: Make bonds great again?I'm concerned of broad risk off possibilities between now and EOY, as potential tax increases might impact the equity markets, going into effect from 2022 onwards...I was already concerned due to long term technical charts suggesting this year we would likely get the end of the bullish trend we had in equities since the 2009 bottom.
This week's turn of events has increased my fear levels substantially. I'm already long bonds and commodities via option positions as a hedge for my equities portfolio, but I think it is time to stay alert and not be inflexible and attempt to bag hodl ANYTHING forever.
There's a long list of bearish factors at play now, and it keeps getting worse the further we go into 2021, but stock market indices have gone vertical since last year so far.
I will try to time the top in individual stocks I hold, and trade with a mid to short term focus, so as not to take on a big drawdown by the time I can confirm a long term top in equities is happening. At some point this year, indices will stop going up, form a daily down trend and drop some 10-30%, then perhaps rebound and form a multi month or multi week consolidation before falling further, that will be the beginning of the end, and I don't want to react too late.
Biden is doing all he can to derail the long term bullish trend in US equities here. It's a sight to behold. Props to him, if that was his goal.
The last time we had yearly trends expiring in equities it was the year 2000, and a decade long sideways/bear market ensued where hodlers didn't have an easy time surviving.
You know what asset class did well during the crashes? Cash and cash alternatives...ergo, bonds.
Just some food for thought.
Cheers,
Ivan Labrie.

TLT - The Madness of Mass Delusions10Yr Yields declined as international Capital Flows began demanding dollars out of the fear as to what is occurring outside the USSA.
This implies, as well, a robust demand for perceived "Safety" - the very last thing it actually is.
Europe, as we have indicated for months now, remains a basket case.
For as bad as it is here, it's worse there.
However, this is short term in its duration as the USSA is losing favor as a "Partner" of actual substance.
The Long Con remains in trade.
It will get a lot worse outside the USA which remains bullish on capital inflows.
Simply watch France as they are teetering on another Bastille Moment.
_____________________________________________________________________________________________________________
That said, the objective of the Level Pullers is not friendly.
Sending hoards of cash into the Fed Reverse Repurchase Market - reduces the cash in the Banks. This ONLY accelerates the liquidity crisis, which, in the very short term can have an important effect on Yields.
It is temporary.
Christine LaGarde, has been inferring that a policy shift is taking place which will be a transition in 2022. Stimulus policies have totally failed and the negative interest rates have destroyed the European Bond Market. Inflows to USTs is axiomatic for the EU, for the UK... not so much as they have shown a clear and present desire to position to China's Bond Market... slowly.
The ECB's ONLY tool remaining is the rather hurried rush to digital currency ASAP for Europe is out of time.
It will not go over well and lead to immense Social unrest.
France, Ireland, Spain, Greece, Italy won't simply roll-over.
80 Central Banks around the Globe desire digital currencies according Lagarde - "We think that it's a duty of us to actually have available digital currencies that would operate to the benefit of consumers."
There is nothing the governments ever do that is for the benefit of consumer citizens unless it benefits the Government 1st.
LaGarde intends to end Private Cryptocurrencies.
In her own words - "funny business" in Crypto needs to end, once and for all.
They will be regulated out of business... plan for it.
When you replace "Currency" which comes into existence from DEBT, Governments no longer need DEBT MARKETS
aka Bonds.
Currency no longer exists, Unlimited Pokemon Cards do however.
The ability of the ECB to continue buying endless debt from its member states is coming to an end.
Pressures to break up the EU is growing and this above all is driving the ECB to take drastic actions.
They will cancel the Euro ahead of schedule, sending the FX Markets into a tailspin.
_____________________________________________________________________________________________________________
UST Bond HODLers somehow believe this works well for them... it can in the very short term.
Ultimately, the Tide begins to approach our shores as Confidence itself evaporates.
The game of borrowing forever with no intention of paying anything back is coming to an end
and with it the US Bond Markets.
What will be the Value of your Bonds?
They will become "Perpetual" - you will be allowed, permitted and forced to accept a coupon
with no return of principal, that will be in Lock Down for good.
Any/All protest from the SVM / Bong Community will have to provide critical rebuttal of the above
for any further consideration.
Unintelligent Echo is considered amorphous, Vapid, Delusional, Degeneracy and participation in its
own demise.
We are no longer entertaining idiocy.
- Hunter Killer

$TLT - Bond volatility low and ripeNow that Fed chiefs are selling their stocks near all time highs they can now start tapering quantitative easing and we could see bond market volatility pick up from current depressed levels.. 20 Year Treasury Bond ETF $TLT has a 52wk IVR of 3.47% and another way to insulate your long term portfolio from more volatility is to buy a straddle on bond volatility.. we’re looking at the NOV’19 ATM $148 straddle for a debit of $6.63.. and close for 50% profit or loss of premium, whichever comes first..

TLT - SVM Fanbois scratching ItchesWe enjoy cock sure Bond Bag Holders, there answer to everything is BUY.
It's wrong as you all will discover.
We call it - "The Everything Must Go Sale"
Don't worry kiddos, it's temporary
Chasing it is a mistake.
xoxo - Hunter Killer

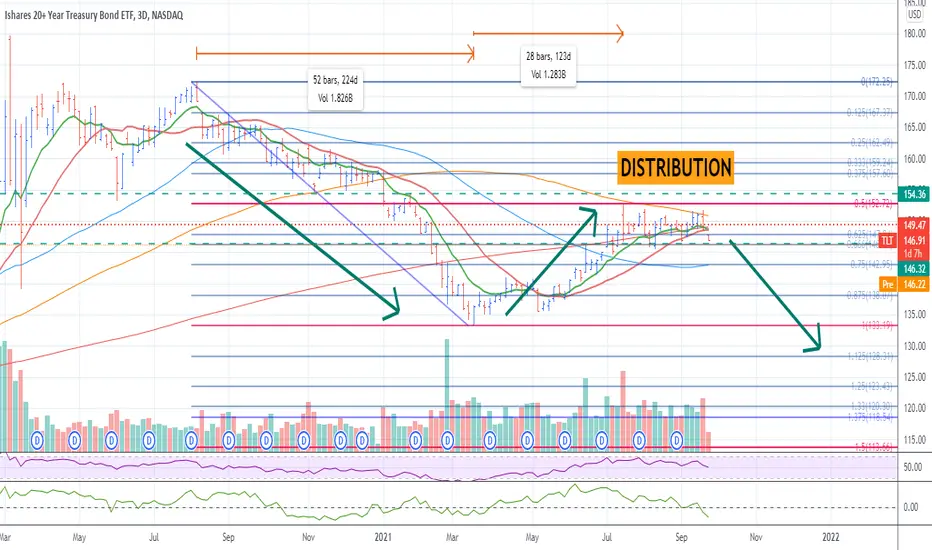
$TLT another wave down ???An updated review on TLT - it has been going sideways for the last 2 months and where is it going ?
My forecast is - downside has a higher probability.
Wave 1 took about 224 days down and the retracement up to 50% took 124 days.
This seems like the perfect setup for a short. Michael Burry also predicted the crash of TLT.
lets see how this pans out.

TLT - Large Dump Ahead for 20YrTLT is rolling over.
Steve Van Metre Fanbois FANBOIS being led to slaughter.
Watch the DX.
FX accident ahead.
