TLT repeating pattern. Another trap coming?TLT 's pattern of higher highs and higher lows seems very obvious. But as a wise man said, "if it's obvious, it's obviously wrong."
So will we see another trap/shake-out occur before it keeps going?
Or will this be where TLT pulls back further while the market resumes bullishness.
What do you think?
TLT trade ideas

TLT accelerating, money runs to safety, waiting for the short.COVID, debt ceiling, drought, $DXY - A few of many things causing this TLT rise. Planning the government response and market effect.


MARKET ALPHA'S GOLDEN CROSS - TLTNASDAQ:TLT
Here is my take on a common trading strategy that uses the 50 and 200 moving averages to indicate a trend change.
In my version, I use two multi time frame EMA's. One runs at an input of 26 and the other runs at 104.
Typically these kind of crosses will involve a retest and sometimes may fail, but if the trend holds true in a reversal we can usually see pretty large gains.
As always, don't get over confident and always know your stop loss and take profit levels.

Reflation Is DeadSomething happened this morning that I think is worth talking about - the official death of the categorical re-flation trade. Thanks Delta Variant and UMCSI!
Over the last eight months, there's been a lot of prognosticating about the state of inflation within the economy, coupled with fears that the Fed had gotten it wrong. Runaway Inflation was considered a key monetary risk, and the CPI printed 5% YoY last month. As a result of all this inflation talk, in combination with COVID-induced supply shortages, commodities have been on a 14 month bull run from the lows last March, with no signs of stopping. Conversely, the ARKK-style bucket has been languishing for months, given the speculative nature of its future cash flows, and thus, reduced NPV (thanks to higher TLT). Today, however, the market is sending a clear sign that these trends are over. Rates are plunging (signaling lower market inflation expectations), and "Real" assets are getting smacked as their perceived value (in less powerful future dollars) comes back into line.
It's one of the main reasons that QQQ is down less than SPY today - Delta Variant fears boost tech / WFH trades. The same stocks which also benefit from lower rates. The UMCSI also leads weaker consumer spending, which adds up to a drop in demand -> less inflationary pressure.
The thing is, if you dig into the numbers, this should not be a shock. Hell, a good chunk of the CPI 5% YoY print had to do with the increasing price of used cars. Aka, who cares?
But let's back up. That explains why oil is down 5% today. Why are my other stocks down?
For some context, since our launch on July 1st, our Equity Macro view (freely available on our site) has been the following:
"Valuations remain rather high on a TTM basis for the overall market, as a combination of COVID related denominator issues and monetary / fiscal policy numerator boosters throw the ratios completely out of whack. While some have written off these values as "distortions", we here at Discordia believe that the market is still a good deal overvalued. Even if you believe the broad analyst community and completely throw out 2020 and 2021 numbers, the NTM S&P guidance puts us trading at 22x earnings, which is still a significant premium to the market's long term average. Some of this premium can be explained by the strong business sentiment and economic climate, and some can be attributed to inflationary expectations, which are also higher than long term averages. We believe, along with the Fed, that the recent bump in inflation will be transitory. We also think that there will be a slowdown in business sentiment sometime in the early fall, as shortages clear up and pricing pressures ease. Lumber and other ag's serve as a a leading indicator of this dynamic, in our view -- lumber having dropped almost 60% in the last 8 weeks."
As you can see, a drop in inflationary expectations immediately takes an axe to the premium that's being afforded this extended market.
Over the long term, as it turns out, deflation is reallllly hard to avoid in a technologically advancing society like ours.
Finally, you mix in the real-world potential that Delta has to send us back 12 months, and you can see why we are where we are today.
Think NLS and PTON being up is a fluke?
Cheers!

MARKET ALPHA WATCHLIST - TLTSymbol: NASDAQ:TLT
Indicators
Laguerre RSI
2 x Multi-Time Frame EMA
Comments: The FED has been pumping a substantial amount of liquidity in the US economy via creation of and then purchasing of bonds. The problem became more complicated as Michael Burry revealed his massive short position against the bond market.
Michael Burry was not the only one shorting the bonds. The decline of the dollar was a clear indication that the Fed efforts would lead to further decline in bond prices.
The bonds look to be unraveling as the word "taper" has been a focal point of the fed and they are actively having meetings about having meetings... so that is definitely promising.

$TLT to around $154 BULLISH!Expecting $TLT to go to around $154 before a small pullback with a start to a solid uptrend.


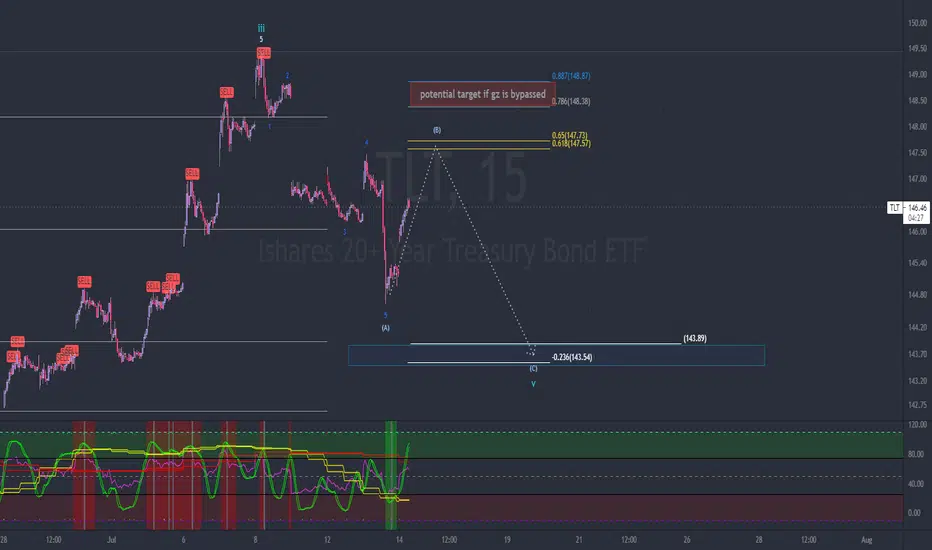
TLT updateshort the golden zone at 147ish
could get all the way up to 149 if they push it through the gz.
target = 143.50
update to previous post:
Bonds Bearish? Stocks Bullish?Let me know your thoughts everyone! Im very curious to see what the general public is thinking.(agreements, disagreements, any thoughts are welcome) Are you guys bullish on stocks or on bonds?
Here are 3 different time frames for the TLT 20 Year Bond ETF(daily, weekly, and monthly). In my analysis you see we have been in an ascending channel(textbook bearish) for almost 15 years arguably more. We broke out during the major market crash in march of 2020 and stayed above it until around January of 2021.We formed a descending triangle(textbook bearish) and broke to the downside back into the ascending channel. This is what you would call a false breakout which is also bearish. Not only did we break below the descending triangle but for now it has been holding resistance the past week.
Why is this important?
Bonds and stocks are for the most part inversely correlated. So if you trade stocks, bonds are an important market to look into.
The top of the ascending channel has massive resistance as you can see it not only touched it 6 times before breaking out, it also needed a black swan event to breakout of the channel.
You might also see a massive head and shoulders(text book bearish) forming on the weekly. If this plays out we can potentially see a $120 TLT which isn't that crazy of a predication when you consider we were just at $110 in November of 2018. (keep in mind that the first shoulder took roughly a year and a half to form so we can say if this plays out were looking about the same time frame for the second shoulder to fully form) That would also be the bottom of the channel, which if that cant hold support then we can be seeing a $100 TLT which was last seen in January of 2014.
This would be great news for stocks, terrible news for the dollar. Inflation is getting worse everyday. And when you take all these things(fundamental and technical) into consideration it doesn't look good for bonds in the medium term. We have just broken to the downside of a descending channel and flipped to resistance, just broke back into an ascending channel after a false breakout, have been in a clear down trend since the peak during the corona virus crash, and we have room to hit at least $120(bottom of the ascending channel) by July of next year if this down trend continues.
A breakout above the ascending channel retest on the previous resistance and continuation upward will obviously invalidate this analysis
Q2 earnings also start tomorrow and there is very high expectations. If expectations are to be met or even beat, then I would say its more likely the markets will pump stocks and dump bonds. And this uptrend in stocks will be looking to continue until we enter a deflationary phase in the markets. That is when I believe bonds will breakout the downtrend and being to recover.
SPY is also showing it has more room to go before coming down and I will post that in my next analysis.

tlt going longmany good things going for TLT
break of resistant
double bottom
above 9 and 50 day moving av.
Target 152.69
the 50% level
if you do it with options its a 100% return

TLTEvery time Bridge Bands prints a "red trend" indicator, prices comes up to the red "trade" dots, and price typically surpasses it.
It's 2021 tho, all bets are off.

Lookout! The Wealthy Are Shorting The Economy20 year yields appear to be breaking out of a long downtrend which has witnessed a boom in the stock market since this asset's crash back in March of last year.
But now the winds seem to be shifting possibly again as now the TLT has started July with fireworks and yields appear to be flipping bullish.
This would be very bad for stocks.. however please keep in mind that this is a lagging indicator. Sometimes it plays out in perfect sync, sometimes it takes months to come into effect. Which means, the remainder of the year should be safe for equities. 2022 however, if 20 year yields confirm bullish, would be fair game to see the real crash in the stock market that many have been waiting for.
A play on bonds could be the potential bet/hedge in the distant future.
If you enjoyed this post please leave a like :)

Infflation HysteriaInflation is the hot topic, deflationists have been told to leave, don't let the door hit you on the way out.
Anytime the weekly RSI on TLT has gotten this oversold we have been at or near a bottom.
Maybe Inflation Nation is getting too crowded and GOLD which follows TLT closely is sniffing this out.
The "Big Short" is buying call options on 3X levered Short Treasury ETFs, what could go wrong?

TLTSymbol: NASDAQ:TLT
Type: Stock Market Analysis
Indicators
Laguerre RSI
Multi-Time Frame EMA
Opinion: With bonds continuing higher; this will put a lot of pressure on the market especially growth stocks.

Are the bond bulls in control or is it time for a break?Bonds have reached a very important level. For now this seems like a *logical* place for the *anti-reflation* / deflation trade to end, and for the risk on trade to be back. I am more on the disinflationary (very low inflation) camp, however bonds have risen substantially and it might be time to take some profits before the resume lower. I don't think we will have extremely high inflation yet and I don't think we will have the good type of inflation because things are going well. I do expect Oil to go higher and that to cause all sorts of issues and higher prices, but other than that I don't think bonds will get crushed. At least no yet.
The key question for the whole reflation trade is... WIll bonds and USD keep going higher, with only US behemoths rallying or and the rest bleeding or struggling, or could we get a larger shock? Because to me if the USD really breaks out and heads for 96 on the DXY, while bonds also rally... we will eventually see something break. I think we'll soon have a better idea of where things could be heading next so it is better to be patient and take a few select trades that go well with this environment and look technically sound.

Rising TLT + Rising Indices. Are these two are now correlated?XTN and DJT are no longer making any all time high yet the market keeps making all time high

tlt wave 5 swing setuphit our upside target perfectly, looking for a pullback to the -0.382 at about 143ish
wave 4 target = 143
wave 5 target = 151

When Bonds and Stocks go up together...... it is a sign of a top approaching??
Disclaimer: This is just an opinion, not a financial advice. Do your own homework.


𝗕𝗼𝗻𝗱𝘀 𝗨𝗽𝗱𝗮𝘁𝗲: $TLT Daily. Bearish Divergence ⚠️𝗕𝗼𝗻𝗱𝘀 𝗨𝗽𝗱𝗮𝘁𝗲: $TLT Daily. Based at 135 support area and now testing 200dma. Above can go higher, but bearish divergence ⚠️ so could top
$TNX $ZB_F $ZN_F $SPY $SPX $ES_F $VIX $QQQ $NDX $NQ_F $GLD $GDX $DXY #Bonds #Stocks #Trading

TLT - Confirmed bottom - More upsideThoughts and ideas are my own view.
Now, I've been in a trade on TLT for a little while now. About 2 weeks. It's quite obvious there's a couple things going on here:
1. A reduction of downward momentum that ended in mid-March.
2. A move up followed by a corrective move to the downside which did not make a new low
3. Our indicators indicated we were about to make a move to the upside
4. There's also a visible inverted head and shoulders that broke out on June 8
Mix all these things and there's a squeeze that is expanding to the upside as well. Although we may see a pullback to retest the breakout area, I'm interested in seeing TLT make a move up to approximately $149 in the coming month.
