TLT is about to resume the down-trendDown-trend on TLT is about to resume with a target around 122, so I am excepting long side of a yield curve to go event further up and eventually exceed 3%. I like Lacy Hunt's arguments for deflation/not inflation in the long term. But as he also mentioned, it is a norm at the moment to expect a short term inflation pressure.
I believe a 5 wave structure is unwinding since 5th of April, 2020 on TLT chart, with 4th wave potentially just completed. Wave 2 had triangle structure, so wave 4 is expected to form a zig-zag , exactly is it actually happened. So it is ready for the next move down towards 122.
Watch TLT/JNK chart which I found very interesting, it gives an idea about a turning point when market is going to turn from risk to save assets. Most likely it will be in sync with completion of DXY correction (started in 2017), so both $ and bond will go up after then.
TLT trade ideas

TLT Bouncing -- Yields ? DXY ? Gold ? Equities? This potential bounce in TLT could be big shift for market. Bonds inverse yields.

Treasury Bond ETF Smashes Into 50-day SMABonds have bounced in the last month, but now the bears may be coming back.
The iShares 20+ Year Treasury Bond ETF jumped to its 50-day simple moving average (SMA) yesterday. It was the first test of the SMA since the beginning of the year.
Second, TLT moves in the opposite direction as the CBOE 30-year Treasury Bond Yield Index (TYX). Yesterday it held an upward-sloping trendline that began on January 4. Also notice how a kicker candlestick pattern may be taking shape, with a quick bounce from the low:
Finally, yesterday’s data could favor more downside in TLT because initial jobless claims, retail sales and Fed surveys suggested the economy is rebounding sharply. The numbers were so strong that the Atlanta Fed’s GDPNow estimate for Q1 growth was revised up from 6.2 percent to 8.3 percent.
TradeStation is a pioneer in the trading industry, providing access to stocks, options, futures and cryptocurrencies. See our Overview for more.

Running into resistance soon.TLT has been walking up this trendline since about mid March but watch out, the pink line is a well established longterm trend that could prove to be major resistance. If that trendline holds we could see a reversal in bonds which would cause a rise in rates.

$TLT Suddenly in Bullish Setup as CPI, Auction Avoid DisasterDon't look now but long bonds are suddenly pressing the top of a bullish ascending triangle after a strong 30-year auction.

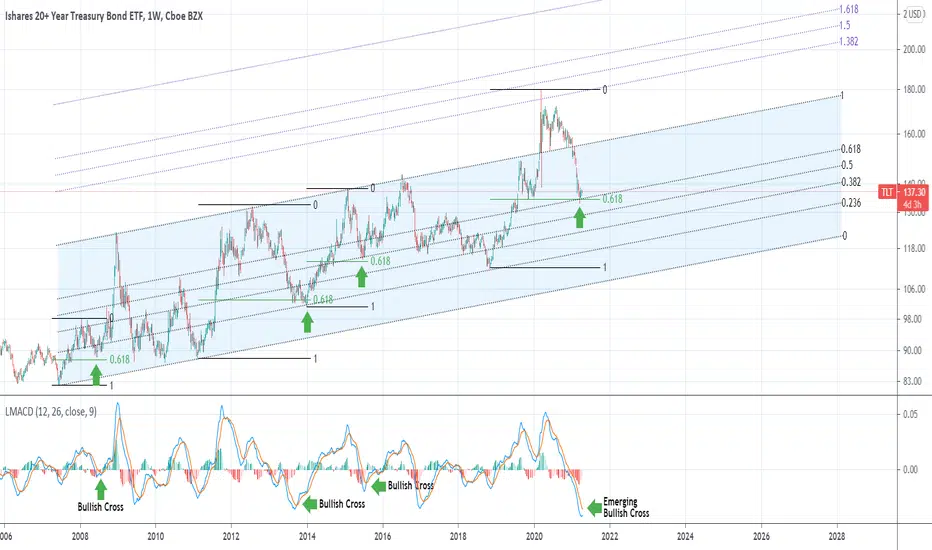
TLT Best buy for at least one yearThis chart shows a very clear and strong trend on TLT on a multi-year basis. Every time the price hits the 0.618 Fibonacci retracement level (1W time-frame), it finds a long-term Support and rises. This is accompanied by a MACD Bullish Cross. See who the Channel's Fibs are also playing their role as Supports. Can this be the new long-term Support in TLT's attempt to break above the 1.5 extension?
** Please support this idea with your likes and comments, it is the best way to keep it relevant and support me. **
--------------------------------------------------------------------------------------------------------
!! Donations via TradingView coins also help me a great deal at posting more free trading content and signals here !!
🎉 👍 Shout-out to TradingShot's 💰 top TradingView Coin donor 💰 this week ==> hujianghua
--------------------------------------------------------------------------------------------------------
𝗖𝗵𝗮𝗿𝘁 𝗼𝗳 𝘁𝗵𝗲 𝗠𝗼𝗻𝘁𝗵: $TLT / $SPY Monthly. Key TestAll the way back down to blue TL. Could we see a reaction and get a #bond bounce?
$TNX $ZN_F $GLD $GC_F $GDX $DXY $SPY $SPX $ES_F $VIX $QQQ $NQ_F $DIA #Trading #Stocks #StockMarket 📈


TLT/JNK Ratio vs SPX. Sell in May and go awayStrong correlation between 20 yr bond and high yield junk bonds.
market tends to enter volatility when this ratio bottoms/breaks out

Castle Van Metre at the battle of RagnarokCastle Van Metre at the battle of Ragnarok.
80 year bond cycle nearing cataclysmic end. God King Steven Van Metre fighting the wolf of Fenrir, The Fedcoin (electronic cash debt free currency) and the forces of Niflheim at the last battle.

$TLT RSI divergenceAn interesting RSI divergence has occurred in $TLT. This could be pointing to further short term gains in $TLT.

TLT long explanation on my last videohere is more explanation of my last video that why we have 3 targets based on elliot waves. there are 3 elliot waves from small to big picture that gives us some classics theoretical targets.
does it mean we will reach all of them?
does we even pass them?
or we reject from here again?
all possible!!! if you are a trader more than even 1yr you know that ALL POSSIBLE! just trade based on your strategy, open point, risk/reward ratio, SL and TP.

Possible long TLT from 135$Possible long TLT and bottom. RSI super oversold on (D) even 17. Everybody is record short $$$ and record short UST and long reflationary trend and inflation. It's not constant, time for some deflationary move and flip. Sustained break and closed on weekly below 134$ gives us a right to claim TLT will drop further to 118-120$ to lower channel.

TLTGold follows, cci gave the signal with double top. Macz ready to turn, # fed members talk this week to put out fires


TLT longI am just consistence with my strategy and share what I see. time to buy short term-term call (1-2month) with delta above 0.85. TLT right now $133.25. Then need confirmation on weekly candle to open longterm call as well. Will come back to this chart in 1month,2month,6months and then Jan 22

TLT more depth on my last graphto see better. impulse pattern to me . fibs and fork are clear as well. classic fib 61.8% ? maybe soon to say but this is a pattern I see have more chance so far.


Don't fight the FED!Follow policy.
If you need to buy - wait for deep pull backs
If you want to short - sell on rallies.
...But don't fight the FED!


Weekly $TLT Most Oversold.... EVER!We are watching a capitulation of long dated bonds in real time. Today's huge gap down of -2% breaking last week's lows is actually perfectly in line with TLT seasonality for the past 16 years. This is no coincidence as the March 2009 - March 2010 sequence in bonds is very similar to the March 2020 - March 2021 sequence. The Q1 FOMC in the 3rd week is usually a catalyst to reverse the sentiment in bonds. This extra gap down near the statistical low for the *Entire Year* is a true gift. When bonds recover, expect a huge buy cycle back into beaten down tech/growth stocks.
A big clue today was Gold. It tracked 30Y bonds (ZB Futures) overnight down, but reversed hard with the Euro off supports. Normally, if TLT was down -2% at the USA open gold would be crushed, but it did the exact opposite. Something is off with long dated bonds and I feel this will be quickly resolved with the FOMC catalyst next week.
Join in this great trade!
TLT Seasonality for the previous 16 years - There are no coincidences!


$TLT Daily$TLT entering nice supply zone here, with solid support at 134. Lot of call sweeps hit the tape today for 140 calls 6/18. This is getting very close to a bottom, which obviously would not be good for equities. Keep an eye on this one. I would sell some puts at these levels or buy 140 calls 6/18 exp.
