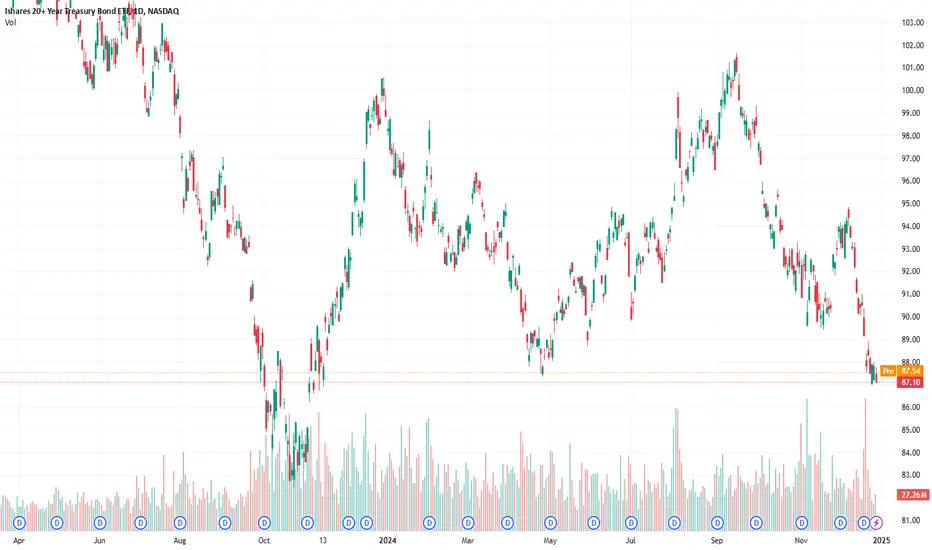
TLT long, long and only long, don't give up and keep it with youAgain me and again my TLT)))
First of all we should keep safety and creditworthiness U.S. Treasuries are backed by the U.S. government, making them one of the safest investments globally. They are considered risk-free in terms of credit risk, as the U.S. government has never defaulted on its debt.
The second one and the most important point - we have ATTRACTIVE Yield Opportunities
10y 4.77%
20y 5.041%
30y 4.959%
Starting from the 1980s, this is the second time the Fed is cutting interest rates while yields are rising. Of course, this carries certain risks, and experienced investors know that the 1980s were not the best times for reliable investments.
The market is anticipating a new wave of inflation, and professional participants do not agree with the Fed's 1% cut. Especially with the 50-basis-point decision in September. Up to this point, many believe that the fight against inflation has failed, and some banks even fear that not only will the rates remain unchanged, but further hikes are possible.
No, no, and once again, no.
With inflation at 3% or a bit higher, rates of 4.5% cannot logically rise further. They might remain unchanged for an extended period or be reduced slightly, taking macroeconomic indicators into account.
Currently, the market is not moving out of fear of a strong labor market or high inflation but exclusively out of fears related to the Trump administration. These include promises of new sanctions, tough measures against migration, and tax relief. I honestly believe that of the aforementioned, only the tax relief will be fully implemented. There will be a few formal sanctions, primarily targeting China, while migration policies will remain election promises and not actionable programs.
In the face of all this, we have very low TLT and very high yields for 20+ or even 10y, which are truly worth our bid.
TLT trade ideas

US Stocks - The Situation Is CriticalFollowing the strong US economic data, the markets are in panic mode: Hopes of further interest rate cuts are fading like ice cream in the summer sun. A look at the TLT chart does not bode well. The monthly chart shows extremely strong hidden bearish divergences in the OBV. I have written an indicator for private use that draws these divergences clearly visible on the chart (blue line: price; green line: OBV).
Let's not kid ourselves: The situation for the US markets is currently quite grim from both a technical and fundamental perspective.

TLT 2024 - DRV Monthly Seasonality StatsThe TLT (iShares 20+ Year Treasury Bond ETF) has exhibited notable volatility and seasonal trends from 2015 to 2024. Historically, TLT shows consistent positive returns in January, with significant gains in 2015 and 2023, but negative returns in 2022. February often sees mixed results, with TLT showing both positive and negative returns across the years, notably performing well in 2020 and 2023. March and April typically show more stable returns, with occasional dips in April, particularly in 2018 and 2021. May and June are generally weaker months for TLT, with losses in several years, notably in 2018 and 2022, though 2020 and 2023 displayed some positive movement. July tends to see moderate gains in most years, with especially strong returns in 2019 and 2021. August has a mix of gains and losses, with TLT showing a sharp decline in 2019 and 2022, but improving slightly in other years. September and October show consistent weakness, with TLT typically underperforming in these months. November and December offer some positive results, with strong performances in 2020, 2021, and 2022, which may reflect seasonal market trends or investor rotation into bonds as a safe haven toward the end of the year.
In the recent Federal Reserve meeting, Chair Jerome Powell emphasized the central bank's commitment to its dual mandate of fostering maximum employment and maintaining price stability. He noted that the Fed's decisions are data-driven and not influenced by political considerations. However, with the incoming administration expressing concerns over high interest rates, there is potential for tension between the Fed's independent monetary policy and the administration's fiscal objectives. The administration has indicated a preference for lower interest rates to stimulate economic growth, which could lead to pressure on the Fed to adopt a more accommodative stance. Such political dynamics could influence the Fed's policy decisions, potentially leading to more aggressive rate cuts or even discussions around negative interest rates. If the Fed were to lower rates significantly or implement negative rates, it could have profound effects on the economy, including encouraging borrowing and spending, potentially leading to higher inflation and impacting the value of the U.S. dollar. For investors in TLT, such policy shifts could affect bond yields and prices, as lower interest rates typically result in higher bond prices. Therefore, monitoring the interplay between the Fed's monetary policy and the administration's fiscal stance will be crucial for understanding future movements in the bond market.

TLT or TMF?Are we heading to a flight to safety while the nation stabilizes under the new administration, all time highs on low breadth, AI fueling junk markets. A DASH to TRASH, often rings the bell for a serious correction, as we have been trained to buy the dip, we may be in a Bull Trap.
Either way, I will have this play on deck.
Share your thoughts on my thoughts... NASDAQ:TLT AMEX:TMF

$TLT long to 110 on February 20, 2025Everything is on the chart.
I am calling for TLT to rally from today's closing price of $86 to $110 by Thursday, February 20, 2025.
The Javier Milei Argentina experiment has been a huge success for Argentina, who is buddy buddy with the J's and Elon Musk, both of whom are buddy buddy with Trump.
At the time of this writing, $105 calls for 2/21/2025 are .05 each. If the target hits, they will be worth $5.0, for a total return of 10,000% (10X).
On the weekly chart, you can see the 200 week SMA coincides with my level on that date as well.
Feel free to share.

TLT HAS BOTTOMED TODAY at 85.34 a perfect .786 of wave A downThe chart posted is the TLT we have now reached a fib relationship at today low of .786 of wave or wave 1 both counts calls for a sharp rally back above 90 plus or mins 1 I have now moved to a 40 % net long in the money calls best of trades wavetimer

TLT BOND ELLIOTT WAVE ANALYSIS: 7 JAN, 2024©Master of Elliott Wave: Hua (Shane) Cuong, CEWA-Master.
The entire ((4))-navy wave most recently finished as an (A)(B)(C)-orange Zigzag, and the ((5))-navy wave is turning back to push lower. It is subdividing into waves 1,2-grey, and they are complete, since the high of 94.85 the 3-grey wave is unfolding to push lower, targeting the low of 83.58.

$TLTa good hedge yieahh
volume gap till $117 area
higher lows seem to be forming
If I was conservative I would wait to break previous high and test that new support, but you know me I am already in for long term.
RSI and MACD going up

Looking to Short TLT Next Week as Market Sentiment Shifts- Key Insights: TLT has been facing increasing pressure due to rising interest
rates and inflation concerns. Trader sentiment appears cautious, reflecting
a potential continuation of downward trends. With the Fed's signal towards
maintaining a hawkish stance, bond prices are likely to remain under
pressure in the near term.
- Price Targets: Next week targets are T1=84.5, T2=83.0. Stop levels are
S1=89.5, S2=90.5. This structure supports a short position considering
current market trends.
- Recent Performance: TLT has been on a decline, reflecting broader market
reactions to interest rate hike expectations. The last trading sessions have
seen fluctuations, but the overall trend points towards bearish sentiment.
- Expert Analysis: Analysts suggest that TLT faces headwinds from economic data
indicating stronger growth, leading to expectations of continued interest
rate increases. The consensus is predominantly negative, with many traders
positioning for further declines.
- News Impact: Recent economic reports highlighting job growth and inflation
have intensified talks of rate hikes, negatively impacting TLT's
performance. Additionally, geopolitical tensions and market volatility
contribute to uncertainty, pushing investors away from long positions in
bonds.
TLT to double bottomTLT might revisit the $80-82 range before creating a double-bottom reversal pattern.
Look at the RSI. I bet that the RSI will go down to the trendline and find support before bouncing.
I would start DCAing out from $120 for 40% gain.
---------------------
TLT (iShares 20+ Year Treasury Bond ETF) is an exchange-traded fund that primarily holds U.S. Treasury bonds with maturities of 20 years or more. As a result, TLT tends to be sensitive to changes in long-term interest rates.
Why buy TLT?
Interest Rate Outlook : Investors often purchase TLT when they expect long-term interest rates to fall. Declining rates increase bond prices, which can boost the value of TLT.
Safe Haven : In times of market volatility or economic uncertainty, TLT can act as a defensive holding, because U.S. Treasuries are generally considered lower risk compared to stocks.
Portfolio Diversification : Adding TLT to a portfolio can help diversify equity exposure and potentially reduce overall volatility.

$TLT - It is getting crazy!NASDAQ:TLT The bond market seems out of its mind. We are basically less than 5% from the peak of the Fed's rate hiking cycle. Pretty sure funds are shorting it.
Currently, it is sitting on critical support. It's possible that this may be the bottom. 👀
As always, I share my opinions and trades. I'm not suggesting that anyone follow my trades. You do you.

Again TLT, again 108 targetI’m still supporting 20+ bonds, and this time I’ve chosen the technical approach.
I’m not entirely sure if I’ve made the correct calculations using the XABCD pattern, but the picture seems accurate.
When the market has concerns about tax reductions, strict measures against migrants, sanctions, etc., and how all of this will affect prices and, specifically, inflation, don’t forget to consider the opposite side of reality.
Before all these factors fully materialize, it will take years. During those years, the Trump administration is preparing to make aggressive cuts in public spending, introduce new optimization plans, and more. This can have a direct negative impact on both inflation and the labor market.

Don't give up and buy TLTWe have a new rate cut, congratulations! The Fed rate is now 4.5%.
What is happening in the market, and why does the effect of the rate seem to "work in reverse"? After all, TLT should have been above 100 long ago, especially after so many rate cuts.
Yes, that's entirely correct, so why are all our accounts in the red?
First and foremost—the most important thing—never sell U.S. Treasury bonds at a loss.
Second, the market is "inclined" or "disposed" to believe that the Fed is either lying or doesn't have a proper grasp of the situation. Due to domestic political changes and the effects of Trump's policies, inflation is expected to remain high for a prolonged period—potentially above 3%.
Even in that scenario, a yield of 4.7% or higher on 20+ year bonds remains attractive. More on that later, but in the real sector, following the elections, the Chinese yuan has already depreciated by over 5% against the U.S. dollar.
RIGHT NOW, the U.S. debt market is the most attractive market with its 3.1% economic growth.

TLT BONDS ELLIOTT WAVE ANALYSIS: 19 DEC, 2024©Master of Elliott Wave: Hua (Shane) Cuong, CEWA-M (Master's Designation).
The entire ((4))-navy wave most recently finished as an (A)(B)(C)-orange Zigzag, and the ((5))-navy wave is turning back to push lower.
It is subdividing into waves 1,2-grey, and they are complete, since the high of 94.85 the 3-grey wave is unfolding to push lower, targeting the low of 83.58.

easy buyNASDAQ:TLT is only 8.55% off major all time support.
For a precious metals miners investor, being down 8-9% before going up is the same as putting socks on..easy.
Risk/reward looks in favor of accumulation here.

Epic Bounce Ahead! Why $IWM, $RTY, and $TLT Are Set to SoarIn this video, I will explain to you why I believe we are about to have an EPIC bounce in the AMEX:IWM CAPITALCOM:RTY NASDAQ:TLT
I've put out write ups on this topic but I wanted to get all my thoughts in one cohesive video analysis to give you the visuals you deserve for my BOUNCE prediction.
🔜🎯$259
⏳Before March2025
Not Financial Advice. Check it out here 👇

TLT suffered 2008-like blood bath - mandatory longThe long-term USA Treasury Bonds suffered an extreme downswing.
NASDAQ:TLT
They are cheap AF.
Buy now, hold for 3-10 years. Sell some or all of them at 60% profit.
Do not hold them till the maturity date. Just play the price.
Never sell at a loss!

TLT holds 90 and its clear for 94-95 again.This is the same old game bond market played prior to the 00 and 08 crashes. Don't believe me, go to the fed website and see for yourself. The long end of the curve faked out investors back then too. "Inflationary fears". 9 months into the recession they called "recession!!".
From a technical standpoint, this is a great area to buy shares and options. I think we'll get a quick reversal here.

$TLT The ReprieveNASDAQ:TLT has currently been granted a stay of execution as the relief rally kicks in.
On the daily we can see clear signs of a bull flag pattern with upper level targets at the gaps of 95, 96, and 98$. Currently having turned green on the Bull/Bear Indicator, this little yield is getting ready to slaughter bears in the short term and return zombified gains.
Get it while its good, the CCI is printing a high probability long. Once price action returns to a discount level, the sell off may yet continue.
H8ters Beware.
I thought I saw your mom in here..

Opening (IRA): TLT December 20th 88 Covered Call... for a 86.84 debit.
Comments: High IVR at 74.8% plus weakness.
Looking to grab both the November 1st and December 1st dividends here while I twiddle my thumbs waiting for the general election to pass, selling the -75 delta call against shares to emulate the delta metrics of a 25 delta short put, but with the built-in defense of the short call.
Metrics:
Buying Power Effect/Break Even: 86.84
Max Profit (Excluding Dividends): 1.16
Max Profit (With Dividends): 1.80
ROC at Max Excluding Dividends: 1.34%
ROC at Max (With Dividends): 2.07%
Immediately post-fill, I put in a GTC order to take profit at .20 short of max or 87.80, but may take if off after the December dividend drops if something more "sexy" gives me that come hither look.

TLT is about to grow massively, divergence detectedThere is a very nice divergence in TLT in November on 1h timeframe. This is the end of the correction taking place since September 17 and IMO we will see a strong growth of TLT in upcoming months. Price targets are 102 - 110

Still holding the TLT long, 100 even 117+I am still holding the TLT long, not because I have a large position, but rather because I am constantly trying to objectively analyze and share with you.
Let’s explore the US Treasury Actives Yield Curve today:
Of course, when the rate was 5.5%, it was much more inverted. Today, we already have a significant divergence between the money market and bonds. From notes to 30-year bonds, our curve is mostly normal (with the exception of the 20- and 30-year bonds).
However, the market still cannot fully allocate in short bills. Nevertheless, this is a huge signal that the market is expecting just another series of rate cuts.
At a 4.75% rate, under other equal conditions, it is normal for the market to quote 20+ year bonds in the 4.6-5% range, but it is not normal for this to happen in an inverted curve.
I do not rule out that the yield on 20+ year bonds is much closer to 5% than 3%. But I cannot disagree that sooner or later we will witness the approach of the 4% boundary, which in turn implies TLT moving to the 100 level.
The long-term debt market likes at least a 1-2 year stable outlook, which will be achieved during the formation of Trump’s cabinet.
As the Fed already mentioned in its last meeting, it will try to maintain independence. I believe that Trump’s administration will not directly intervene in the Fed’s affairs. At the same time, the Fed will need to act in future rate cuts, particularly by cooling the labor market and stabilizing inflation.
It is clear that no significant changes will occur until the December meeting, but it is certain that the market will at least see the future administration’s outlook, and this is already a crucial event that will instill confidence in the long-term debt market.
Of course, there are several fundamental reasons that could be discussed in detail, but not today.)
So, TLT towards 100."

Time to buy $TLT for a trade to $100?I think we could see a short term rally in $TLT.
On low timeframes today, it looks like we've formed a double bottom and that price is bouncing off of the lower trend line. I think we could see a rally up into the $100-102 region from here.
My base case is for price to reject that region and then form one more leg lower before a sustainable bounce in bonds.
Let's see how it plays out. I marked off both levels to the upside and to the downside to account for both scenarios once price has broken out of the structure.
