TLT/XLF: Banks don't like what they smell.Banks are the best indicator of the financial health of the market.
Analysis:
TLT/XLF is flashing warning signs if banks fail to make new highs. Banks are being incredibly stingy with their money lending and low interest rates are not helping their profitability. Banks are sitting on Mr.Powells printed money. I am not seeing a lot of strength in the banking sector as, they have failed to follow other asset classes. XLF has failed to break its March highs which, is very concerning.
Looking back at history, when TLT rises faster than XLF, it is a bad sign for markets and an indicator of systemic risk. The ratio of TLT/XLF at this level has been a major support zone. Additionally, there was a very strong reversal. TLT is experiencing heavy buying volume and is reversing the down trend from March. The 2008 and 2020 market crashes occurred from these levels. Banks are acting very sheepish as, the smell the wolf (DXY) coming. Dollars are needed to pay off debts....Liquidity crisis?
Opinion:
A ticking time bomb, it's not a matter of if but, when. I am positioning myself away from this bomb an extra 10%-20% gains in equity is not worth a 40% risk, everyone has been so conditioned to buy the dip, it makes me wary to follow the flock. I am still long equities to an extent but, TLT is my biggest position. Please don't let my analysis get in the way from you buying GME,AMC,NOK,BB or FAANG. This is just the smoke alarm going off signaling a fire in the vicinity and I am telling people "Hey look over there". I truly do wish the best for everyone on WSB and the new wave of retail traders with limited understanding of markets hoping to make a quick buck. I just hope they aren't risk more than they are willing to lose.
TLT trade ideas


BOND RALLY STARTED STOCK TO FALL SHARP I have been talking about a TOP since jan 6 event based on my spiral work . I have been short 3744 to 3824 , as WELL HAS IWM AT 215 AND HOPING TO SEE 222 , The SOX INDEX i TARGETED 3200 WE ARE VERY CLOSE AND WOULD NOW BE LOOKING AT PUTS IN ALL THE INDEX . I been net long the US $ AT 89.50 AND HOLDING AS WELL AS TLT 158.5 AND ADDED AT 151.5 THE CRACKS ARE SHOWING LOOK FOR DEEP DOWNSIDE INTO MID FEB TO MARCH EARLY FOR THE TREND
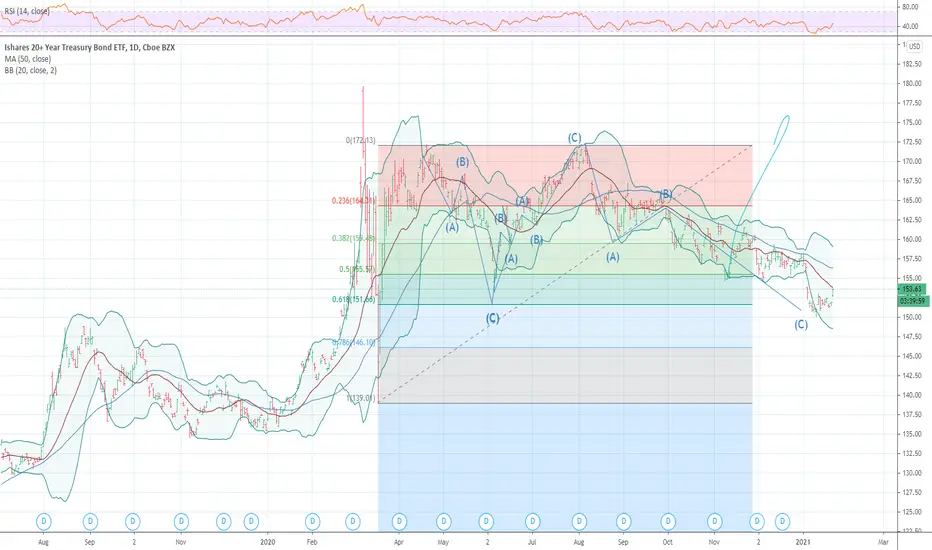
TLT: Double Top, confirmedDouble Top, 1W, Confirmed
Pros:
Descending Volume during formation
PPS below 50MA
RS descending and below 0
250RSI below 50
ATR descending
R/R ratio above 3
Cons:
PPS above 200MA
200MA ascending
Golden Cross in blue
Target:
PT = 138.09$

tlt looking pretty bearish, targeting 133all the moving averages and practically every other indicator are saying sell sell sell
most of the red flags are outlined on chart text.
the only other thing is, is that the fed basically said theyre gonna let bonds crash, or rather let interest rates go up, which is just a euphamism for letting the bonds crash.

TLT: The new suitor in town; With his wingman the Yield CurveThe dollar starting to rally should be very concerning for speculators in risk assets. The bond market has been heavily shorted and a short squeeze might be in order here. Look at how they bought a the rips and sold the dips since April. Back in January of last year we saw this same price action. The CTA are gonna start buying if we see the bottom hold that would be proof. This past week we saw the bond auctions have surprisingly good numbers with primary and indirect buyers showing enthusiasm for bonds. This might be the catalyst that has shorts exiting their positions. Bonds will now revert back to their natural flow and go up due to the tight financial conditions. Banks still need lower interest rates to give them a better incentive to lend (M2 - M1). We see this in January when the bond market started to settle and the CTAs started to buy in. The market is not expecting low interest rates because commodities have risen recently but this will most likely not continue. Why is Gold falling with Dollar, it tells you something fishy is happening.
Yield Curve: the yield curve is the 10 year minus the two year maturity rates. Retail traders don’t ever look at it but, it’s telling a story. The Ten year yield is not going to go up as fast as, the two year. The two year is headed to zero. This is going to drive the yield curve up even more. Let’s not forget a rising yield curve has predicted every recession.
Ciao!!


Expecting Rates to bounce here, and growth names along with it..Not investment advice. My opinion only.
TLT
potential clue for the next vix spikeI have found that ever time the trend changes or the uptrend line is touched in this chart it generally coincides with a very large vix spike. I have highlighted the trend changes in blue, and the line touches in red. it can be a lagging indicator maybe a day or 2 or maybe even longer. but i have a hunch this is telling me the market is about to turn.

TLT Prepare to LongDemand below Sideway Consolidation
Entry 147
stop 145
Target 157
Plan A: Sell PUT under 147 for now.
Plan B: Buy Call spread in the demand Zone
I am not a PRO trader. I trade option to test my trading plan with small cost.
The max Risk of each plan is less than 1% of my account.
If you like this idea, please use SIM/Demo account to try it.

Leading Indicators Part 2 - an early warningIn this second set of LEading indicators...
The TLT (Bonds ETF) see a sell off trend starting... this is actually bullish for the equities market
The TIPS appears to have possibly topped.
The VIX and VVIX are bullishly divergent. IMHO, due for a spike soon.
Overall... bullish until it hits the fan. It appears that we may be in for another surprise.
Just be cautious if you are bullish.

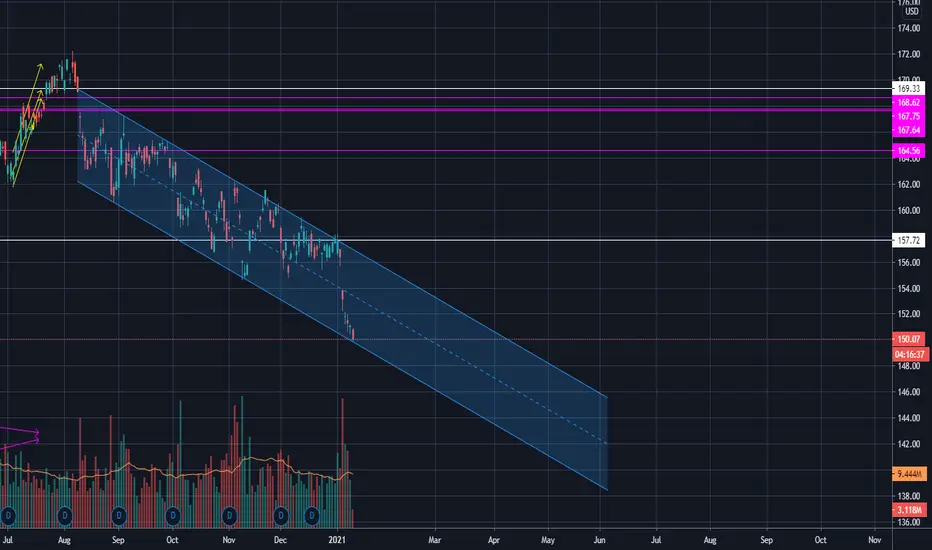
TLT Weekly - Return to trendline for '21?Watching TLT if it returns to this trendline (140s seems important for any bounce)

I HAVE ADDED A 10% MARGIN TO NET LONG 158.50 WE ARE NOW TWO LEGS DOWN FOR THE END OF THIS DROP AND AT .618

TLTNot a good look for bonds imo. I took a hit on my starter position today but going to avoid for a while at this point unless a good short setup appears.
