TQQQ continues to cheapen :)RSI(14) 41,498
STOCH(9,6) 30,891
STOCHRSI(14) 0,000
ADX(14) 38,308
WilliamsR -90,532
BullBear(13) -34,8480
TQQQ trade ideas

hourly picture still bullish, but not ruling out daily reversalthe hourly picture for the nasdaq is looking like weve managed to hold some support over a daily neckline. if that necklline is threatened, id imagine we are revisiting that lower level soon. if we break it- look out below as a close beneath $31 will probably dictate 29.24 or lower. if we manage to hang on to this daily uptrend and close above the 33 mark i would imagine were challenging 35. 32.97 remains where that flatlining TRAMA lies at the moment. choppy action trading in this range has been hard to swallow for a lot of swing traders who were hoping for a breakout, or trying to catch consolidation to the downisde. it has also been bearish for volatility however, and this could revive the bounce if we see a breakdown in vix soon.

TQQQ QQQ short term bullish Breakout of the falling wedge inside the falling wedge?
MA golden cross on the Hourly.

TQQQ Wants to "Get up!" the Charts Like James Brown's "Get Up" TQQQ Wants to "Get up!" the Charts Like James Brown's "Get Up"
Patterns Identified- Double Bottom and Falling Wedge. Both patterns show on the weekly, daily and four hour timeframes!
Day Low- 31.76 (This is where the double bottom rests)
9MA recently crossed above the 21 MA on the daily timeframe.
Therefore, I am bullish on TQQQ and prepared to dance to "Get Up" like JB if my analysis proves true.
I will enter a swing position for a move to the upside AFTER after a break above 33.49.
"Get Up!",
MrALtrades00

either forming bear cypher top or completing bull xabcdif we hold this low and beat low 33 area it should lead to 35 or high 34s
if we come down resisting low 32 area its doubtless still got more to lose and should see low 30s soon

eyes still on a potential reversalstill looks like aggressive dip buying at some point is going to trend above neckline here and cause additional 4hr squeeze as long as we hold 26.50 area if we get in the high 34s this could lead to above 40
right now the hourly is still bearish, but the daily reversal could still complete

TQQQ price predictiongoing to 39.9
As you can see this corresponds to a major point of prior support, and the .618 fib level.

Low risk entry on TQQQTQQQ (and the QQQ's) have been range-bound for the past few days, approx. between $31-$35 ($4). This is a little more than the 14-day ATR of $3.00.
In light of this, one way to paper trade this would be to take a long above $35 with stops at $31 and shorts below $31 with stops at $35. This is an 11.5% risk on a 3x leveraged stock which is a relatively tight range for the product's known volatility.


lets see if it can hold above strong resistance area 👀TQQQ straight green after the downtrend breakout, fresh breakout past a strong resistance as well!
watching for a rally to 35-40-45 in the short term

a long running trend that may changesince the top in december trama has crossed below vwma, and both have continued down together. the rare times they have diverged bullishly and rose together have been short lived. if things are going to be different this time the trend has to abruptly change. if we get a higher low compared to 27 and we break 33 i would shoot for 40 region. this rally is for profit taking unless we continue immediately over potential neckline or if we double bottom, or bounce off of 27 region, or continue immediately over 33. return to short if we close below 24.

TQQQ Support looking strong.* I have drawn 4 hour, daily, and weekly support/resistance lines based around highs and lows.
*Pitchfork shows current morning market within the fib areas.
*Overnight Lows are on a slow uptrend.
I look for a bullish day today, but with some low taps on overnight support. Could be a bit choppy, but hopefully a green day!

TQQQ , LONGThis is completely contrary to my normal TQQQ buy , but looking for a push out of the tight bear channel where the bulls take short term control
Plan to sell 1/3 at 1R and then see if I can run the balance .
****Note: Low probability trade here *** Basically doing the exact opposite of the price action rules here .
Entry 28.93
Stop 26.46
1R PT - 31.50

Support and Resistance BandsThis is my daily analysis of support and resistance based on daily highs/low trends, and overnight highs and lows, and daily double bottoms. I look for the day to bounce around any of these line, and then look for a breakout.
If I have a positive movement towards one of the resistance lines confirmed with ADX, SAR, and RSI then I will buy and sell at point of resistance. I will then look for a breakout at that resistance, or a retracements, waiting for confirmation and confluence before reentering the trade.

Bounce this morning on TQQQ* I have charted the AM Highs and Lows. For the last couple of days, the market has tapped both of these endpoints. Look for the market to tap these again.
*Pitchfork analysis says we are trending up this morning. Look for market to tap the AM High, then possible retrace.

Only Support Line for TQQQ15.15 is as low as TQQQ should drop for this bear cycle. The support has held steady since the last high in 2018.

TQQQ short term reversalFellas I’m thinking TQQQ will have short term reversal next week reason being:
1.At major support with high volume incoming
2.massive divergence on the daily chart
3.MACD crossover incoming

Don't forget the big pictureIn all crisis people will forget what really matters: economic growth in the technology sector will turn this baby into a 5x the next 2 years.
HODL for free money

TQQQ 5/13/22 RecapMarket gapped up today at the open and trended upward on abnormally low volume. Bears had a good week and are taking a long weekend. A similar low volume move occurred around April 19 and had little follow through.
Most likely is a consolidation around this level before another leg lower. A gap fill in the next couple of days to 28.50 is also likely. A long play would be to wait for break of channel, retest, and a target of the high volume node at 38.50.

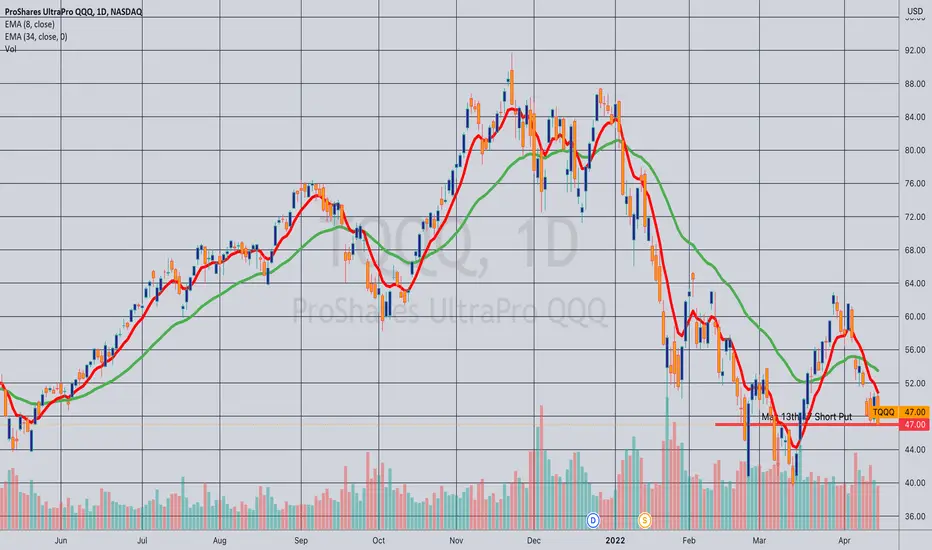
TQQQ Wheel of Fortune Modeling Although you can effectively model the P&L of 30 days 'til expiry at-the-money short puts, it's difficult to model "the other stuff" a trader would typically do with a short put that is in the money toward expiry (i.e., take assignment, roll out "as is," roll out for strike improvement, etc.). (At least, I don't have access to that kind of model or can't easily program one without breaking my brain).
You can, however, run a small number of occurrences (relatively speaking) to see how the setup would work in practice, so that you can have expectations as to how much the at-the-money 30 day short put pays over time, as well as the frequency of assignment and/or ending up with an in-the-money that has to be managed. You'd naturally have to run this for months to get any decent idea of how the setup would perform over a larger time frame. (Most studies actually look at selling a given strike in expiries of a given duration on a daily basis, which would be a lot of spreadsheet).
The basic rules:
1. Sell the at-the-money short put nearest 30 days until expiry.
2. Either close out the short put on approaching worthless (e.g., <.20) or run to expiry if in-the-money.
3. If assigned on any given short put, initially sell the 30 days until expiry call at the strike at which you sold the short put, looking to exit the resulting covered call at a profit.*
4. Since not everyone has "infinite cash," I'll assume a maximal deployment of 5 lots. As you can see by the chart, you can contemplate getting stuck in a particular rung or rungs for a lengthy period of time, reducing cost basis via rolls of the short call until you're able to exit that "leg" profitably or at break even. The ROC becomes almost immediately "less sexy" when that occurs, since that will potentially be "dead buying power" for weeks (and potentially months) at a time.
5. It's probably to one's advantage to have additional rules as to when and when not to pull the trigger on a given rung (i.e., implied volatility rank and 30-day implied), but for the sake of simplicity, I'm not setting out that type of rule here.
Pictured here would be the first leg, at the 47 strike in the May 13th expiry, paying 4.25 at the mid, with a resulting cost basis of 47.00 - 4.25 or 42.75 if assigned shares on the 47 short put.** For purposes of the return on capital calculation, I'm operating on the assumption that the short put will be cash secured,*** which means you'll tie up 42.75 of buying power to put this on, with the resulting ROC of 9.94% at max (implying a finish above the short put strike at expiry or the ability to pull off the short put on approaching worthless prior to that).
* -- In practice, this isn't what I do when confronted with an in-the-money short put at expiry. I look at (a) taking assignment; (b) rolling out the short put as is to varying durations; and (c) rolling out the short put with strike improvement to varying durations. I then compare and contrast what I would get for each in credit and generally opt for the choice that would result in the largest cost basis reduction. For example, I'm not going to take assignment to sell a call against for less credit than I could get by just rolling the short put out for duration.
** -- It doesn't look like you get much buying power relief on margin anyhow, at least with my broker. The buying power reduction for the 47 short put on margin appears to be 35.26 -- 75% of the short put strike. It's something, but not the typical relief you get on margin, which is about 20% of the short put strike. That being said, 4.25 on buying power effect of 35.26 is 12.05% at max -- a smidge sexier than cash secured.
*** -- I can also see a potential additional rule or rules that takes profit between 42.75 (your break even) and 47.00 toward expiry as extrinsic in the 47.00 converges on 0 or potentially rolls out the 47 to a 30 day at-the-money strike when it's in profit. On a practical level, I tend to do this quite a bit, but it's involves rolling from an out-of-the-money strike to an out-of-the-money strike, which continues to leave leave me with room to be wrong.
bounce imminentStill looking for that 15 minutes of crazy capitulation and volume but at these levels we've got a .618 retrace back to the 200 day moving average. Currently a smidge away from a .786 retrace of the entire post pandemic run and already back to prepandemic levels.
A halt to the Ukraine conflict could easily put this thing back in the high 50s. Again... wars are expensive and can't last forever.

Long tqqq 32.61 swing trade only to 42.60Lets look daily on bottom trying turn
look selling vol getting less
hit that support holding rally to 42.60
then stops. take profits their
weekly says lower

TQQQ 5/12/2022TL;DR - there is no reason to expect the bear trend is over.
Price remains below EMA, with EMA rejecting every attempt.
All recent bullish moves have been met with many sellers (note the extreme volume on relatively small bullish candles).
Price remains in the bearish channel established at the beginning of April.
Next level of support below the pre-Covid peak is at 18. Given the speed at which price moved through this area in Feb-Apr 2020, a medium range target of $18 is not unreasonable.
