Opening (IRA): TQQQ March 21st 68 Covered Call... for a 64.63 debit.
Comments: Starter position on weakness, selling the -75 delta call against shares to emulate the delta metrics of a 25 delta short put, but with built-in short call defense.
Metrics:
Buying Power Effect/Break Even: 64.63
Max Profit: 3.37
ROC at Max: 5.21%
50% Max: 1.69
ROC at 50% Max: 2.61%
Will generally look to take profit at 50% max, add at intervals assuming I can get in at strikes better than what I currently have on, and/or roll out short call if my TP is not hit.
TQQQ trade ideas

Opening (IRA): TQQQ March 21st 71 Covered Call... for a 67.75 debit.
Comments: Starter position, selling the -75 delta call against shares to emulate the delta metrics of a 25 delta short put, but with the built-in defense of the short call.
Metrics:
Buying Power Effect/Break Even: 67.75/share
Max Profit: 3.25
ROC at Max: 4.80%
50% Max: 1.63
ROC at 50% Max: 2.40%
Will generally look to take profit at 50% max, add at intervals (assuming I can get in at break evens/strikes better than what I currently have on), and/or roll out short call if my take profit is not hit.

Opening (IRA): TQQQ March 21st 69 Covered Call... for a 65.42 debit.
Comments: High IV + weakness. Selling the -75 call against shares to emulate the delta metrics of a 25 delta short put, but with the built-in defense of the short call.
Metrics:
Buying Power Effect/Break Even: 65.42
Max Profit: 3.58
ROC at Max: 5.47%
50% Max: 1.79
ROC at 50% Max: 2.74%
Will generally look to take profit at 50% max, add at intervals (assuming I can get in at a break even better than what I currently have on), and/or roll out the short call in the event take profit is not hit.

"The Wall" QQQ Short Setup on Weekly Chart - Bye bye profitsThere is an old saying when you look at macro-economics - 'When people stop buying chips, take your bets off the table". You can always know when the house is about to win. It's when the numbers of people at the chips window is starting to teeter. When the house sees that, they push the buzzer int he pocket of all the dealers - "take the chips back from the public, we are not seeing enough withdrawals to constitude offering any more winnings". So, the dealers take as many chips of your out, to give it back to the bank. When this thing pivots, whose side are you going to be on? I hear the hopium is really good over by the backarack table. Maybe we should try some on leverage before the dealer gets buzzed. Oh wait, what's that sound? It's the sound of 10 years of consolidation and net 0 returns on Total Stock market. Ready to till the earth for food? I'm not, and that's why I'm long treasuries. +5% is better than -30%.

Trading TQQQ and having stats on your sideThe video describes an indicator for buy/sell signals for the ETF TQQQ that I am releasing for free

Pure Bearish Divergence on the MonthlyThe trend is your friend. Late to the party anyone? Tech is going to be so big this year, I know it.SHORT QQQ

TQQQ I Potential Long Opportunity from Support Welcome back! Let me know your thoughts in the comments!
** TQQQ Analysis - Listen to video!
We recommend that you keep this pair on your watchlist and enter when the entry criteria of your strategy is met.
Please support this idea with a LIKE and COMMENT if you find it useful and Click "Follow" on our profile if you'd like these trade ideas delivered straight to your email in the future.
Thanks for your continued support!Welcome back! Let me know your thoughts in the comments!

Super Simple Buying and Selling Stocks within TradingView.With the market pulling back nearly 14% over the past few days, I decided to take a punt on a potential recovery. I've opened a position in TQQQ , a 3x leveraged ETF tracking the Nasdaq 100 (top 100 tech stocks).
In this post, I show how easy it is to place an order using a connected TradingView broker—in my case, TradeStation—and set up a bracket order with a take-profit and stop-loss.
If the trade moves against me, the stop-loss automatically manages my risk by closing the position. If it moves in my favor, the take-profit ensures I lock in gains and exit automatically.
Of course, these levels can be really easily adjusted manually as the trade progresses, providing flexibility as the stock moves. You could choose to set your levels based on your favorite indicators signals or some other means.
This isn’t trading advice—just an example of how you can leverage TradingView’s functionality.
It’s real money on the line—my money—so wish me luck! That said, the market could still head lower with ongoing Fed FUD, but I’m holding out hope for a little help from Santa. 🎅

Opening (IRA): TQQQ December 20th 74 Covered Call... for a 71.29 debit.
Comments: Selling the -75 delta call against stock to emulate the delta metrics of a 25 delta short put, but with built-in short call defense.
I'm looking at this as a starter position because I kind of have a feeling that I'm going to regret not putting this on in weakness/higher IV and will be adding at better strikes/break evens (only time will tell).
Metrics:
Buying Power Effect/Break Even: 71.29/share
Max Profit: 2.71
ROC at Max: 3.80%
50% Max: 1.36
ROC at 50% Max: 1.90%

Cup&handle and what next?into 2025-
-An interest rate cut is expected
- A new pro-business president
-7 MAGS with a very strong projection forward
- The NASDAQ market breaks records and continues the momentum
-Focus on artificial intelligence: as companies like NVIDIA, Microsoft and Amazon continue to lead the market.
We just have to keep following what is happening. $86-90 looks like a new gathering area?
Wait for the volume and don't forget it is very volatile. Put stops correctly.

Opening (IRA): TQQQ January 17th 65 Covered Call... for a 61.79 debit.
Comments: Adding a "rung" at a break even better than what I currently have on, selling the -75 delta call against stock to emulate the delta metrics of a 25 delta short put, but with the built-in defense of the short call.
Metrics:
Buying Power Effect/Break Even: 61.79/share
Max Profit: 3.21 ($321)
ROC at Max: 5.20%
50% Max: 1.62 ($162)
ROC at 50% Max: 2.60%
Will generally look to take profit at 50% max, roll out short call on take profit test (which is at 63.40).

TQQQ WEEK OF 11/18/24TQQQ WEEK OF 11/18/24
To maintain simplicity, once the price moves beyond the WHITE range, monitor for a potential retest of the breached level.
Be prepared to initiate long or short positions targeting the YELLOW ranges. While prices may surpass the YELLOW range targets, these levels provide a robust framework for securing profits. 🎯🫡
*These levels are derived from comprehensive backtesting and research, demonstrating over 90% accuracy. This statistical foundation suggests that price movements are likely to exceed initial estimates.*
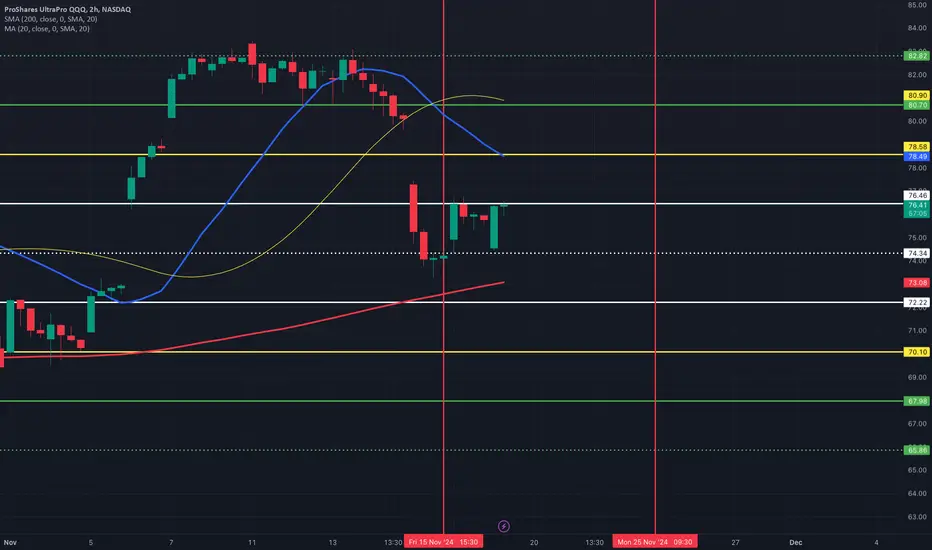
UltraPro QQQ. Trump-a-rally gives no light for leveraged betsIt's gone 10 days or so, since Mr. Trump has secured a win over his Democrat-rival Kamala Harris in the 2024 U.S. presidential election, as it declared by the Associated Press.
Since that, a lot of stocks soared in a meme-style mode, while Bitcoin clears $93,000 and Dogecoin soared amid Trump-fueled crypto rally.
The main graph is for UltraPro QQQ NASDAQ:TQQQ and it indicates, that major 82-Dollars resistance for leveraged bets on Tech sector has not been broken yet.
👉 NASDAQ:QQQ is a traditional ETF that tracks the Nasdaq-100 Index, suitable for long-term investors seeking broad exposure to tech-focused stocks.
👉 NASDAQ:TQQQ is a leveraged ETF that aims to deliver triple (3x) the daily returns of the Nasdaq-100 Index, making it only suitable for short-term traders.
Since US dollar interest rates are still near multi year highs and Powell says the Fed is in no hurry to cut interest rates.. all of that means Trump-a-rally gives no light for leveraged bets (yet).
Potentially everything can be clear in January, 2025 only.
GL y'all. Cheers, @Pandorra 😎

Opening (IRA): TQQQ August 16th 73 Monied Covered Call... for a 70.80 debit.
Comments: High IV at 55%. Buying a one lot and selling a -75 call against in the August 16th monthly to emulate the delta metrics of a 25 delta short put, but with built-in short call defense. I looked at doing something in the 45 DTE wheelhouse, which would be the August 30th expiry, but it was less liquid than the monthly, so opted to go shorter duration, with the plan being to roll out to the September monthly should we get further weakness and/or a test of 73. Otherwise, I'll look to just take profit at my standard 50% max.
Metrics:
Buying Power Effect/Break Even: 70.80
Max Profit: 2.20
ROC at Max: 3.11%
50% Max: 1.10
ROC at 50% Max: 1.55%

Opening (IRA): TQQQ Sept 20th 63 Monied Covered Call... for a 59.60 debit.
Comments: High IVR/high IV at 68.7/63.1%. Selling the -75 delta call against stock to emulate the delta metrics of a 25 delta short put, but with the built-in defense of the short call.
Additionally, adding at strikes/break evens better than what I've current got on (the August 16th 73 covered calls; break even 70.80).
Metrics:
Buying Power Effect/Break Even: 59.60
Max Profit: 3.40
ROC at 50% Max: 5.70%
50% Max: 1.70
ROC at 50% Max: 2.85%
Will generally look to take profit at 50% max; roll the short call out for duration on side test.

New SetupTQQQ: I have a green setup signal(dot Indictor). It has an excellent risk-to-reward ratio(RR:). I'm looking to enter long near the close of the day if the stock can manage to CLOSE above the last candle highs(white line). If triggered, I will then place a stop-loss below(SL) and a price target above it(TP1).
********
Note: The above setups will remain valid until the stock CLOSES BELOW my set stop-loss level.

Opening (IRA): TQQQ Oct 18th 59 Monied Covered Call... for a 56.10 debit.
Comments: This isn't at a lower strike than what I currently have on, but I'm (somewhat) fine with it, since I'm still below what I have in mind to be maximally deployed in this instrument.
Selling the -75 delta call against stock to emulate the delta metrics of a 25 delta short put, but with the built in defense of the short call.
Metrics:
Buying Power Effect/Break Even: 56.10
Max Profit: 2.90
ROC at Max: 5.17%
50% Max: 1.45
ROC at 50% Max: 2.58%
Will generally look to take profit at 50% max, roll out in-profit short call for duration and credit.

TQQQ I Next long opportunity - following correction from 74.87Welcome back! Let me know your thoughts in the comments!
** TQQQ Analysis - Listen to video!
We recommend that you keep this pair on your watchlist and enter when the entry criteria of your strategy is met.
Please support this idea with a LIKE and COMMENT if you find it useful and Click "Follow" on our profile if you'd like these trade ideas delivered straight to your email in the future.
Thanks for your continued support!Welcome back! Let me know your thoughts in the comments!

What happened today in the market?What happened today in the market?
At the beginning of the week, we knew that Friday would be one of the most important days of the month, as the unemployment rate report would be published, among other indicators. The result was favorable; the current rate stands at 4.1%, better than the forecast of 4.2% and the previous figure also at 4.2%. Additionally, news regarding the possibility of an agreement on the strikes at the most important ports in the U.S. contributed to an optimistic atmosphere.
Before the market opened, the indices surged upward. However, in the pre-market, we observed a particular behavior in the main ETFs, such as AMEX:SPY and $QQQ. In the case of NASDAQ:TQQQ , there was a price interruption of approximately $6 in $QQQ. This type of movement can leave many investors trapped due to the previous session's closures since they had open positions.
Despite the positive report and the overall optimistic sentiment, at the market's opening, the price remained sideways for about 25 minutes, during which many investors decided to take profits. This resulted in a pullback that wiped out the pre-market gains.
However, after that drop, the chart showed notable respect for the 61.8% Fibonacci retracement level, considered one of the most relevant levels. By respecting this level, the market experienced a new bullish impulse, better assimilating the profit-taking.

Weekly Seasonality Dynamic Kelly (Indicator Discussion)# Enhancing Trading Strategies with the Weekly Seasonality Dynamic Kelly Criterion Indicator
Amidst this pursuit to chase price, a common pitfall emerges: an overemphasis on price movements without adequate attention to risk management, probabilistic analysis, and strategic position sizing. To address these challenges, I developed the **Weekly Seasonality with Dynamic Kelly Criterion Indicator**. It is designed to refocus traders on essential aspects of trading, such as risk management and probabilistic returns, thereby catering to both short-term swing traders and long-term investors aiming for tax-efficient positions.
## The Motivation Behind the Indicator
### Overemphasis on Price: A Common Trading Pitfall
Many traders concentrate heavily on price charts and technical indicators, often neglecting the underlying principles of risk management and probabilistic analysis. This overemphasis on price can lead to:
- **Overtrading:** Making frequent trades based solely on price movements without considering the associated risks.
- **Poor Risk Management:** Failing to set appropriate stop-loss levels or position sizes, increasing the potential for significant losses.
- **Emotional Trading:** Letting emotions drive trading decisions rather than objective analysis, which can result in impulsive and irrational trades.
### The Need for Balanced Focus
To achieve sustained trading success, it is crucial to balance price analysis with robust risk management and probabilistic strategies. Key areas of focus include:
1. **Risk Management:** Implementing strategies to protect capital, such as setting stop-loss orders and determining appropriate position sizes based on risk tolerance.
2. **Probabilistic Analysis:** Assessing the likelihood of various market outcomes to make informed trading decisions.
3. **Swing Trading Percent Returns:** Capitalizing on short- to medium-term price movements by buying assets below their average return and selling them above.
## Introducing the Weekly Seasonality with Dynamic Kelly Criterion Indicator
The **Weekly Seasonality with Dynamic Kelly Criterion Indicator** is designed to integrate these essential elements into a comprehensive tool that aids traders in making informed, risk-aware decisions. Below, we explore the key components and functionalities of this indicator.
### Key Components of the Indicator
1. **Average Return (%)**
- **Definition:** The mean percentage return for each week across multiple years.
- **Purpose:** Serves as a benchmark to identify weeks with above or below-average performance, guiding buy and sell decisions.
2. **Positive Percentage (%)**
- **Definition:** The proportion of weeks that yielded positive returns.
- **Purpose:** Indicates the consistency of positive returns, helping traders gauge the reliability of certain weeks for trading.
3. **Volatility (%)**
- **Definition:** The standard deviation of weekly returns.
- **Purpose:** Measures the variability of returns, providing insights into the risk associated with trading during specific weeks.
4. **Kelly Ratio**
- **Definition:** A mathematical formula used to determine the optimal size of a series of bets to maximize the logarithmic growth of capital.
- **Purpose:** Balances potential returns against risks, guiding traders on the appropriate position size to take.
5. **Adjusted Kelly Fraction**
- **Definition:** The Kelly Ratio adjusted based on user-defined risk tolerance and external factors like Federal Reserve (Fed) stance.
- **Purpose:** Personalizes the Kelly Criterion to align with individual risk preferences and market conditions, enhancing risk management.
6. **Position Size ($)**
- **Definition:** The calculated amount to invest based on the Adjusted Kelly Fraction.
- **Purpose:** Ensures that position sizes are aligned with risk management strategies, preventing overexposure to any single trade.
7. **Max Drawdown (%)**
- **Definition:** The maximum observed loss from a peak to a trough of a portfolio, before a new peak is attained.
- **Purpose:** Assesses the worst-case scenario for losses, crucial for understanding potential capital erosion.
### Functionality and Benefits
- **Weekly Data Aggregation:** Aggregates weekly returns across multiple years to provide a robust statistical foundation for decision-making.
- **Quarterly Filtering:** Allows users to filter weeks based on quarters, enabling seasonality analysis and tailored strategies aligned with specific timeframes.
- **Dynamic Risk Adjustment:** Incorporates the Dynamic Kelly Criterion to adjust position sizes in real-time based on changing risk profiles and market conditions.
- **User-Friendly Visualization:** Presents all essential metrics in an organized Summary Table, facilitating quick and informed decision-making.
## The Origin of the Kelly Criterion and Addressing Its Limitations
### Understanding the Kelly Criterion
The Kelly Criterion, developed by John L. Kelly Jr. in 1956, is a formula used to determine the optimal size of a series of bets to maximize the long-term growth of capital. The formula considers both the probability of winning and the payout ratio, balancing potential returns against the risk of loss.
**Kelly Formula:**
\
Where:
- \( b \) = the net odds received on the wager ("b to 1")
- \( p \) = probability of winning
- \( q \) = probability of losing ( \( q = 1 - p \) )
### The Risk of Ruin
While the Kelly Criterion is effective in optimizing growth, it carries inherent risks:
- **Overbetting:** If the input probabilities or payout ratios are misestimated, the Kelly Criterion can suggest overly aggressive position sizes, leading to significant losses.
- **Assumption of Constant Probabilities:** The criterion assumes that probabilities remain constant, which is rarely the case in dynamic markets.
- **Ignoring External Factors:** Traditional Kelly implementations do not account for external factors such as Federal Reserve rates, margin requirements, or market volatility, which can impact risk and returns.
### Addressing Traditional Limitations
Recognizing these limitations, the **Weekly Seasonality with Dynamic Kelly Criterion Indicator** introduces enhancements to the traditional Kelly approach:
- **Incorporation of Fed Stance:** Adjusts the Kelly Fraction based on the current stance of the Federal Reserve (neutral, dovish, or hawkish), reflecting broader economic conditions that influence market behavior.
- **Margin and Leverage Considerations:** Accounts for margin rates and leverage, ensuring that position sizes remain within manageable risk parameters.
- **Dynamic Adjustments:** Continuously updates position sizes based on real-time risk assessments and probabilistic analyses, mitigating the risk of ruin associated with static Kelly implementations.
## How the Indicator Aids Traders
### For Short-Term Swing Traders
Short-term swing traders thrive on capitalizing over weekly price movements. The indicator aids them by:
- **Identifying Favorable Weeks:** Highlights weeks with above-average returns and favorable volatility, guiding entry and exit points.
- **Optimal Position Sizing:** Utilizes the Adjusted Kelly Fraction to determine the optimal amount to invest, balancing potential returns with risk exposure.
- **Probabilistic Insights:** Provides metrics like Positive Percentage (%) and Kelly Ratio to assess the likelihood of favorable outcomes, enhancing decision-making.
### For Long-Term Tax-Free Investors
This is effectively a drop-in replacement for DCA which uses fixed position size that doesn't change based on market conditions, as a result, it's like catching multiple falling knifes by the blade and smiling with blood on your hand... I don't know about you, but I'd rather juggle by the hilt and look like an actual professional...
Long-term investors, especially those seeking tax-free positions (e.g., through retirement accounts), benefit from:
- **Consistent Risk Management:** Ensures that position sizes are aligned with long-term capital preservation strategies.
- **Seasonality Analysis:** Allows for strategic positioning based on historical performance trends across different weeks and quarters.
- **Dynamic Adjustments:** Adapts to changing market conditions, maintaining optimal risk profiles over extended investment horizons.
### Developers
Please double check the logic and functionality because I think there are a few issue and I need to crowd source solutions and be responsible about the code I publish. If you have corrections, please DM me or leave a respectful comment.
I want to publish this by the end of the year and include other things like highlighting triple witching weeks, adding columns for volume % stats, VaR and CVaR, alpha, beta (to see the seasonal alpha and beta based off a benchmark ticker and risk free rate ticker and other little goodies.
//@version=5
indicator("Weekly Seasonality with Dynamic Kelly Criterion", overlay=false, max_labels_count=500)
////////////
// Inputs //
////////////
// User Inputs
int startYearInput = input.int(2015, "Starting Year for Analysis", minval=1900)
float capitalInput = input.float(10000, "Available Capital ($)", minval=0)
// User-defined inputs
float riskToleranceInput = input.float(1.0, "Risk Tolerance (0-1)", minval=0, maxval=1)
float maxDrawdownInput = input.float(20.0, "Maximum Drawdown (%)", minval=0)
float marginRateInput = input.float(0.5, "Margin Rate (0-1)", minval=0.01, maxval=1)
float maintenanceRateInput = input.float(0.25, "Maintenance Rate (0-1)", minval=0, maxval=1)
string fedStanceInput = input.string("neutral", "Fed Stance", options= )
// Options to display the results
bool showTableInput = input.bool(true, "Show Weekly Summary Table")
// Quarter Inputs
// Options to filter returns by specific quarters
bool q1Input = input.bool(true, "Q1")
bool q2Input = input.bool(false, "Q2")
bool q3Input = input.bool(false, "Q3")
bool q4Input = input.bool(false, "Q4")
/////////////////////////
// Function Definitions //
/////////////////////////
// Function to calculate adjusted Kelly Fraction based on Kelly Ratio, risk tolerance, and Fed stance
calculateAdjustedKellyFraction(float kellyRatio, float riskTolerance, string fedStance) =>
// Adjust Kelly Fraction based on risk tolerance
float adjustedKellyFraction = kellyRatio * riskTolerance
// Adjust based on Fed stance
float kellyAdjustment = fedStance == "dovish" ? 0.1 : fedStance == "hawkish" ? -0.1 : 0.0
adjustedKellyFraction := adjustedKellyFraction + kellyAdjustment
// Ensure Kelly fraction is within bounds
adjustedKellyFraction := math.max(math.min(adjustedKellyFraction, 1), -1)
adjustedKellyFraction
// Custom function to sum over an array
sumArray(float arr) =>
float total = 0.0
for i = 0 to array.size(arr) - 1
total += array.get(arr, i)
total
// Function to calculate standard deviation for returns
calculateStdDev(float returns) =>
int count = array.size(returns)
if count > 1
float avg = sumArray(returns) / count
float sumSqDiffs = 0.0
for i = 0 to count - 1
float val = array.get(returns, i)
float diff = val - avg
sumSqDiffs += diff * diff
float variance = sumSqDiffs / (count - 1)
math.sqrt(variance)
else
0.0
// Function to calculate Kelly Ratio
calculateKellyRatio(float returns) =>
float winCount = 0.0
float lossCount = 0.0
float totalWinReturn = 0.0
float totalLossReturn = 0.0
int n = array.size(returns)
for i = 0 to n - 1
float ret = array.get(returns, i)
if ret > 0
winCount += 1
totalWinReturn += ret
else if ret < 0
lossCount += 1
totalLossReturn += math.abs(ret)
float winProb = (winCount + lossCount) > 0 ? winCount / (winCount + lossCount) : 0.0
float lossProb = 1 - winProb
float avgWinReturn = winCount > 0 ? totalWinReturn / winCount : 0.0
float avgLossReturn = lossCount > 0 ? totalLossReturn / lossCount : 0.0
float kellyRatio = 0.0
if avgLossReturn != 0 and avgWinReturn != 0
float odds = avgWinReturn / avgLossReturn
if odds != 0
kellyRatio := winProb - (lossProb / odds)
kellyRatio
// Function to calculate Max Drawdown
calculateMaxDrawdown(float returns) =>
if array.size(returns) == 0
0.0
else
float peak = array.get(returns, 0) // Updated to use array.get
float maxDD = 0.0
float cumulativeReturn = 0.0
for i = 0 to array.size(returns) - 1
cumulativeReturn += array.get(returns, i) // Updated to use array.get
if cumulativeReturn > peak
peak := cumulativeReturn
float drawdown = peak - cumulativeReturn
if drawdown > maxDD
maxDD := drawdown
maxDDPercent = peak != 0 ? (maxDD / peak) * 100 : 0.0
maxDDPercent
/////////////////////////////////
// Data Retrieval and Processing //
/////////////////////////////////
// Initialize variables
var float weekReturnSums = array.new_float(52, 0.0)
var int weekReturnCounts = array.new_int(52, 0)
var int weekPositiveCounts = array.new_int(52, 0)
var float weekReturnSquares = array.new_float(52, 0.0)
var float allWeekReturns = array.new_float()
var int allWeekNums = array.new_int()
// Get weekly data using request.security
= request.security(syminfo.tickerid, 'W', )
// Detect new week
isNewWeek = ta.change(weeklyTime)
if isNewWeek
int weekNum = weekofyear(weeklyTime ) // Previous week number
int yearNum = year(weeklyTime )
if yearNum >= startYearInput
float prevWeeklyClose = weeklyClose
float currWeeklyClose = weeklyClose
float ret = (currWeeklyClose - prevWeeklyClose) / prevWeeklyClose * 100
// Update the arrays
int idx = weekNum - 1 // index in arrays
if idx >= 0 and idx < 52
// Sum of returns
sum = array.get(weekReturnSums, idx) + ret
array.set(weekReturnSums, idx, sum)
// Count of returns
count = array.get(weekReturnCounts, idx) + 1
array.set(weekReturnCounts, idx, count)
// Sum of squared returns
sumSq = array.get(weekReturnSquares, idx) + ret * ret
array.set(weekReturnSquares, idx, sumSq)
// Positive counts
posCount = array.get(weekPositiveCounts, idx)
if ret > 0
posCount += 1
array.set(weekPositiveCounts, idx, posCount)
// Store all returns and week numbers
array.push(allWeekReturns, ret)
array.push(allWeekNums, weekNum)
////////////////
// Visualization //
////////////////
if showTableInput and barstate.islast
// Prepare data for the table
var int selectedWeekNumbers = array.new_int()
var float avgReturnsArray = array.new_float()
var float stdDevArray = array.new_float()
var float posPercentsArray = array.new_float()
var float kellyRatiosArray = array.new_float()
var float adjustedKellyFractionsArray = array.new_float()
var float positionSizesArray = array.new_float()
var float maxDrawdownsArray = array.new_float()
for idx = 0 to 51
int weekNum = idx + 1
// Check if the week number is in the specified quarters
bool isInQuarter = (weekNum >= 1 and weekNum <= 13 and q1Input) or
(weekNum >= 14 and weekNum <= 26 and q2Input) or
(weekNum >= 27 and weekNum <= 39 and q3Input) or
(weekNum >= 40 and weekNum <= 52 and q4Input)
if isInQuarter
int count = array.get(weekReturnCounts, idx)
if count > 0
array.push(selectedWeekNumbers, weekNum)
float sum = array.get(weekReturnSums, idx)
float avgRet = sum / count
array.push(avgReturnsArray, avgRet)
float sumSq = array.get(weekReturnSquares, idx)
float variance = (sumSq - (sum * sum) / count) / (count - 1)
float stdDev = variance > 0 ? math.sqrt(variance) : 0.0
array.push(stdDevArray, stdDev)
// Positive percentage
int posCount = array.get(weekPositiveCounts, idx)
float posPercent = posCount / count * 100
array.push(posPercentsArray, posPercent)
// Extract returns for this week
float returnsArray = array.new_float()
for i = 0 to array.size(allWeekReturns) - 1
if array.get(allWeekNums, i) == weekNum
array.push(returnsArray, array.get(allWeekReturns, i))
// Kelly Ratio
float kellyRatio = calculateKellyRatio(returnsArray)
array.push(kellyRatiosArray, kellyRatio)
// Adjusted Kelly Fraction
float adjustedKellyFraction = calculateAdjustedKellyFraction(kellyRatio, riskToleranceInput, fedStanceInput)
array.push(adjustedKellyFractionsArray, adjustedKellyFraction)
// Leverage factor
float leverageFactor = marginRateInput > 0 ? 1 / marginRateInput : 1.0
// Max position size
float maxPositionSize = capitalInput * leverageFactor
// Position size
float positionSize = maxPositionSize * adjustedKellyFraction
// Ensure position size does not exceed max position size
positionSize := math.min(positionSize, maxPositionSize)
// Max Drawdown
float maxDD = calculateMaxDrawdown(returnsArray)
// Adjust position size if max drawdown exceeds maxDrawdownInput
if maxDD > maxDrawdownInput and maxDD != 0
positionSize := positionSize * (maxDrawdownInput / maxDD)
array.push(positionSizesArray, positionSize)
array.push(maxDrawdownsArray, maxDD)
// Limit the number of rows to fit within the table size limit
int maxRows = 49 // 49 data rows + 1 header row = 50 total rows
int totalRows = array.size(selectedWeekNumbers)
int numRows = math.min(totalRows, maxRows)
int startIndex = 0 // Display from the first selected week
// Create table
var table returnsTable = table.new(position.top_right, 8, numRows + 1, border_width=1)
// Set table headers
table.cell(returnsTable, 0, 0, "Week", bgcolor=color.gray, text_color=color.white)
table.cell(returnsTable, 1, 0, "Avg Return (%)", bgcolor=color.gray, text_color=color.white)
table.cell(returnsTable, 2, 0, "Volatility (%)", bgcolor=color.gray, text_color=color.white)
table.cell(returnsTable, 3, 0, "Pos %", bgcolor=color.gray, text_color=color.white)
table.cell(returnsTable, 4, 0, "Kelly Ratio", bgcolor=color.gray, text_color=color.white)
table.cell(returnsTable, 5, 0, "Adj Kelly Frac", bgcolor=color.gray, text_color=color.white)
table.cell(returnsTable, 6, 0, "Position Size ($)", bgcolor=color.gray, text_color=color.white)
table.cell(returnsTable, 7, 0, "Max Drawdown (%)", bgcolor=color.gray, text_color=color.white)
// Populate table
for idx = startIndex to numRows - 1
int row = idx + 1 // Adjust row index for the table
int weekNum = array.get(selectedWeekNumbers, idx)
float avgRet = array.get(avgReturnsArray, idx)
float stdDev = array.get(stdDevArray, idx)
float posPercent = array.get(posPercentsArray, idx)
float kellyRatio = array.get(kellyRatiosArray, idx)
float adjustedKellyFraction = array.get(adjustedKellyFractionsArray, idx)
float posSize = array.get(positionSizesArray, idx)
float maxDD = array.get(maxDrawdownsArray, idx)
// Week Number
table.cell(returnsTable, 0, row, str.tostring(weekNum))
// Avg Return (%)
table.cell(returnsTable, 1, row, str.format("{0,number,#.##}", avgRet))
// Volatility (%)
table.cell(returnsTable, 2, row, str.format("{0,number,#.##}", stdDev))
// Pos %
table.cell(returnsTable, 3, row, str.format("{0,number,#.##}", posPercent))
// Kelly Ratio
table.cell(returnsTable, 4, row, str.format("{0,number,#.####}", kellyRatio))
// Adj Kelly Frac
table.cell(returnsTable, 5, row, str.format("{0,number,#.####}", adjustedKellyFraction))
// Position Size ($)
table.cell(returnsTable, 6, row, str.format("{0,number,#.##}", posSize))
// Max Drawdown (%)
table.cell(returnsTable, 7, row, str.format("{0,number,#.##}", maxDD))

Opening (IRA): TQQQ Dec 20th 47 Covered Call.. for a 42.71 debit.
Comments: Since all my rungs are now out in Dec, adding one at lower break evens than what I currently have on, selling the -75 delta call against long stock to emulate a 25 delta short put, but with built-in short call defense.
Metrics:
Buying Power Effect/Break Even: 42.71
Max Profit: 4.29
ROC at Max: 10.04%
50% Max: 2.15
ROC at 50% Max: 5.02%

Are we seeing a repeat of past situations, or has the market truIf we look at ETFs like QQQ, we can notice price breaks between sessions, let's see where these interruptions occur.
First interruption this is a gap of $1.50, which represents an increase of approximately 2.6%, from $59 to $60.
Second interruption occurs between $63 and $66, which implies an increase of 3.5%.
On the chart, we can also observe a bullish channel that, due to the strength of the buyers, has not been respected, so far we could consider the price to be in a phase where it could take a break or pull back, which would be healthy for $QQQ.
We have seen similar behavior in stocks with low market caps, which experience a phenomenon known as "pump and dump", where they rise non stop and then fall, therefore, a break in the price is considered healthy.
Continuing with the analysis, in the past, the QQQ has shown patterns that are usually respected, although these can take days, weeks or even months to complete, for example, from July 16 to 17, there was a strong bearish opening that left a gap of $2.50 this pattern was repeated from July 23 to 24, and currently, the price has already completed half of that gap.
Based on previous patterns, we can assume that a bullish move in QQQ of approximately 2% is expected, around $1.50 upwards, considering this, it might be prudent to wait for that move to complete to enter a bearish position and take advantage of the pullback, especially since the price is at resistance at $72. normally, when price first hits resistance, it tends to pull back as buyers decide to take profits.
The Goldman Sachs Bull/Bear indicator is a cool way to check the market sentiment Currently, it is at 70% levels, indicating bullish sentiment and widespread optimism among investors However, this level can also be a cause for concern, as such a high indicator could signal a possible correction in the market. Although it is not an exact science and it is difficult to predict when a correction will occur, we can analyze historical examples to better understand its behavior
November 2007 during this period, there was a real estate boom and a strong economy, a context reflected in the film "The Big Short" at that time, the goldman sachs indicator was close to 70%, and shortly after, the market began to correct, kicking off the 2008 global financial crisis.
January 2020 the market was experiencing a continued rally due to optimism around monetary policy and widespread positive sentiment, however in February 2020, a sharp decline began due to the onset of the COVID-19 pandemic.
December 1999 the rise of technology companies during the dot-com bubble led to extremely optimistic sentiment in march 2000, the bubble popped, resulting in a prolonged decline in this case, the Goldman Sachs indicator was also close to 70%.
In my point of view, the market can rise a little more but it should have a final bullish impulse and be able to begin to retreat, historically september has been one of the weakest months of the year.

Opened (IRA): TQQQ Sept 20th 58 Monied Covered Call... for a 54.85 debit.
Comments: Added to my position at a strike/break even better than what I currently have on.
Metrics:
Buying Power Effect/Break Even: 54.85/share
Max Profit: 3.15 ($315)
ROC at Max: 5.74%
50% Max: 1.58 ($158)
ROC at 50% Max: 2.87%
