Opening (IRA): TQQQ Sept 20th 49 Monied Covered Call... for a 45.45 debit.
Comments: Last rung in Sept ... . Selling the -75 call against stock to emulate the delta metrics of a 25 delta long put with the built-in defense of the short call.
Metrics:
Break Even/Buying Power Effect: 45.45
Max Profit: 3.55 ($355)
ROC at Max: 7.81%
50% Max: 1.78 ($178)
ROC at 50% Max: 3.91%
TQQQ trade ideas

TQQQ and Tech Stock Intraday SetupI noticed today that there was a solid intraday trade opportunity across many tech stocks. It had to be well-timed, but it wasn't insignificant.
While the large sell-off in the news is true, the data was a bit lagged in terms of a "today" trading opportunity that presented itself this morning on AMZN, TSLA, TQQQ, and several others for at least 1-2% upside with a reasonable risk/reward of 1:2.
I wonder if anyone other than myself took advantage of this setup today?

October 23, 2023We had seen this setup before the great surge of October 23, 2023, coinciding with data indicating that the Fed’s plan to curb inflation might be working. In September, we would then expect a rate cut.
Technically speaking, we have a Flag

TQQQ: over bought, wait for the negative divergence.Hello,
TQQQ is over bought with RSI above 80.
But not yet done with rally.
Look for the Negative divergence in RSI for shorting.
Tech is in super bull phase, be careful with puts/shorts.
Let's see if it can come down to fill those gaps.
Happy trading

$TQQQ heading into FOMC, earnings, electionVery important week for technicals. Tech/ AI has to either bounce here to determine bullish continuation; or crack under for bearish continuation. I personally prefer to day trade & swing trade the leveraged NASDAQ:TQQQ instead of NASDAQ:QQQ ; it has a cleaner pattern, and often better option contracts, imo.

TQQQ LEVELS FOR WEEK OF 7/29/24Trying to keep this as simple as possible.
Once price breaks outside of the Blue range, watch for possible retest of broken level and be ready to long or short into the green ranges.
Price may exceed green range targets, but it’s at least a strong help to make profit.

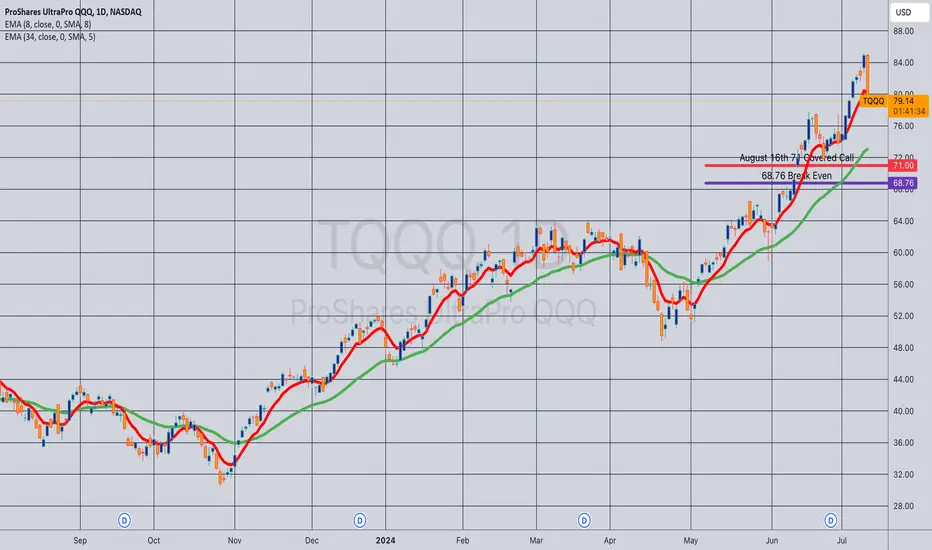
Opening (IRA): TQQQ August 16th 71 Covered Call... for a 68.76 debit.
Comments:
Buying stock and selling a -75 delta call against to emulate the delta metrics of a 25 delta short put with the built-in defense of the short call. As usual, this only makes sense in a cash secured environment where you don't get much BP relief going with the short put over the covered call; on margin -- stick with the short put.
Metrics:
Buying Power Effect/Break Even: 68.76/share
Max Profit: 2.24/contract
ROC at Max: 3.26%
50% Max: 1.12/contract
ROC at 50% Max: 1.63%
Will generally look to take profit at 50%, roll out the short call on side or break even test. (It's entirely possible that I will regret this trade later).
Opening (IRA): TQQQ July 19th 58 Monied Covered Call... for a 55.95 debit.
Comments: Going monied here, selling the -75 call against stock to emulate a 25 delta short put metrics while having built-in intraexpiry defense via the short call. More patient people will probably wait for weakness ... .
I'll generally look to roll out the short call on test or at 50% max/take profit on the entire setup as a unit at 50% of max.
Metrics:
Buying Power Effect/Break Even: 55.95
Max Profit: 2.05 ($205)
ROC at Max: 3.66%
ROC at 50% Max: 1.83%

Opening (IRA): TQQQ July 19th 53 Short Put... for a 1.77 credit.
Comments: Adding a short put element to my TQQQ covered call on weakness.

Opening (IRA): TQQQ June 28th 53 Monied Covered Call... for a 51.52 debit.
Comments: Re-upping in the June 28th expiry with a monied covered call, as there is no July yet. Selling the -75 delta call against a one lot to emulate the delta metrics of a 25 delta short put to have built-in defense via the short call and to take advantage of call side IV skew.
Metrics:
Buying Power Effect/Break Even: 51.52
Max Profit: 1.48
ROC at Max: 2.87%
ROC at 50% Max: 1.44%
Will generally look to take profit on the entire setup at 50% max.

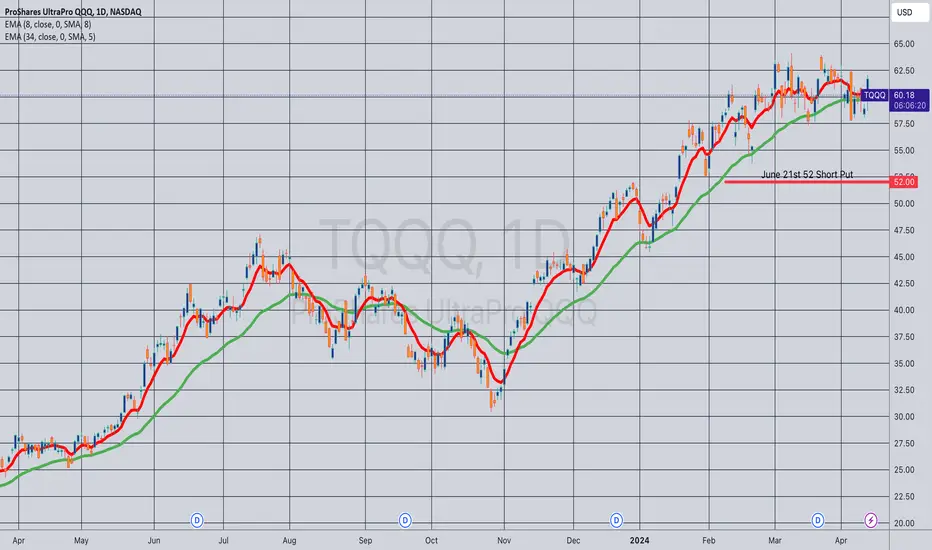
Opening (IRA): TQQQ June 21st 52 Short Put... for a 2.49 credit.
Comments: Adding to my TQQQ position on weakness ... . This is a bit longer-dated than I like to go with shorter duration premium selling, which I like to keep in that 45 DTE wheelhouse, but May has now only 35 days in it, and I like to stick to monthlies in all but the most options liquid underlyings.
Will generally look to take profit at 50% max. I'm fine with being assigned, then proceeding to sell call against if that occurs.
Metrics:
BPE/Break Even: 49.51
Max Profit: 2.49 ($249)
ROC at Max Profit: 5.03%
ROC at 50% Max: 2.51%
Delta/Theta: 24.36/3.37
Opened (IRA): TQQQ May 17th 55 Monied Covered CallBought a one lot of shares and sold an in-the-money -75 delta call to emulate a 25 delta short put to take advantage of call IV skew and to have built-in pro via the short call.
Metrics:
Break Even/Cost Basis in Shares: 52.71
Max Profit: 2.29 ($229)
ROC %-age at Max: 4.34%
ROC %-age at 50% Max: 2.17%
Will generally look to take profit at 50% max, add at intervals at a strike/cost basis better than what I currently have on should weakness present itself.

TQQQ 6/26/2023Keeping it simple
TQQQ Multi-time frame analysis
Daily chart – Long term
Pretty clean straight forward chart. In this one we can see the different stages of the market.
After topping out in Aug. ’18, price entered a “sideways” market between Aug.’18 – May’20. The “sideways” market was deemed an Accumulation stage after price broke upwards and entered Uptrend.
In May’20, price entered its Uptrend after breaking out of an Accumulation stage. During this time, you can see price respect the 200ema the whole way.
The Uptrend ran between May ’20 thru Nov.’21. After topping out Nov.’21, price starts to move sideways until it breaks below 200ema Jan.’22. This breakdown deemed the “sideways” market as a Distribution stage and confirms the start of the Downtrend.
Price has been in a Downtrend since and continues to make lower highs and lower lows. Facts that can’t be argued.
The price slide continued until it reached the breakout point of May’20. At this level it found support and bounced breaking above the 200ema and breaking above resistance and previous lower high.
Does this mean the Downtrend is over? Absolutely not. Why? This is the 1st time the previous lower high has been tested.
I will now look at some indicators to provide further confirmation.
The Stochastic indicator - has been Overbought for a while and it’s coming down while being at a resistance level. Bearish.
The MACD indicator - is crossing below its signal while price is at a resistance level. Bearish
Price rejection/ false breakout – Price was above the previous lower high price(Resistance) but has now fallen below it. This is very bearish as price is rejecting higher prices.
So currently we have the following: Downtrend + Oversold stochastic + Macd under signal + Price rejection
This equals to a high probability short trade. I will zoom into 15min chart for entry.
15min chart – Short term
Here we can get a closer look at what’s going on short term.
Price has been on an Uptrend (respecting 200ema) since May 5, ’23 and topped out June 15th 2023.
Here we can see the “Price rejection” we saw on the Daily chart and its a Head and Shoulders reversal pattern in the 15min chart!
As you can see, the neckline has been broken to confirm the Head and Shoulders reversal pattern.
Entering trade short.
Entry: 37.30
Stop loss: 41.05, -10.05%
Target #1: 27.70, +25.75%, 2.56 RR ratio
Target #2: 17.67, +52.63%, 5.23 RR ratio

TQQQ Tech 3X levarged ETF LONGOn this 15 minute chart, TQQQ is in an anchored VWAP band and volume profile breakout.
Near to the end of the regular market, the RSI indicator ran from deep oversold. After hours,
NVDA reported a sizable earnings beat. The AI machine learning and backtesting indicator
forecasts and uptrend continuation. I will get call options targeting $58 for Friday's expiration.
This is a risky play, price trend could reverse and there could be no time left to recover from
that reversal. The rewards for the trade going right could easily exceed 100%.

TQQQ - Cup awaiting Handle ?TQQQ on a weekly chart in 2021 ascended into a falling wedge. As part of the falling wedge,
it started the downside initial part of a cup and handle pattern. The reversal occurred 11
months ago with the upside completion of the cup back to 57.5 In the typical cup and handle,
the handle then forms in a 50% retracement of the height of the cup. the cup height measures
44.5 over a period of about 9 months. Notably relative volumes peaked at the bottom of the
pattern. Once the retracement is complete, bullish continuation should occur to the extent of
the height of the cup above the lip. That is to say an uptrend from 57.5 adding 44.5 to get to
102 more or less. But first the retracement and reversal must occur.
Accordingly, if this is an incomplete cup and handle, it forecasts a retracement of 44.5 divided
by 2 or to about 38 as shown by the Fib retracement tool. After that price must reverse
then overcome the resistance of the lip of the cup ( 57.5) and continue to 102.
Overall, this forecasts that a bearish crash is in store for TQQQ ( as well as QQQ from which
it is leveraged). Time will tell if this pattern has given an accurate forecast. In the meanwhile,
I will watch for signs of QQQ topping out on the weekly time frame after the same signs on
lower time frames. The alternative view is that TQQQ is building an even bigger cup
right now with the lip at about 88 when the price had a high pivot down on November 22, 2021.
So, do you see a bigger or smaller cup pattern or none at all?

TQQQ Bullish till its Not!The markets have given us some clear direction over the last few months, albeit we are at quite high levels and I would expect a pullback at some point.
There are 2 important clues here that are clearly visible on the chart.
The first is a continuous strong move up as illustrated in the channel. We can clearly see the supply and demand zones flipping once price is able to test important support and resistance.
The second is a pullback coming into the lower end of the channel, as well as the s/r flip from the previous range.
We are clearly still in an overall bull market, so it would be a terrible place to short below the lows, for the time being.
Until additional data points to lower prices, my bias will have to remain long. A break of market structure would change my bias and I will update my bias from there.

Opening (IRA): TQQQ April 19th 52 Short Put... for a 1.54 credit.
Comments: Adding a short put component to my TQQQ covered call (See Post Below) here on weakness.
Metrics:
Break Even/Buying Power Effect/Resulting Cost Basis In Stock: 50.46
Max Profit: 1.53/$153
ROC at Max: 3.03%
ROC at 50% Max: 1.52%
Will generally look to take profit on the covered call component at 50% max and the short put component at 50% max.

Opening (IRA): TQQQ April 19th 53 Monied Covered Call... for a 50.93 debit.
Comments: Selling the -75 delta strike against a one lot to emulate a 25 delta short put with built-in defense via the short call.
The call IV skew that I was looking to take advantage of before has evaporated somewhat, with the same strike short put paying about the same (1.94) as the max profit potential of this setup. Since I'm doing this in a cash secured environment, I don't get much BP relief over doing the monied versus the short put, so am really doing this setup for its "built-in defense" that I don't have to add in later, as I would should I want to defend a short put.
Will generally look to take profit on the entire setup at 50% max, look to roll out the short call at 50% max, and add at intervals, assuming I can get in at lower risk strikes.
Metrics:
Cost Basis/BPE/Break Even: 50.93
Max Profit: 2.07
ROC at Max: 4.06%
ROC at 50% Max: 2.03%

Sell QQQI bought TQQQ PUTs yesterday and today to play the QQQ sale.
On March 1, we reached a new high.
Since October 26, 2023, TQQQ has doubled, a blast seems to have arrived.
RISK MANAGEMENT
Initial target 1% of my capital as short selling is very difficult.
Transaction risk 0.5% of my capital as this is the only element I can control in trading. That's why I buy PUTS.
Multiples R forecast 2.05R but the market will decide!

You can't make this stuff up.You seriously can't make this stuff up. Whatever happens in November--whoever wins the election, unless the country literally falls apart (and even then, who can say this would end?)--A presidential election is always followed by a sense of certainty for the next 4 years, massive spending, and massive money printing. What else can we say.
Not financial advice. Not a bet, not a gamble, just an observation about history rhyming.

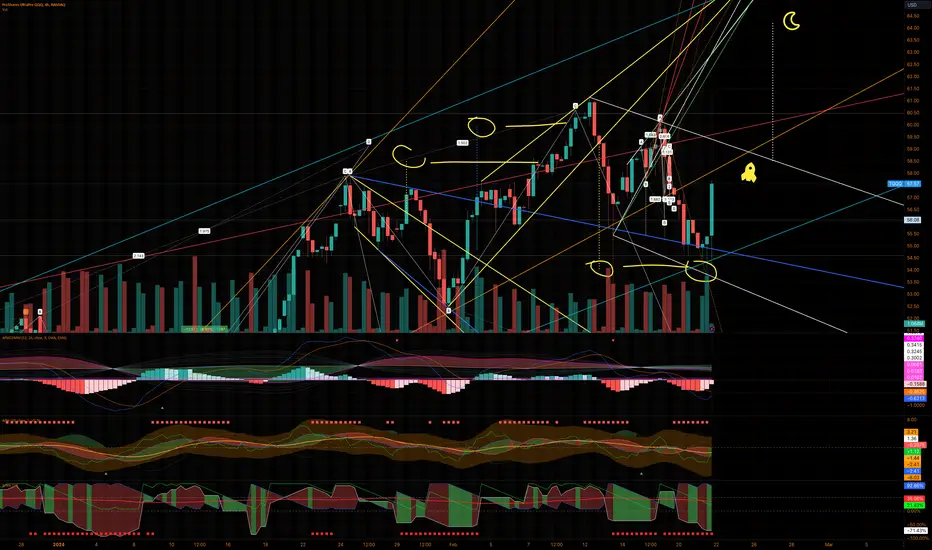
TQQQ Technical Analysis - Breakout and Key LevelsTechnical Breakout:
On November 13, 2023, NASDAQ:TQQQ experienced a significant structural shift with the breach of the $40 resistance level. The subsequent bull run in the tech sector propelled NASDAQ:TQQQ to a peak of $61.22 on February 12, 2024.
Fibonacci Retracement:
After reaching the peak of $61.22 on February 12, 2024, NASDAQ:TQQQ made an attempt to pull back, targeting the 0.618 Fibonacci level at $53.18. However, the retracement was not sustained, and NASDAQ:TQQQ returned to the previous high of $61.22 on February 23rd.
Current Situation:
As we await the market open on Monday, NASDAQ:TQQQ stands at a crucial juncture following the recent retest of $61.22.
RSI Divergence:
Since January 24th, we've observed RSI divergence, indicating a discrepancy between the price action and the strength of the trend. This could be a crucial signal, suggesting a potential shift in momentum that traders should closely monitor.
Upcoming Events :
This week brings important economic indicators:
Monday: Japan Inflation Rate
Tuesday: GfK Consumer Confidence and USA Durable Goods Orders
Wednesday: USA GDP
Thursday: USA PCE and Personal Spending
Friday: ISM Manufacturing
Market Expectations:
Anticipations are focused on the USA GDP, expected to perform worse than forecasted . This could influence market sentiment and potentially impact NASDAQ:TQQQ 's performance.
Forecast:
Given the current technical setup, RSI divergence and the upcoming economic events, there is a likelihood that NASDAQ:TQQQ could move towards the 0.5 Fibonacci level of $50.69 by Friday, March 1st. Traders should closely monitor developments and be prepared for potential volatility.
Disclaimer: This analysis is for informational purposes only and does not constitute financial advice. Traders should conduct their own research and consider risk factors before making any investment decisions.

Opening (IRA): TQQQ April 19th 50 Monied Covered Call... for a 47.75 debit.
Comments: Dabbling a smidge in the leveraged ETF due to its high IV (56.3% 30-day).
Selling the -75 delta call against a one lot to emulate a 25 delta short put, but with "built-in" defense via the short call, which can be rolled down, out, or down and out to reduce cost basis and setup break even.
As usual with the sort of thing, will look to add at intervals, assuming I can get into setups that have a cost basis lower than this starter position.
Metrics:
BPE/Break Even: 47.75/share
Max Profit: 2.25 ($2.25)
ROC %-age at Max/50% Max: 4.71%/2.36%

it's a new dawn, it's a new day...At least these days there will be a new high in NASDAQ:TQQQ thanks to AI and the outstanding results from $NVDA.
This new bull flag will take ud to 64.20 level.