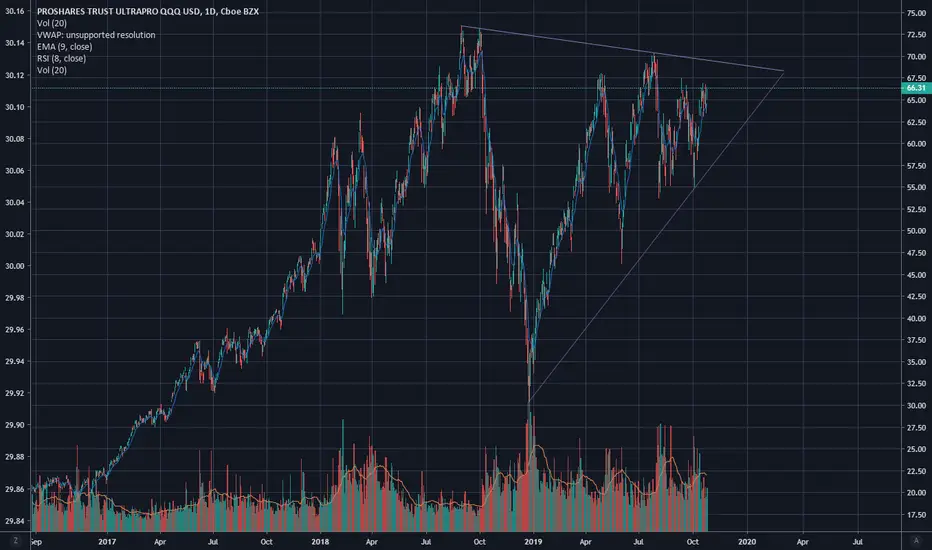
TQQQ: On its way to test next cloud support levels :73.10/61.60!TQQQ: On its way to test next cloud support levels :73.10/61.60! TQQQ is dow more than 30% since the sell signal!
TQQQ trade ideas

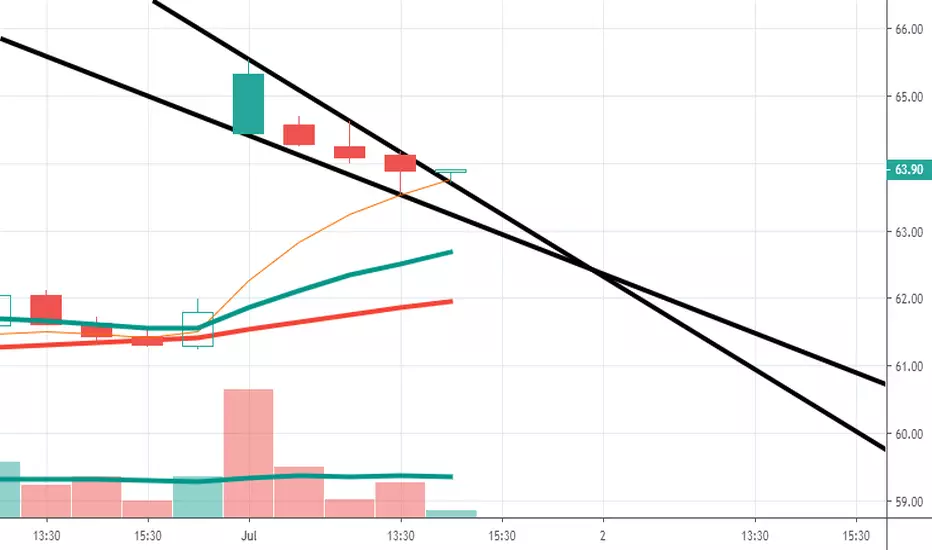
TQQQ - Go long for the bounceMy 50DMA short script (still on the process of backtesting) worked. After the price sat on the 50DMA, it just broke down and now sitting on the 78DMA.
Maybe I can go long on current market orders at 89.15. Stop below the lows of the two bearish candle of 87.15. Target price around 105 levels just to close the gap. If price continues to slide down, I can re-enter at the midrange, 79.86, and still have a target of back filling the gap to 105.

Call me doctor QMight sneak into a position here.
3x exposure to Nasdaq 100.
3 X the percentage of Ndx. -Remember that.
NDX Current percentage change : 0.44%
TQQQ Current percentage change: 1.15%


TRADE IDEA: TQQQ MARCH 20TH 80 MONIED CCMetrics:
Max Profit: $239
Max Loss: $7761 (assuming underlying goes to $0)
Buying Power Effect (Cash Secured): $7761
Cost Basis In Stock/Break Even: $77.61
Delta/Theta: 15.11/4.43
Notes: High implied volatility underlying (56%). I don't play leveraged products as a general matter, but will dip at the well with a conservative setup like this that has a high probability of profit (the platform says 87%), particularly if I'm not doing a ton of other things and have the buying power to deploy. The ROC isn't great in cash secured (239/7761 = 3.1%), but will take it if I can get it over a 60 day period of time.

A good time to buy shares of TQQQHello Traders and happy new year! Its a good time to buy shares of TQQQ. We are on a uptrend and as you can see on the graph we have an approach to support trend line. So I will buy shares at open price 88.61 (pre market price) and I will risk 5% to take 10% gain.


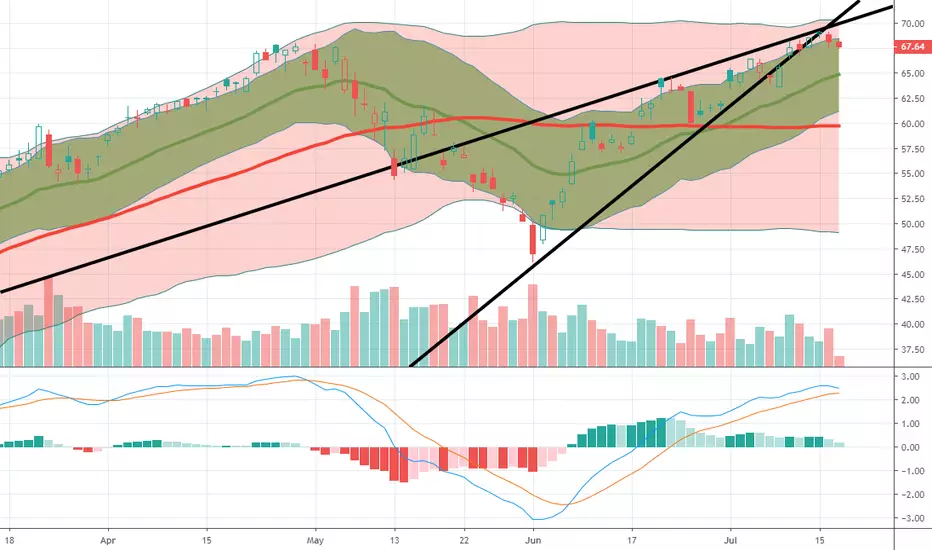
Testing new heights - TQQQ Going to Drop from this ResistanceBased on very simple technical analysis on the weekly chart, it's looking like TQQQ is about to ricochet off the top and likely end up crashing due to decreased trading volumes in the NASDAQ. Without the volume to artificially prop up the stock prices underlying the TQQQ ETF, I'm predicting a stunning downside movement. History shows us that when this topline resistance is hit, things go down. At the minimum, I'm predicting a 15% downside movement. If this week's economic data continues to point negative, I think it'll lock into a downward cycle.
This is not trading advice, but merely an observation and prediction.


Bearish Pattern coming in 9/20/19*** Disclaimer - This is my first published prediction. I've only been studying charts for about 4 months, so I wouldn't put much weight to this. Oh, this is not trading advice. Do not use this as a strategy. ***
With the political climate coupled to sound recession indicators alarming and a correction to the job growth data for the year, I think a Head and Shoulders pattern was just formed. The accuracy of a head and shoulder's pattern in predicting a bullish to bearish reversal is *supposedly* quite accurate. With the trading for the week closed out for the day, this loss would be a confirmation of a reversal for the right shoulder (also making it an evening star pattern).
I can foresee variability in the pattern due to artificial stimuli (tweets) boosting the market if occurring in tandem in the latter part of next week.
Hope no one loses their revenue streams at a time when working for a living is no longer an option.
Best wishes.
M

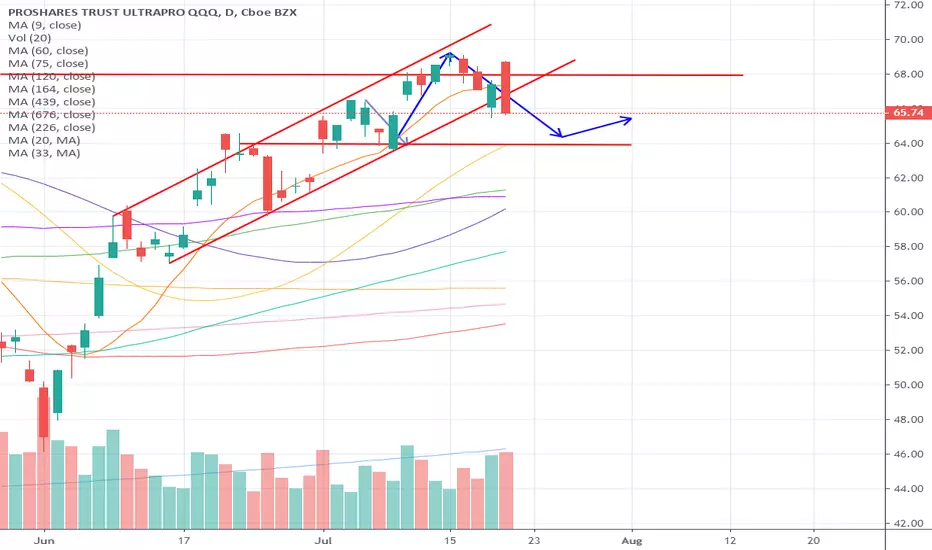
Just Keep Swinging$TQQQ is in an obvious swing pattern. Good for buying and selling options in high volume. Highly predictable until it eventually breaks out of this pattern; but for now, make some money on it.

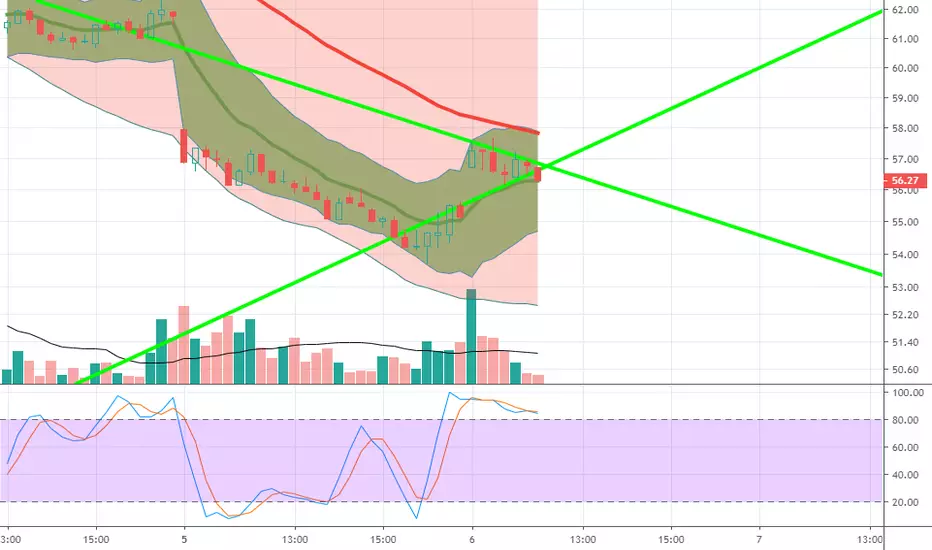
TQQQ 15m chart double bottom and upside divergence on MACDTQQQ 15m chart double bottom and upside divergence on MACD. Quick trade I usually trade higher timeframes. Bought the AUg 9, 63 calls for 1.40

Daily TQQQ stock price trend forecast analysis19-JUL
Investing position: In Rising section of high profit & low risk so far. But it would be in falling section tomorrow
S&D strength Trend: In the midst of an adjustment trend of downward direction box pattern price flow marked by limited rises and downward fluctuations.
Today's S&D strength Flow: Supply-Demand strength has changed from a weak selling flow to a strengthening selling flow again.
read more: www.pretiming.com
Forecast D+1 Candlestick Color : RED Candlestick
%D+1 Range forecast: 1.1% (HIGH) ~ -1.5% (LOW), -0.2% (CLOSE)
%AVG in case of rising: 2.8% (HIGH) ~ -0.8% (LOW), 2.1% (CLOSE)
%AVG in case of falling:
Daily TQQQ stock price trend forecasts analysis.12-JUL NASDAQ:TQQQ
Investing position: In Rising section of high profit & low risk
S&D strength Trend: In the midst of an upward trend of strong upward momentum price flow marked by the temporary falls and strong rises.
Today's S&D strength Flow: Supply-Demand(S&D) strength flow appropriate to the current trend.
read more: www.pretiming.com
Forecast D+1 Candlestick Color : GREEN Candlestick
%D+1 Range forecast: 4.4% (HIGH) ~ 1.3% (LOW), 3.2% (CLOSE)
%AVG in case of rising: 2.7% (HIGH) ~ -0.7% (LOW), 2.0% (CLOSE)
%AVG in case of falling: 0.8% (HIGH) ~ -2.8% (LOW), -1.3% (CLOSE)


volume confirming the flagflag on the play. volume confirming. powell did a decent job very interesting mentionings on policy ahead
