What do y'all suggest for swing buying hereThis is really a question... But I can't post due to lack of REP
TQQQ trade ideas


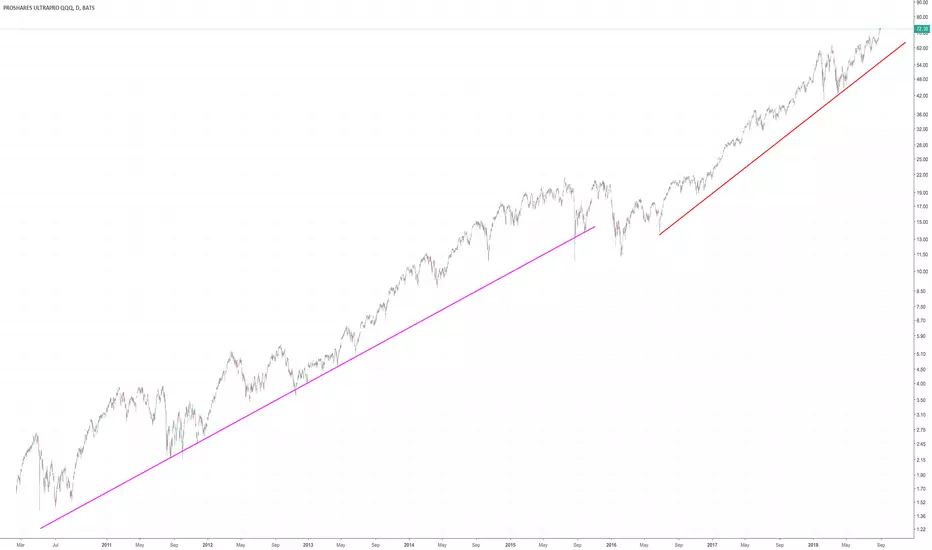
TQQQ (US tech Triple leveraged ETF)- Healthy predicable UpTrendPink UpTrend Line- 2009-2015.
2015- Sideways trading.
Red UpTrend Line 2016-Present day.
Oh the virtue of leveraged ETF during a bull market!! Nasdaq100 (NDX) Vs ROM (Double leveraged US tech ETF) Vs TQQQ (Triple Leveraged US Tech ETF).
To all the naysayers.. that leveraged ETFs don't track their underlying index by the amount they're leveraged to. Look at the following long term chart. In a bull market, they more than adequately do!!
NDX- x3 return since march 2010
ROM- x8 returns since march 2010
TQQQ- x33 returns since march 2010


"Ball" market! Some creative wealthy institutions created a "BALLs and PENNIS" pattern :D, which is about to ejaculate in some direction.


AAPL's earning call will determine the direction of XLK.It might be a good time to have a option spread.

Normalized RSI on Leveraged Index Fund shows dip - Swing TradeNasdaq 100 is looking oversold after a bad week for tech. However, after a big selloff the RSI over multiple time frames shows oversold levels. On top of being below the standard 30 level, the RSI dips below the lower adjusted (50 period, 2.1 standard deviations) bollinger band for a more accurate reading of oversold. Over the past 6-months, the combination of the RSI dip below 30 and a dip below the lower band has been an excellent buy signal. Tech isn't going away anytime soon...

EW corrective wave after an impulsive wave. EW corrective wave after an impulsive wave. In the middle we have a nice head an should der formation. Monthly and weeks charts left a doji candle. No need to stand against the trend.


A Bearish Take on TQQQThis would seem crazy with how stubborn this market has been... but falling volume, a seemingly end-of-Elliot Wave-run, and the rising wedge at double resistance are foreboding to me.


Is TQQQ having a descending triangle on 15 minutes chart?TQQQ seems to be forming a descending triangle....more troubles ahead if it breaks down the bottom line. The good news is that macd is improving so is RSI.

bearish butterfuly on TQQQ daily chartThe only thing I don't like is that the daily RSI is way too overbought and it's due for a short term correction

15 minutes chart TQQQwe maybe in this triangle, looking more bearish than bullish for the next few days
longer trend, we may still be bullish but it's taking a break right now.

would this be a possible H&S? I see a left shoulder, we are possibly at the head now using 4 hour chart


