SELL QQQI bought TQQQ PUTs today to play the QQQ sale.
Since 26 October 2023, the TQQQ has doubled , a breath seems to have arrived.
In addition, inflation was slightly higher than forecast today.
Finally, my technical indicators are all overbought.
TQQQ trade ideas

TQQQ Stock Chart Fibonacci Analysis 021724Trading Idea
1) Find a FIBO slingshot
2) Check FIBO 423.60% level
3) Touched 61.6/423.60%
Chart time frame : D
A) 15 min(1W-3M)
B) 1 hr(3M-6M)
C) 4 hr(6M-1year)
D) 1 day(1-3years)
Stock progress : D
A) Keep rising over 61.80% resistance
B) 61.80% resistance
C) Hit the bottom
D) Hit the top
Stocks rise as they rise from support and fall from resistance. Our goal is to find a low support point and enter. It can be referred to as buying at the pullback point. The pullback point can be found with a Fibonacci extension of 61.80%. This is a step to find entry level. 1) Find a triangle (Fibonacci Speed Fan Line) that connects the high (resistance) and low (support) points of the stock in progress, where it is continuously expressed as a Slingshot, 2) and create a Fibonacci extension level for the first rising wave from the start point of slingshot pattern.
When the current price goes over 61.80% level , that can be a good entry point, especially if the SMA 100 and 200 curves are gathered together at 61.80%, it is a very good entry point.
As a great help, tradingview provide these Fibonacci speed fan lines and extension levels with ease. So if you use the Fibonacci fan line, the extension level, and the SMA 100/200 curve well, you can find an entry point for the stock market. At least you have to enter at this low point to avoid trading failure, and if you are skilled at entering this low point, with fibonacci6180 technique, your reading skill to chart will be greatly improved.
If you want to do day trading, please set the time frame to 5 minutes or 15 minutes, and you will see many of the low point of rising stocks.
If want to prefer long term range trading, you can set the time frame to 1 hr or 1 day.

i dont like this setupI don't like this setup. The recent increases we've seen are just to reach the edge of a wedge, which is the classic movement before a fall, and the wedge has a descent of 25%.
so, be careful!

Bull or Bear?Today, the price broke above the support line of the ascending wedge at $54.30. This is a normal occurrence, and if the trend is bearish, we should anticipate a contraction in the coming week. The creation of this structure occurred before a symmetrical triangle, so that wedge is likely to be invalidated. I believe we are in for an interesting week with upcoming earnings calls, and the price is poised to break the entire structure, reaching new highs

Long TQQQUpper target of 52.92 in line with Bollinger band and a stop at the 55 period vwma offers a r/r roughly equal.

Trading a Choppy MarketPer request, someone asked to share my strategy and how / why I enter/exit trades.
I decided to be specific and applicable to the current market sentiment and discuss how I trade “choppy markets”.
My personal rules for trading choppy markets are:
1) No options, shares only
2) GTFI and GTFO ASAP
3) Only trade when there is a support or resistance respected
4) Trail once you are in decent profit!
Other points:
Some things I did not elaborate in the video but I think are important to touch on and one of the reasons I avoid options are, there is a huge decay that comes with ranging markets on options. I have went really ITM on options lately and I noticed the profits are equivalent to that of shares by the time the stock finally decides to move. Thus, I am risking quite a lot by the inherent decay in options vs just taking the raw share trade.
And I forgot to disclose in the video, but I half my position at the next resistance level. Unfortunately today we just traded between 2 support and resistance levels, so there was no really halving to be had, but that is the general rule of thumb. Halve the position at the next resistance and trail.
Leveraged Shares vs Options
Another point that I missed in the idea is, Leveraged ETFs, to which is the instrument I traded today and describe in this idea, do have a degree of decay associated with them. However, for daytraders this decay is not noticeable. It will only become noticeable and costly if you chose to hold these shares for greater than a 1 month period, as the decay tends to transition with the month turnover and on any massive move that goes against the share (for example, if you are long via UPRO or TQQQ and we see a 5% sell in 2 days, it will take UPRO and TQQQ longer to catch up to QQQ and SPY because that massive sell just cost the management firm a lot of money on that position (it’s a very simplistic way of looking at it and its much more complex than this, but for ease of explanation, I will use this haha).
To put it in perspective, here is TQQQ next to QQQ on the day:
You can see, there is no observable decay from the chop. If you bought in off open and held till mid day or EOD, you would be able to get out for flat or even a profit if you exited right at the new high.
Now if we look at an ITM 1 DTE option, here is the chart for today:
You can see that the option never retraced the daily high, despite QQQ doing so two times, in fact even breaking it at end of day. It is because the decay impacts options, especially shorter dated ones.
Now you can mitigate against this by going further out in expiries, but the cost of entry into those options increase and the risk of losses also increase, to the point of making your stop outs more costly than had you done a leveraged share position. As well, going further out in expiry doesn't stop the decay from chop, it simply 'mitigates it'. Chop will not destroy a leveraged share, the only two things that will destroy a leveraged share are
a) Time > 3 to 6 months, share depending and
b) Moves against the share > 3 % to 4% on the underlying in a short period of time (i.e. 1 to 2 days).
That said, the gains on options can be better than the gains on shares, its just it comes with a risk. So it is important to weigh your prerogatives, account size and risk tolerance when deciding on these things.
That also said, there are many other things to trade other than leveraged shares. For example, NYSE:AI is an affordable ticker for new share traders, NASDAQ:RIVN , as well as NASDAQ:LCID and if you are Canadian, BA Canadian leveraged shares, though I admit I haven't tried to short sell these yet so not sure if they are easy to borrow.
Concluding remarks
That concludes the idea and request. If you have any questions, as always, leave them below.
Safe trades everyone and take care!

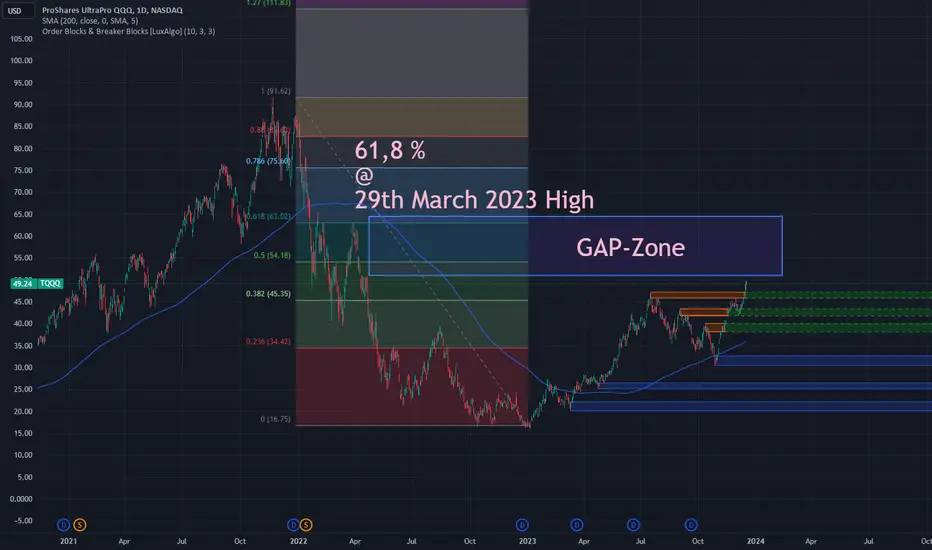
Bullish on TQQAs you can observe in the TQQ chart, the market is currently approaching a zone containing numerous open gaps.
The 61.8% retracement of the downtrend since November 2021 aligns precisely with the high on March 29, 2023.
We anticipate that the TQQ price will reach into this range, implying a potential increase of over 25% from today's quotation.
TQQQ - Leveraged QQQ rising after reversal LONGOn the highly reliable weekly chart, price was under the Ichimoku cloud since April 2022
putting in a couple of bear flags on the way down while first getting support two standard
deviations below the mean anchored VWAP and then one standard deviation showing
increasing strength finally crossing above the mean VWAP in May then with a retest and bounce
in late October while forming a bull flag. The breakout in the past month suggests another
leg up is underway with a potential of the same magnitude as the flagpole in the current
pattern. If accurate this could lead to a price of $68 by next July or 70% higher than
the present over 7 months. I will take a trade of 10 call options with a strike of $ 65.00 for
a July expiration. Each time the stock price rises by $5.00 I will close one of the options
yielding a tiered liquidation along the way to collect profit.

TQQQ long 35.25 add 34 sl 31 clsing basis . lets see if its in a mood to bounce , pretty oversold if you ask me but my view is for long term term so keep your losses small if wrong and be ready to look for bargains whenever it presents itself

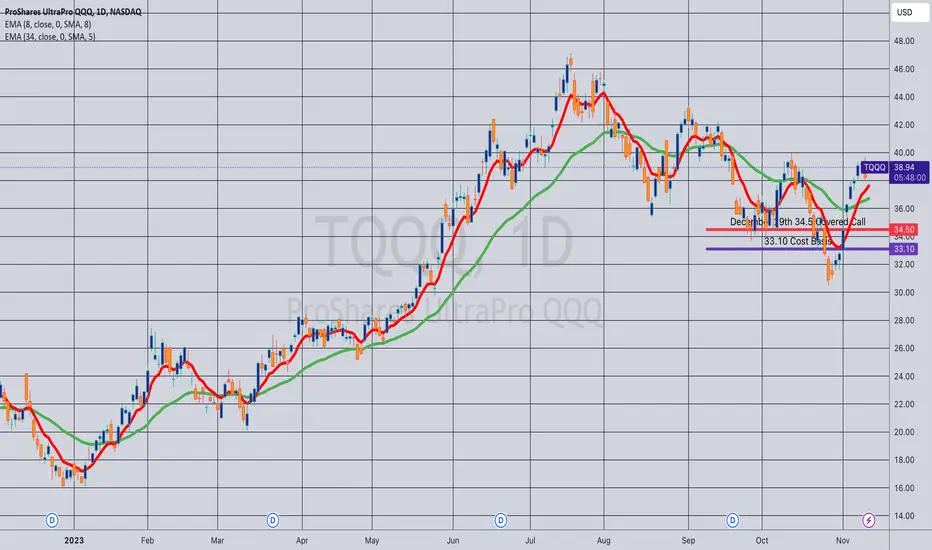
Opening (IRA): TQQQ December 29th 34.5 Covered Call... for a 33.04 debit.
Comments: Selling the monied -75 delta call against a one lot to potentially take advantage of early random call away/*assignment. 33.04 break even with a 1.46 ($146) max profit; 4.42% ROC/32.9% annualized as a function of buying power effect at max.
"Random" call away occurs when someone holding the 34.5 long call choses to exercise it before expiration, but I'll look to close at or near max (e.g., 34.45) to avoid the call away/assignment fee if I get the opportunity to do so.
On the flip side of the coin, I'll look to roll out the short call to reduce cost basis and my break even further if it chooses to crap its pants.
Opened (IRA): TQQQ December 22nd 35 Covered Call... for a 33.55 debit.
Comments: Selling the -75 delta call against ... .
Metrics:
Buying Power Effect/Share Price Break Even: 33.55
Max Profit: 1.45
ROC %-age At Max As a Function of Buying Power Effect: 4.32%
ROC %-age at 50% of Max: 2.16%
Delta/Theta: 26.44/2.98
Here's why I'm doing this instead of selling a put at the delta equivalent strike (the +25): if you look at the 25 delta put in the same expiry at the 35, it's paying around 1.27 at the mid (i.e., $127 max). The delta equivalent covered call setup has a slightly better max payout at 1.45 ($145) probably due to a couple of things: (a) IV skew (it's slightly higher on the call side than on the put); and (c) call skew. Relatedly, the short put break even is 33.73 relative the 33.55 break even of the covered call setup.
I also wanted to see what the frequency of monied covered call random call away of shares was; most literature suggests early, random assignment is somewhat rare (around 7%) but there isn't much information out there in addition to that, such as when the highest likelihood of early exercise is (it's most likely when the extrinsic value in the call is de minimus) or how deeply monied the call is (which is related to how much extrinsic is left in the long call that the other person would be exercising; deeper in-the-money options have less extrinsic in them relative to less monied options of the same duration). This could naturally give the setup a slight edge over a short put, since an early exercise by a counter-party would result in max profit without having to wait until all the extrinsic has leaked out of the monied short call.

Opening (IRA): TQQQ December 15th 30 Short Put... for a 1.10 credit.
Comments: High IV. An engagement trade targeting the 16 delta (ish). Going small with this starter position, with an eye toward adding at intervals.

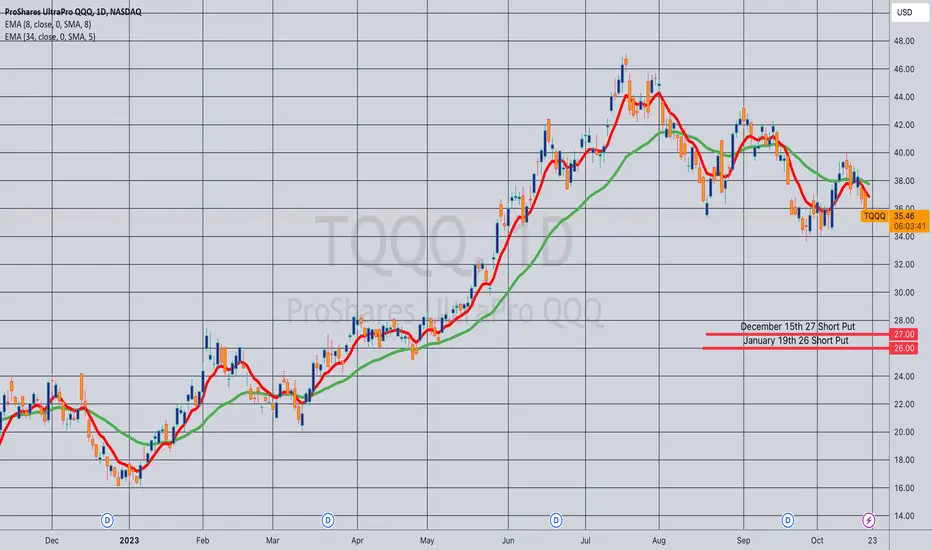
Opening (IRA): TQQQ January 19th 27 Short Put... for a 1.37 credit.
Comments: Targeting the 16 delta strike here, adding a rung out in January at a strike better than what I currently have on in December at the 30.

Opening (IRA): TQQQ Dec/Jan 27/26 Short PutsComments: Targeting the 16 delta here to emulate dollar cost averaging into the underlying at strikes slightly better than what I currently have on.
December 15th 27: 1.06 credit
January 19th 26: 1.41 credit
Opening (IRA): TQQQ Dec 15th/Jan 19th 24/23 Short PutsComments: Adding a couple rungs at strikes better than what I currently have on, targeting the 16 delta strike to emulate dollar cost averaging in.
December 15th 24: .81 credit
January 19th 23: 1.15 credit

Long TQQQ for a swing long @ 34.57 to 40Playing the daily stoch on bottom turning up
bouncing off support 200 day
I am going post this chart update everyday and how I will play that
stoch to the top and be ready short.

TQQQ swing using DPO 63
Select DPO 63 on TQQQ
Price in 1 dollar levels on right side
DPO levels on left side
Max Pain Max Ex OTM 40 calls at highest OI
Trade chart TA down above the 0 line
Trade chart TA up below the 0 line
Sell OTM calls above the 0 line
maximum-pain.com

TQQQ Bullish long termBuying now and taking profit at point "1".
It could go to point "1.1" else will retest point 2 and go to 3.

Textbook Bearish Butterfly Really nice example of a potential butterfly correction pattern.
D leg forming with ABCD inside of it.
Super parabolic into the PRZ.
Classic bear engulfing candles in the PRZ.
Usually when the harmonic is working here this slams really hard off the retest.

Creating MillionairesWell, some would call me crazy. But that's my long term view:
TQQQ made 200x since inception in February 2010 until his top in November 2021.
Now, in my opinion, we are in the middle of a Bear Market.
My expectation is that this Bear Market will last till December 22 until June 23.
After that the next Bull market should start.
My expectation for the Nasdaq 100 is to trade around 47.500 Points after this 10 Year Bull Market, which would take the TQQQ to around 1000.
This would equal a 100x from the Bear Market lows, which I expect around 10.
Of course no one can predict the future but I would also be happy with just 50x in 10 Years :D
And I really think that this is a possible scenario.
So here is my plan:
in December 2022 i will start investing all of my money into TQQQ.
For the next 5 years i will put everything into TQQQ too.
AND finally in 2034 I'm hopefully a multimillionaire.
See you guys in 2034 :D
(not a financial advise)

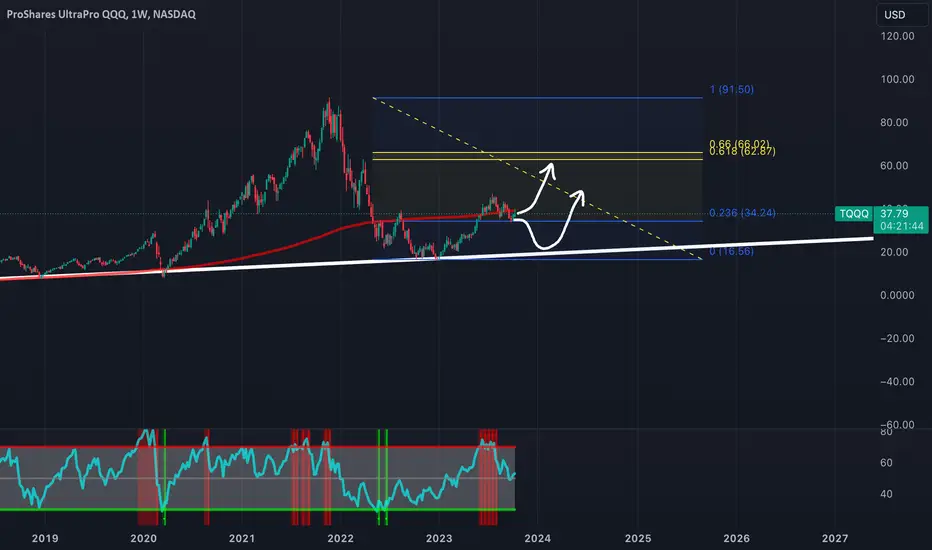
TQQQ Weekly Big PictureIm a little bit torn in the potential outcome of the market for the next few months. There are a few major considerations that I have when viewing differences in certain charts that almost contradict some of the ideas I may have for upcoming trades.
One thing at the back of my mind has me thinking that the bottom of the market has not been seen just yet, and we will likely retest the pre - covid level on the SPY / SPX before moving higher.
However, if we take a look at charts such as TQQQ and SQQQ, we can see that these ETF's have already seen a massive collapse and broken through pre-covid levels, inevitably finding support at a weekly trend line before making its way back up while respecting current fib levels.
Additionally, SQQQ has seen the lowest price to date without the market reaching an all time high. Are these potentially giving us a hint to where the market may move?
On the long term, I am leaning more bullish unless we see some kind of Black Swan event that will trigger a fast flush , and potentially even enough to change the course of the FED policy before we see the larger move for the next business cycle.
The Day Ahead: TQQQ, GDXJ, USO, GDX, FXI Premium SellingIt's Friday ... the 13th. Here's what's shakin' in exchange-traded fund premium selling ... .
Top 5 Options Liquid ETF's Ranked by 30-Day IV:
TQQQ 22.9 IVR/60.4 IV
GDXJ 23.6/38.9
USO 46.4/38.8
GDX 26.0/33.6
FXI 14.8/31.4
Ideally, you want to have IVR at >50 and IV at >35% in ETF premium-selling land, but you can't have everything in this market ... .
Broad Market Shortest Duration <16 Delta Strike Paying 1% of the Strike Price In Credit:
IWM, the January 19th 151, paying 1.58 at the mid (14 delta)
QQQ, the January 19th 325, paying 3.44 at the mid (15 delta)
SPY, the February 16th 385, paying 3.93 at the mid (15 delta)
Me, Personally
Currently, I still have quite a bit of broad market on in fourth quarter expiries, with the majority being in the December monthly and the end-of-quarter December 29th. (I have one IWM straggler on in the November monthly). I've begun to deploy out a smidge into the 2024 first quarter), but may just sit on my hands this week depending on whether I can get in at strikes better than what I currently have on.
Because of that, I may dabble small with TQQQ as an engagement trade (and to see what all the fuss is about). Pictured here is a 16 delta short put at the 30 strike in the December 15th monthly paying 1.01 at the mid which I'll do as a starter position and then work it from there as I wait on my other positions.
I also already have a GDXJ covered call on (See Post Below), but may add a short put to give me a little extra sumthin' sumthin' on that play.

Understanding Long-Term SPX500 & QQQ Cycle PhasesMy continued effort to share my research, experience, and expectations with the TradingView community has allowed me the freedom to create forward-looking content to help traders/investors understand the real risks/opportunities going forward.
If my research is correct, then next 5+ years will be incredibly difficult for skilled traders/investors. I don't believe the US markets will enter a real organic growth phase until after 2025 (possibly in 2026 or later).
There are many reasons for this extended contraction phase in the US/Global markets. Most importantly is a broad cycle phase related to societal changes. Secondly, we have a Sine-wave structure that confirms a contracting price phase needs to reach a base/equilibrium before it will be able to extend into an organic growth phase.
As a trader, investor, or just someone trying to protect your family, your home, your children, and more, you need to understand the value of PROTECTING CAPITAL before taking on foolish risks. That is exactly what I'm trying to help you manage and understand - where opportunities exist in the markets over the next 5 to 15+ years.
Watch this video, then click on my profile to watch some of my other TradingView videos.
We live in a world where what happened 3 weeks ago is almost forgotten. These cycle phases exist, continue to drive price setups/trends, and will continue.
Are you ready for what's next?
