Monday FOMC PatternThere will be two scalp opportunities in the morning based on historical Monday data that falls on FOMC week. Look for tight boxable action from 1115 to 130. Go take a long walk, read a book, call your mom. This action looks untradeable. A couple of scalping opportunities arise after 135 up til 200PM. With a small dip, and a resumed move into the close.
Some notes of caution. You should read these as potential swing times, but not read them as market direction. If market direction holds, great, but if market direction inverses, then uses these marked times as swing points. Cheers hope it helps!
TQQQ trade ideas

TQQQ LONG
These high demands have previously proven to be difficult to achieve, and it is highly probable that the market will experience a rebound from these levels, unless there are any significant shifts in fundamental news that could alter the market's current direction.

TQQQ sell to buy programI think we may have a good short trading opportunity to take price to 27 level and after that a long buy trade for long term will be opened and left

The Q.Watch to see if we got some confirmations
Clean breakout through 45. let her rip tater chip.
Could break down to 32.


$TQQQ TA for tomorrow since nvda beats their Er . we expected price to pull back to our pwl (40.42)and tunr it into a new support. our next rejection level should be the next 4 hr premium array (42.31) ..

$tqqq recap beautiful everything play out as expected. price even break our our premium array without a consolidation . very great day finish the day with a 67% return . greatefull.. see you guys tnext day for a new tqq TA

$tqqq ta 37.77 is where we really expected price to bounce back but 37.97 represents a double bottom on our 4hr charts that can also become our liquidity grab zone on a lower time frame .. mss (38.37) should be use as trim level or use stop on quote to move Sl up and let this run to our 1st Premium array (38.90) final target


Structure mapping with Elliott wave and SMC I hope this helps someone, i struggled a lot with structure mapping and it was one of the big reasons i was never profitable. I have learned a lot from this community and i feel like its my time to share something. If you wanna learn more in detail visit the "trading hub" on youtube. You wont regret it.
*Inducement = Pullback (Induces traders to buy in) Typically the first inducement is taken out which fakes out bullish traders in going long
*Engineered liquidity = Pullback (created within the previous structure). There is a lot more to this but its the simplest answer
*BOS= Break of structure
*CHOCH= Change of character
#1. Structure can only be created when the Inducement (Pull back) is taken out and price breaks to a new high (BOS). The lowest point in the structure now becomes your Choch (Change of Character)
#2. I typically see minor and major structures, the only difference is a major structure completely wipes out liquidity from the previous structure and typically fakes out traders going short because the choch was broken and the trend line. (Trend line liquidity) I see this a lot in Wave 3 or 5 in Elliott wave
Keep in mind:
*When a new structure is created the Choch moves with it. New structure = New choch.
*Minor structures are taken out quite often so be careful jumping into shorts. I typically wait for the major structure chochs to be taken out before changing trade directions. Fade the short term trend
#3 These are not structures, the reason they are not structures is because price took out the previous low but could not break to a new high. I see this typically in a blow off top and it typically means we are in the wave 5.
#4. Price passes the CHOCH of the major structure and it typically holds more weight vs the minor structures, Typically the A wave. When ENG LIQ (Pull back) is taken out and a new low is created a new bearish structure is created.

TQQQ strong selling pressure TQQQ managed to break structure, keep in mind this is a minor structure so for now shorting is your high probability trade but its temporary considering the major structure has not been broken.
Tqqq has support around $43
If we get a bounce tomorrow look for $43.8 to stop the momentum upward.
I think in order to get above this price we need a pre market gap up to see $46.50. If not i believe price will get rejected pretty hard
$45.20 doesn't pose a big threat to the bears, I believe if we get above $43.8 this level will get taken out

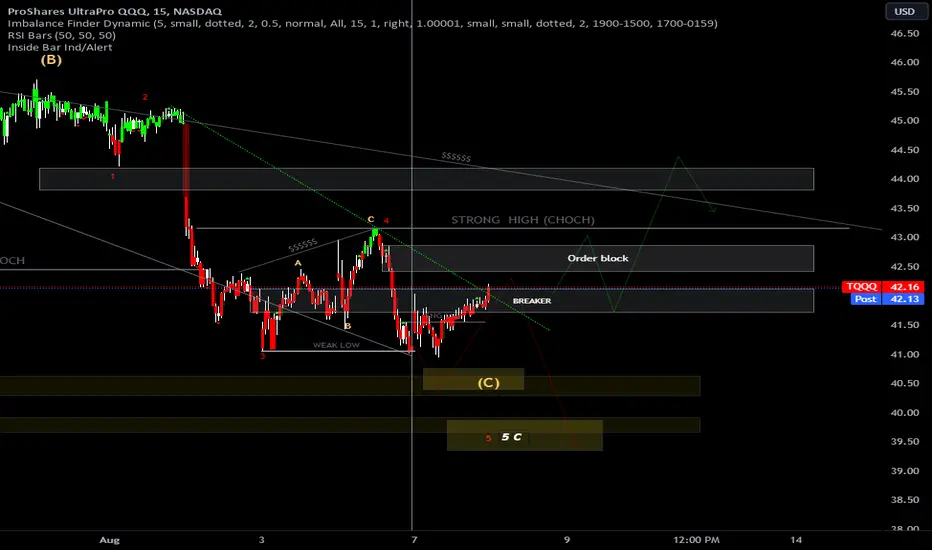
TQQQ• Seasonality PRE ELECTION YEARS AUG 7th-12th (Avg return +.35% )
• SMC
Long term market structure: Bullish
Short Term market structure: Bearish
Bullish order block: $40.43
*Posted this last night but just realized it was created under privet*
Bearish order block: $42.57 and $42.33
Breaker Block (Strong High): $41.92
BULLISH CHOCH: $45.70
BEARISH CHOCH :$41.04
IDM SWEEP @ $42.13
• Elliot wave: ABC ZIGZAG (Currently in a 5 wave move to the downside to complete C)
Beware call volumes for $44 $43 $42 are extremely high
Summary: Bears have taken over at the momment we had a-lot selling pressure last week so i wouldnt be surprised if we see a relief rally today or later this week. If we gap above the breaker block we could see price reach $42.93. If we dont gap above i believe we will see price drop to around $40.5 or $39.9.
Good luck god bless
Potential Swing Trade TQQQMarkets are being supported by some key levels, for now it seems like we have some juice to move if we can move above resistance. Target on SPY approx. 410 range.
TQQQ bearish setupSame breakout from bullish parabolic pattern, channel consolidation, then breakout from channel to the downside. Retest bottom of the channel (support becomes resistance) and from here, predicting a move to the downside.

tqqq update seasonality July 24th - Aug 3rd: -3.34% return
Elliott wave: Currently in a 5 wave correction, we either completed the wave 5 or we are currently in it. Expecting a rally either tomorrow or Wednesday to complete the B wave.
Structure: We just completed our first structure to the downside which tell's me there is now upside liquidity. We need to gap above $43.27 in order for longs to be in the equation. If we don't its gonna be hard for the bulls to take that level over.
If we don't gap above $43.27 its very possible we see new lows.
CHOCH @ $44.19
Look for support at the $42 and $41 level.
Short term: Down trend
Long Term: Uptrend
Stay blessed

TQQQ reversal shows early tech market recovery LONGOn the 15 minute chart TQQQ took a dive down through some relative volume voids
shown on the volume profile into a double bottom also showing a transition from
high relative selling volume into some decent buying volume . I can conclude that TQQQ
is in early reversal and will head the other direction through the same volume void which
could allow for a rapid ascent. While I made profit on SQQQ today, for tomorrow I
aspire to make money on TQQQ. I love volatility just as I loved yo-yos as a kid many years
ago. The concept of converting kinetic energy into potential energy has analogies in the
markets - coiling to store momentum and the triggering to unleash it. The chart shows
pertinent levels of the trade plan. As a bottom feeding grinder I am looking for 4% of range for
tomorrow .

TQQQ update Seasonality July 24th - Aug 3rd: -3.34% return
Elliott wave: Currently in a 5 wave correction, we either completed the wave 5 or we are currently in it. Expecting a rally either tomorrow or Tuesday to complete the B wave.
Structure: We just completed our first structure to the downside which tell's me there is now upside liquidity. If we break above $44.27 there is a good chance we see $46.50.
If we get rejected at $44.27 look for more downside to the $42- $41.30 for support
If we head higher tomorrow look for a gap up above $43.29 for a long position, if we dont gap above $43.29 odds are we are headed lower
Short term: Down trend
Long Term: Uptrend

TQQQTicker: Tqqq
• Seasonality PRE ELECTION YEARS July 28th – Aug 25th (Avg return -8.45% )
• SMC
Long term market structure: Bullish
Short Term market structure: Bullish
Bullish order block: $42-$43
Bearish order block: $45.41- $45.74
Breaker Block: $43.84 - $44.10
Imbalances: Upper $46.21 - $45.70 Lower $43.01- $44.59
Bearish CHOCH: $42.44
IDM sweep: yes @ $42.51
Next BOS: $45.72
• Elliot wave: ABC Flat correction
• Price Action
Support: $44.84 AND $43.89
Resistance: $46.57 AND $46.13
Summary: As for now nothing is screaming short besides stocks being overbought on multiple time frames, yes u can short here and get lucky and catch a good drop but that’s pretty much gambling, if you do it here you will do it on every pullback and not be so lucky, go with the trend.

TQQQ updateseasonality July 24th - Aug 3rd: -3.34% return
Elliott wave: Currently in a 5 wave correction, we either completed the wave 5 or we are currently in it. Expecting a rally either tomorrow or Wednesday to complete the B wave.
Structure: We just completed our first structure to the downside which tell's me there is now upside liquidity. We need to gap above $43.27 in order for longs to be in the equation. If we don't its gonna be hard for the bulls to take that level over.
If we don't gap above $43.27 its very possible we see new lows.
CHOCH @ $44.19
Look for support at the $42 and $41 level.
Short term: Down trend
Long Term: Uptrend
Stay blessed

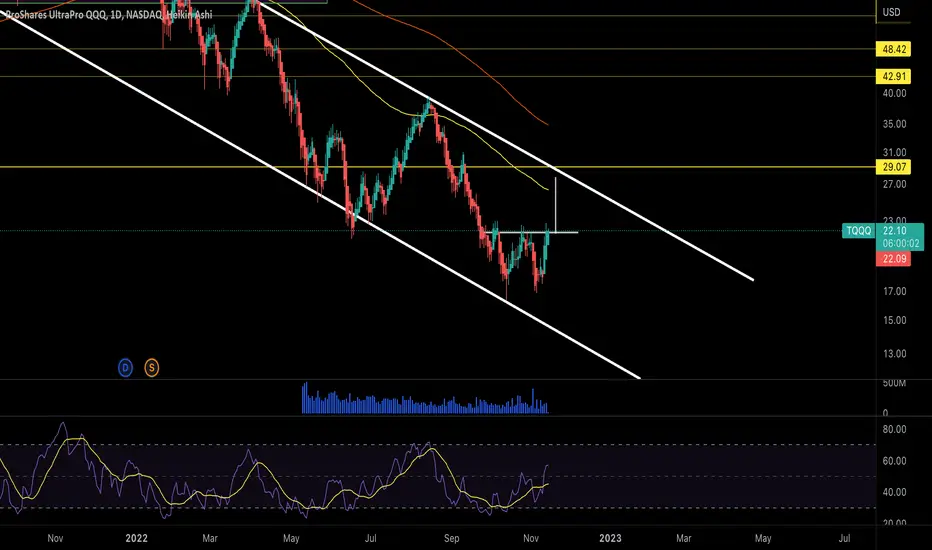
2023/4: Surfing TQQQ - Awaiting Entry eta end June
Technicals:
1. RSI has probably peaked
2. MACD has probably peaked
Fundamentals:
1. None
Analysis:
1. Awaiting downward move for potential June Entry

The TQQQ and BTC/USD CorrelationThe BTC/USD (Bitcoin to US Dollar) and TQQQ (ProShares UltraPro QQQ ETF) can sometimes show correlation, though it's important to note that these correlations can change over time and are influenced by a multitude of factors. There are several reasons why this correlation might occur:
1. Risk Appetite: Both Bitcoin and TQQQ are considered high-risk, high-reward investments. Bitcoin is a volatile asset class, and TQQQ is a leveraged ETF that aims to deliver three times the daily performance of the NASDAQ-100 Index. Therefore, when investors have a high appetite for risk (often in a bullish or 'risk-on' market environment), both Bitcoin and TQQQ could perform well. Conversely, in periods of risk aversion (bearish or 'risk-off' markets), they could both decline.
2. Technological Optimism: The NASDAQ-100 Index, which TQQQ aims to amplify, is heavily weighted towards technology and innovative companies. Bitcoin, as a decentralized digital currency, is often viewed as a vanguard of technological and financial innovation. Therefore, positive sentiment towards technology and innovation could drive both BTC and TQQQ higher.
3. Market Liquidity: In times of ample market liquidity, such as periods of low-interest rates or quantitative easing by central banks, risk assets like Bitcoin and leveraged ETFs like TQQQ can be attractive to investors looking for higher returns.
4. Speculative Trading: Both Bitcoin and TQQQ are popular among speculative traders, given their potential for significant price movements. This common trader interest could lead to similar trading patterns and thus correlations in price movements.
However, it's important to remember that while Bitcoin and TQQQ can show periods of correlation, they are fundamentally different assets with unique risk profiles. Bitcoin is a cryptocurrency that is often subject to regulatory news, technological developments in the blockchain space, and changes in sentiment towards digital assets. TQQQ, on the other hand, is tied to the performance of a specific equity index (NASDAQ-100), and its performance will be influenced by factors like corporate earnings, economic indicators, and changes in interest rates.
Investors should consider these differences, and the potential for correlation to change or even disappear, when building a diversified portfolio.

Tqqq pullbackDon't trade against the trend. Are we over extended? yes. But do what the chart is telling you not what you feel. So that being said these are buying areas.
Don't buy blindly switch to a lower time frame and look for either a v shape recovery or a descending channel with a breakout that take out the previous high.
Good luck

Shorted TQQQ @ 41.65 Look at the daily stoch turning over finally what a run qqq doing is this the end will see.
Look at the vol on buying getting less running into resistance lets
see we can continue down rally up make lower high
Stop @ 43.52
