TQQQ trade ideas

Short the NasdaqWas charting TQQQ so will just use this chart. I am -2% on a small SQQQ position but adding here. Arguably a double top. If it gets out of that channel possible violent drop I dont want to have to catch. 50% position, will add if we go up. Stops at acceptable loss. Not advise.

Nasdaq POP before dumpShort target from the falling wedge has been reached. TQQQ has been on a steady downtrend it may be time for some relief up to the CC around $20-$21.

TQQQ - Rising Trend Channel [MID TERM]🔹TQQQ has broken the rising trend up in the medium long term
🔹Broken up through resistance 39.
🔹Support at 39.
🔹Short-term momentum is positive with RSI above 70.
🔹Technically positive for medium-term long-term
Chart Pattern;
🔹DT - Double Top | BEARISH | 🔴
🔹DB - Double Bottom | BULLISH | 🟢
🔹HNS - Head & Shoulder | BEARISH | 🔴
🔹REC - Rectangle | 🔵
🔹iHNS - inverse head & Shoulder | BULLISH | 🟢
Verify it first and believe later.
WavePoint ❤️

Nasdaq Positioning. Haven't made an IDEA on Trading View in forever. Probably over a year somewhere.
But today I bring trading view a new idea to witness. And my participants to view my ideas in real-time.
So during this bear market, I wanted to accumulate an equity asset at the pits of the bear market bottom.
My research drew me into the product $TQQQ.
a Triple leverage Nasdaq instrument. I have used this instrument during the covid sell, buying the bottom at around 15-17.00 and holding long-term to nearly 100.00. I do believe that idea is on my page if you search for it.
Next, Market conditions have begun to shift tides. As much drama we have around our economy, there are some underlining changes, that could justify the potential projection of price for the Nasdaq for higher prices.
So since I started this position in Q4 of 22. It was to accumulate shares and Calls equivalence of 1,000 shares of $TQQQ.
Calls being 25 Strikes End Jan 2024 Leaps at 4.00 each or less.
And shares average price cost for me is about 22.75 with all the times I accumulated under and around 24-20.50
This will be the position I hold long-term for the year. Accumulate lows and ride highs and keep your average price as low as possible. While accumulating slowly and neatly on the best opportunities.
I will continuously update this idea. as time progresses.


TQQQ - Nasdaq based ETF - At 100% key zone!TQQQ - Nasdaq based leveraged ETF - TQQQ is at the 100% key zone from the discount zone! If there is a pullback, then we can do it all again, repeat? We are expecting the markets to recover over time and exceed the all-time highs just based on the history of the market. Time is the variable we cannot predict? When will price break the all-time high? 3 months? 6 months? 1 year? 2 years?

TQQQ - Rising Trend Channel [MID TERM]🔹TQQQ shows strong development within a rising trend channel in the medium long term.
🔹The price has risen strongly since the positive signal from the double bottom formation at the break through resistance at 23.69.
🔹The short term momentum of the stock is strongly positive, with RSI above 70.
🔹Overall assessed as technically slightly positive for the medium long term.
Chart Pattern;
🔹DT - Double Top | BEARISH | 🔴
🔹DB - Double Bottom | BULLISH | 🟢
🔹HNS - Head & Shoulder | BEARISH | 🔴
🔹REC - Rectangle | 🔵
🔹iHNS - inverse head & Shoulder | BULLISH | 🟢
Verify it first and believe later.
WavePoint ❤️


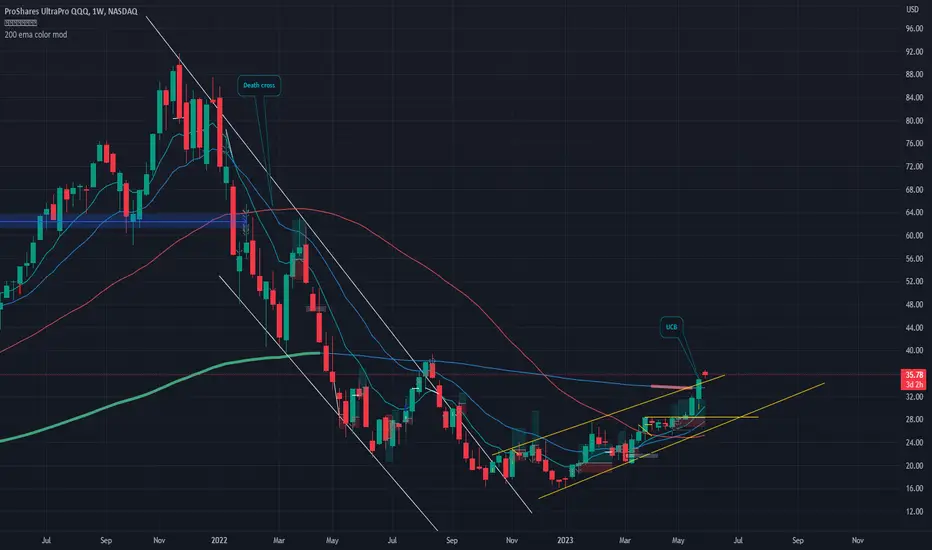
Market Notes : Rest Needed Last few sessions we have seen continuing strength and many names doing well but we started to become extended per my gut om the 25th of may and since than have grown more extended , I am long TQQQ, ELF , BRBR, WGMI , SMH and BOTZ and 3 of these names have recently put in what I refer to as UCB's or "upper channel breaks".
Typically there is a 75% chance with UCBs that we will see price re enter the channel and visit channels lower trend line within 5 bars on highest visible timeframe UCB is seen on , in this case it's the weekly , so there is good odds , statistically speaking here , that within a 5 week period we will revisit the channels lower trend line .
Having said that we are seeing a new bull market form and there is always the 25% chance that the UCB is successful , maybe it is a slightly higher probability at this time that the UCB works because it could be an earlier move in a larger theme up.
Besides all the UCB's we see happening on key groups and names , I also like to watch the percent from 10 ema vs price and usually since I have a dedicated strat for TQQQ I keep an eye out for 10% or greater distance from 10 ema to price and have come to expect pullbacks around this area or at least some consolidations ,yesterday we closed above this 10% threshold from ema getting us into the extended area and today we opened 12.9% above and have since declined back to the 10% area .
Even if the UCB holds Mr Market needs some sleep and rest , maybe a visit to the Scandinavian spa to steam out and have some hot cold treatments ♨️.
I am attaching some pics here of some of the UCBs occuring now I am watching and or long a few previously noted . I am personally fully de risked on many of them though with half of the positions open on SMH/BOTZ and 2/3rds on TQQQ. Although tempting to just take profits now , knowing the odds with UCBs my system is not set up for that so I am going to more or less not worry about the UCBs but I will expect and hope for some needed rest for things .
One other thing , I also track the net trading positions of IG traders and COT futures data and without going to deep into this part , I will say , in the past week we have seen a big change in sentiment and names or indices that were extremely net short since Nov 2022 have just switched to either 50/50 balance or some even net long , although SPY has held out ( net short ) . But huge shift there worth noting, the shorts were very helpful to get the market up but I think that since things are switching over closer to net long or 50/50 , that we might crowing to the long side now or starting to.
I am contrarian with these things so with the UCBs and the change in Net shorts closer to net long basis , I think this adds to probability of a reasonable pullback likely here . But make no mistake , we have come leaps and bounds since Oct 2022 and we are in a stage two uptrend , any pullback helps to distinguish names and groups with good RS and create good risk reward opportunities ( potentially) .

Easy trend, keep shortsqueezing the dumb americans! :)Easy trend, keep shortsqueezing the dumb americans! :)Easy trend, keep shortsqueezing the dumb americans! :)Easy trend, keep shortsqueezing the dumb americans! :)Easy trend, keep shortsqueezing the dumb americans! :)Easy trend, keep shortsqueezing the dumb americans! :)Easy trend, keep shortsqueezing the dumb americans! :)Easy trend, keep shortsqueezing the dumb americans! :)Easy trend, keep shortsqueezing the dumb americans! :)Easy trend, keep shortsqueezing the dumb americans! :)Easy trend, keep shortsqueezing the dumb americans! :)Easy trend, keep shortsqueezing the dumb americans! :)Easy trend, keep shortsqueezing the dumb americans! :)Easy trend, keep shortsqueezing the dumb americans! :)Easy trend, keep shortsqueezing the dumb americans! :)Easy trend, keep shortsqueezing the dumb americans! :)Easy trend, keep shortsqueezing the dumb americans! :)Easy trend, keep shortsqueezing the dumb americans! :)Easy trend, keep shortsqueezing the dumb americans! :)Easy trend, keep shortsqueezing the dumb americans! :)Easy trend, keep shortsqueezing the dumb americans! :)Easy trend, keep shortsqueezing the dumb americans! :)Easy trend, keep shortsqueezing the dumb americans! :)Easy trend, keep shortsqueezing the dumb americans! :)Easy trend, keep shortsqueezing the dumb americans! :)Easy trend, keep shortsqueezing the dumb americans! :)Easy trend, keep shortsqueezing the dumb americans! :)Easy trend, keep shortsqueezing the dumb americans! :)Easy trend, keep shortsqueezing the dumb americans! :)Easy trend, keep shortsqueezing the dumb americans! :)Easy trend, keep shortsqueezing the dumb americans! :)Easy trend, keep shortsqueezing the dumb americans! :)Easy trend, keep shortsqueezing the dumb americans! :)Easy trend, keep shortsqueezing the dumb americans! :)Easy trend, keep shortsqueezing the dumb americans! :)Easy trend, keep shortsqueezing the dumb americans! :)Easy trend, keep shortsqueezing the dumb americans! :)

QQQ - Awaiting the Exit on MACD downTechnicals:
1. RSI has already moved to overbought
2. MACD is peaking
Fundamentals:
1. USD Debt Ceiling Resolution
Strategy:
I will be exiting when:
MACD makes 2 days consecutive dips

TQQQ Waiting for price to react at the consolidate zone HKEX:25 -25.50... so I can go long. My Target buy is at $24.33... this area has a lot of reaction.
GT - VTN - Fibo.

TQQQ - Rising Trend Channel [MID TERM]- TQQQ has broken the ceiling of the falling trend in the medium long term, which indicates a slower initial falling rate.
- It also gave positive signal from the double bottom formation at the break up through the resistance at 23.69.
- Further rise to 30.60 or more is signaled.
- The stock has broken a resistance level in the short term and given a positive signal for the short-term trading range.
- The stock has marginally broken up through resistance at 27.60.
An established break predicts a further rise.
- Overall assessed as technically positive for the medium long term.
*EP: Enter Price, SL: Support, TP: Take Profit, CL: Cut Loss, TF: Time Frame, RST: Resistance, RTS: Resistance to be Support LT TP: Long Term Target Price
*Chart Pattern:
DT - Double Top | BEARISH | RED
DB - Double Bottom | BULLISH | GREEN
HNS - Head & Shoulder | BEARISH | RED
REC - Rectangle | BLUE
iHNS - inverse head & Shoulder | BULLISH | GREEN
Verify it first and believe later.
WavePoint ❤️

TQQQ Stock Chart Fibonacci Analysis 042623Trading Idea
1) Find a FIBO slingshot
2) Check FIBO 61.80% level
3) Entry Point > 25.6/61.80%

8%-12% Drop IncomingWill sell off into Early May.
Target 25 by end of next week, could see as low as 23 before this recovers after a grueling distribution phase this past week.
Drop starts now into close, then we will see a gap down tomorrow 4/21 and continuation down from there.

TQQQ - Resistance be Support [SHORT TERM]
- TQQQ has broken the floor of the rising trend channel in the short term, which indicates a weaker initial rising rate.
- TQQQ has broken up through resistance at 27. This predicts a further rise.
- TQQQ is assessed as technically positive for the short term.

TQQQ or QQQ swing tradingQQQ / TQQQ is in uptrend on 1 hour chart. I am watching this to pull back to BB Lower Band. Then it should close up with green candle. I am planning to BUY it here. Target price should be upper Band.

TQQQ Retracement for first half of AprilSimilar to the FNGU CTM 1.0 Technical Analysis, look for support at the $26 zone. Support line is broke, TQQQ could retrace back to $22.92. Could buy the inverse for short term trade below $26 and sell around $23. I'm long on TQQQ so looking to reup on buys in that area unless the 2nd line of support is broken. Paying attention to the MACD here for continued trend upward until TQQQ gets overheated.
Not financial advice.

Long SQQQ @ $32.50As we come to a crossroads between a banking crisis, debt crisis and other catastrophic financial and geo-political events going on, SQQQ has set a new yearly low. I have sold my TQQQ and will start accumulating SQQQ at this price.
Our CM_Williams_Vix_Fix Finds Market Bottoms indicator is signaling a heavy floor in this area.
We just broke up from underneath our Keltner Channel, which is a sign of a potential reversal.
With SQQQ's lowest low being around 28.00 there is only so much support under us, but I do believe this is a good time to accumulate.
Our momentum indicators are showing a slowed movement in SQQQ's price move downward.
While the markets are extremely bullish right now, what goes up must come down. I believe this large pump is all a facade and we're going to see a turning point soon.
Conversely TQQQ is double topping and momentum indicators are showing a slower movement in trading momentum and volume.
We'll check back in as soon as we see this play out!

Support Channels on TQQQ if support breaks todayThese are the weekly support channels if the market continues to fall after today's bad news.

$14,600 Profit on TQQQ Swing Trade, What to look for next week. A deep technical analysis as to why I took profit on my 8000 shares of TQQQ and some mistakes I made on my trade that I could of done better.
- Also what to look for on Monday, Monday is likely a buying the dip opportunity day for the next move up on SPY and QQQ, i explained what we should be looking for to be buying in again.
- the weekly higher low is set and i will be playing off of it
- bulls are still in a weekly uptrend and now we have to change 4h and daily trend back to the bulls.
