matching up zones and averagesusing this order flow/volume zone and volume weighted average strategy theres clearly still a bearish bias on the outlook for the nasdaq hourly. im guessing we come up to touch the resistance zone/averages and back down to do the same to lower levels.
TQQQ trade ideas

TQQQThis was a chart request ..
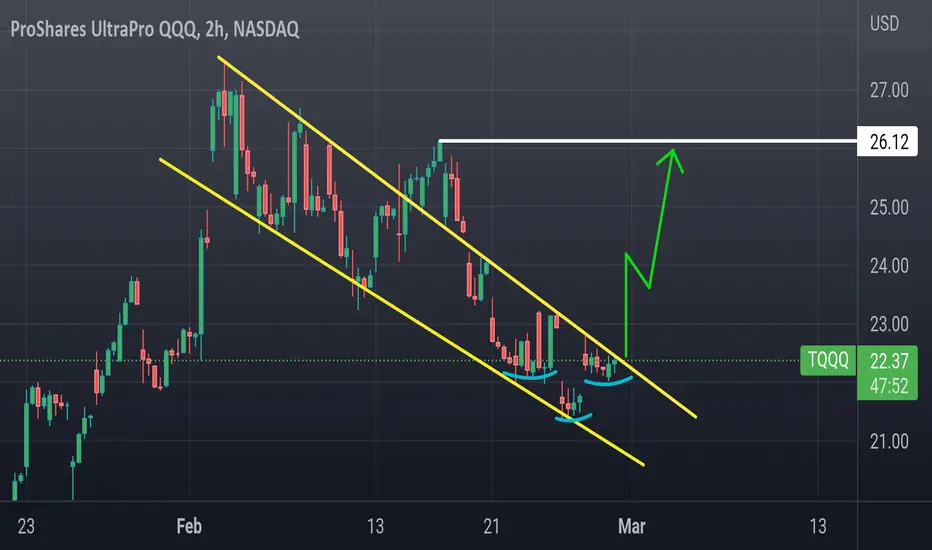
Tqqq resembles NQ with this large falling wedge and has A inverted H&S similar too QQQ.
Look for breakout tomorrow
TQQQ Stock Chart Fibonacci Analysis 022523 Trading Idea
1) Find a FIBO slingshot
2) Check FIBO 61.80% level
3) Entry Point > 21.8/61.80%

TQQQ Stock Chart Fibonacci Analysis 021623Trading Idea
1) Find a FIBO slingshot
2) Check FIBO 61.80% level
3) Entry Point > 12441/61.80%

Short TQQQNot looking to break out this week out of this trading channel. Likely to go down, then back up within this trading range. Could break down on any bad news, less likely to break up.

what would continuation toward contango look like?spot is having a time catching up with price, and this is one of my favorite derivatives. if the turnaround is going to continue to break out, and we pull back to a comfortable level keeping the uptrend daily i would follow the uptrend with leverage. im excited about the current daily pattern being a sign that a snap back to the bulls could happen tuesday, and im also excited about a lot of potential shorts of equity in the index. im just as excited about going long around emas and trendlines holding bull in the overall index. using fib im aiming for bear weekly highs as well as the 1 and the 1.618 as long as we are beating the regressive bottom and accute trend angle.

NASDAQ and SP500 big drop expectedI thinkw we may see a bug drop soon but this doesn't mean that I will short it

TQQQ update Heres my Elliot wave count for TQQQ
We may go lower tomorrow then a hard bounce to fill the gap, now this resistance has been hit 4 times.. If we hit it again theres a good chance we could break it and that would take us up to around $24.5 range, resistances get weaker the more times they are hit so watch for breaks and volume. If we Fill the gap with a hard rejection i believe we are headed down to the $20.20 range. This would be a correction after the wave 5 to 50 to 60% fib level..
This week is huge with earnings and the fed meeting so expect a lot of volatility, there is a chance we move sideways until the fed meeting
TQQQ Simple Chart AnalysisTQQQ - Rst 24 & 39 Supp 16
This code stock will represent long in nas100 chart. It can be traded like a stock to play. This will be the fastest way to gain a 100% ROI as long nas100 continue to shine & rise.

TQQQ update lease check my last post, we are right on track.
To keep this brief:
Elliott wave update i changed wave 5 to 3, i believe we are in a temporary corrective phase and targets are posted. The 38% is my target area at gap fill, most likely a flat correction
Currently we are at resistance attempting to break, we broke through the $17.40 level but watch for a retest of that level before moving forward. TQQQ looks very bullish at the momment, macd cross just below the 0, TSV are showing high buying power and MFI is overbought, small time frames we are showing signs of a temporary reversal downward and i mean temporary. I believe pre market we will sell off hard then rebound even harder. If u can tell every time we hit the overbought level we have a temporary downward movement
We predicted this reversal due to multiple divergence on the TSV and macd .
MFI is overbought on the 1 hour and the 15 min is showing signs of weakness
I think we will drop hard in pre market and recovery quickly.
this reversal will be temporary so don't get greedy.
Now alt scenario..
This could be the alt wave 5 which means we could move much higher
Thanks
god bless

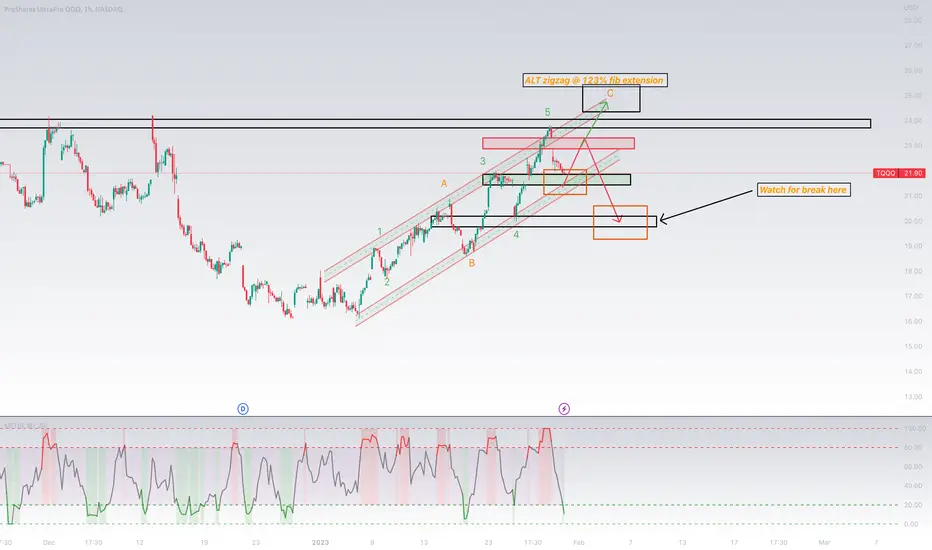
TQQQ update after CPIWe expected a bounce... this big? honestly no. The gap fill was my original target @ $18.81, it hit and acted as resistance then broke through.
We are currently sitting at resistance @ $20.21, i believe monday will be a red day considering some of our indicators are bearish. If we drop down to the $18.81 expect a bounce, i believe we will try and test the downward resistance line @ $19.61. (Decision point #1) if we break expect a retest of the green trend line.
Elliot wave: Staying with my original count with this being a wave 4 retracement, if we move any higher that will invalidate the count and we would be looking at a wave 5 retracement instead of a 4. It looks like a flat and zigzag correction, If we break higher C is the next target sitting at 127% fib extension for the zigzag. It's rare for a wave 4 to break this high but it is possible
Indicators: MFI currently overbought with divergence
Tsv: Decreasing volume ever since the previous high creating a divergence
Overall i'm bearish but i think there is a legitimate argument that we could go higher so watch break of structure and volume.
Thanks
God bless
TQQQ - Limit Buying inUsing 'Accounting' method to trade rolling ETFs that in long term may trend up. Have gradually increasing # of Shares for Limit buys at:
$20.10 (bought at market)
$19.81 GTC Limit
$18.81 GTC Limit
$17.81 GTC Limit
$16.81 GTC Limit

We have lift off!!!!As we can see a potential rocket ship formation. If this is like the last time I made a rocket it could rally quit a bit. There may be some more down side to complete the rocket pattern before official lift off.

Cup with Handle formation on the TQQQ Daily Looks like a cup with handle is forming on the daily chart. Look for a retrace down to at least the 18.47 mark on the red support channel. And then let's look for a lift off!

TQQQ - Price Targets & Stop Loss📈 What’s up investors! 📉
Welcome back to another one of
💡“Mike’s Ideas”.💡
I post as I find signals… these signals are based on the personal rules I have built and follow in order to make up what I call the “SST Strategy”. Follow for more ideas in the future!!
I have 4 levels marked and colour coded on the Chart.
These levels are:
⚪ White = Entry Point
🔴 Red = Stop Loss
🟢 Green = 1.2:1 Risk Reward Ratio
🟡 Yellow = 1.5:1 Risk Reward Ratio
🔵 Blue = 2:1 Risk Reward Ratio
👀 So what are we looking at today…!!!
🚨( TQQQ ) ProShares UltraPro QQQ🚨
The fund invests in financial instruments that ProShare Advisors believes, in combination, should produce daily returns consistent with the fund's investment objective. The index includes 100 of the largest domestic and international non-financial companies listed on The Nasdaq Stock Market based on market capitalization. The fund is non-diversified.

TQQQ update So far everything is playing out perfectly, we had our bounce due to selling exhaustion. We are currently at our first resistance $19.20. If we break this resistance there is a good chance we break up to the $20.72 to complete our wave 4. Now keep in mind it's christmas time, typically we rally so if we do break higher i won't be surprised.
Eliiot wave: We are currently in a pullback creating our wave 4, we can potentially go as high as 20.33 and still be a valid wave 4 before heading back down to wave 5 sitting at the $16 range.
Indicators:
MFI: We continue to move towards the oversold condition, that being said we can still move higher.
TSV: Continues to paint green candles but if u look at lower time frames divergences are appearing.
ADX: The adx is not respecting this current uptrend, its headed lower which means this leg up lacks strength
Patterns: We broke the uptrend channel, looking to possibly retest the previous support.
Thanks
God bless

TQQQ Short Back To $17I think we are over bought! Prices have halted with a spinning top doji having formed and a candle after to confirm a possible pullback. We have room to drop back to the high volume node at $17 where smart money will make the next decision on direction. Not financial advice , DYOR

New Year Rally Opportunity 5% scalp or more!The market shall remain irrational and thus I will take the opportunity to go long at least for a scalp up to $18.70, if we see continuation there are some upper targets to note. The hull suite is giving a buy signal, rsi moving up and we are far from over sold. Not financial advice, DYOR. Stay Blessed.

WED Moving Average NO FOMCHere is the Wednesday Moving Average updated. No FOMC Wednesday days. But honestly, I need to look back and factor out any speeches and minute pubs, because that 2PM candle still looks fishy to me. I'd be watchful of that 2:00 five minute interval, and be super twitchy on my keyboard right at 1:59:59 PM.
Happy Trading!!

TQQQ bullish scenario This is the bullish scenario for TQQQ i think we will hit the support at A but a reversal www.tradingview.com could take place at that point

TQQQ updated TA Preparing for next week.
As yall know I sold my SQQQ position at $19.60 support range, I'm looking for another short position.
This is what I'm seeing
1. Overall we are still in downtrend so I'm only taking short positions
2. We broke 2 previous supports we are currently retesting the $18.40 - 18.20 range, with the bigger resistance being the $19.60-$19.20 range
3. Currently we are bouncing off support and looking to break our first resistance, if this done we might be headed towards the $19.20 range
4. If you look at the adx its not responding to the current uptrend which tells us this is just a pullback from over selling pressure
5. The MFI is not oversold yet which means we could see a small continuation upward.
My entry requirements, I would like to see the MFI go over bought and the adx continue to trend down if this happens and I get a negative macd crossover ill enter my short position. As this happens the TSV bars should be getting smaller with a 0 line crossover.
thanks,
God bless

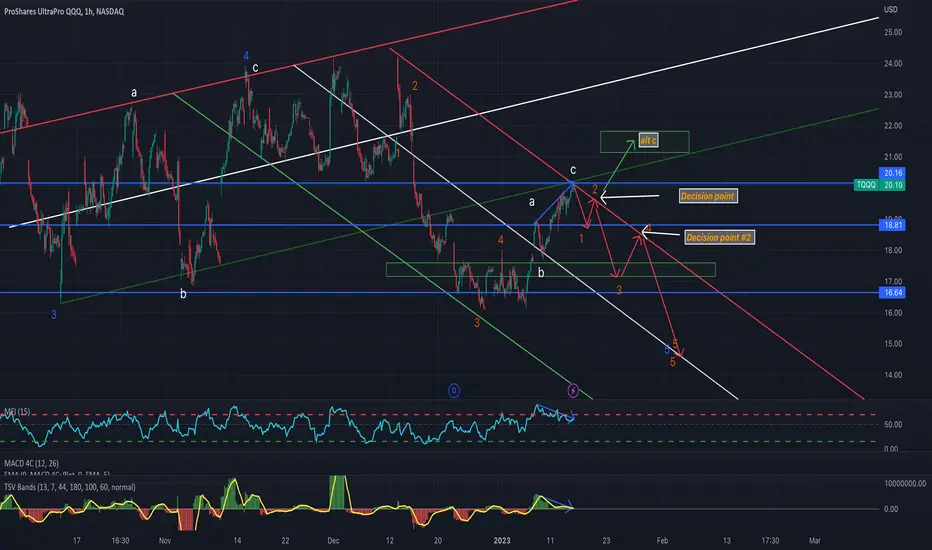
TQQQ after CPI I don't know yalls current situation but right now I'm sitting on cash.
In order for you to become a good trader you have to lose, when you lose you learn a lesson and you turn those lessons into a set of principles that you follow. Follow them.
So this CPI data release could have thrown a wrench in our original Elliot wave.. I said COULD..
From looking at the chart i created another uptrend channel, we buy in the green sell at the red
We talked about the potential of the wave 1 and 2 in the last post and whatever happened today will set the new Elliot wave count and it did
Currently their is no reason to get overly bullish so for now Big picture we are sticking with the original wave count, but there are sub wave counts we can trade.
Next trade I'm looking for is the wave 4 pullback, this one will be a little risk but again I'm following my rules if doesn't work out I'm good with it.
Currently the ADX and MFI are both respecting the uptrend, but watch the MFI closely it might create a bearish divergence that will take us to the wave 4
TSV matches prices action
I do apologize for how busy the chart is
Please if yall have any questions let me know I would love to hear them
Thanks God bless

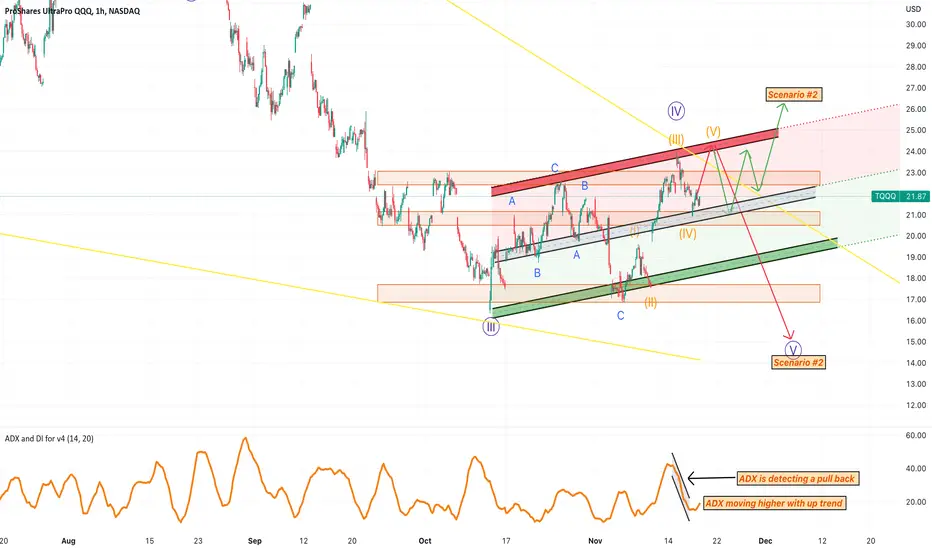
TQQQ at close We hit the wave 4 target that we talked about in the last post... where are we going???????? honestly i have no clue but this is what the chart is telling me....
We are in a larger time frame pull back..
Y'all already know the elliott wave count it's pretty much stayed the same the last couple of days...
Right now i see wave 5 coming.. ADX is detecting a weak downtrend which tells me that we are in a pull back not a new impulse wave.. that could change but as for now thats what im seeing..
Scenario #2 would be what everyone wants.. the bull market to return.. yes inflation reports have been positive but a bullish market, low unemployment and booming economy is not what the fed wants. Regardless we are gonna make money in a bull or bear so it really doesn't matter.
Thank yall
God bless