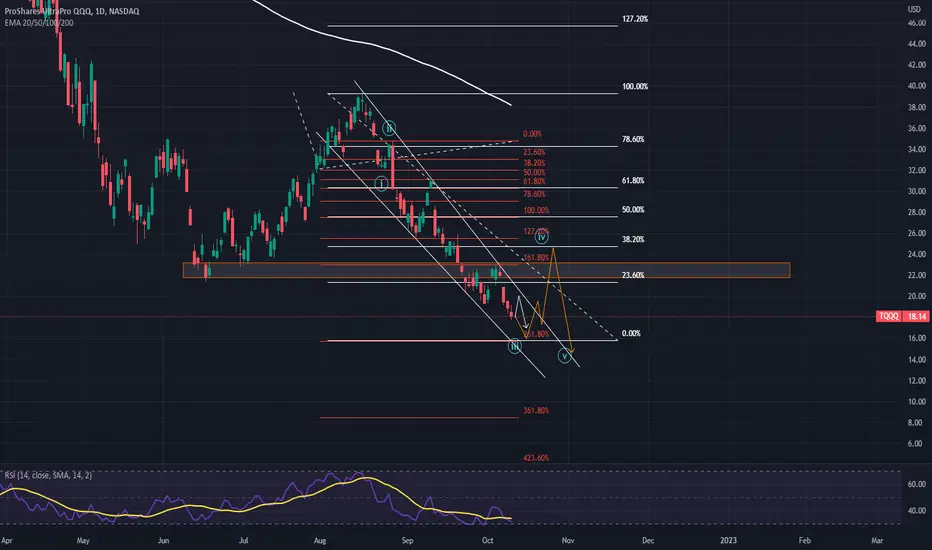
Don´t like TQQQ rnHey guys, TQQQ seems to be in a very dangerous spot, moving averages are probably going to take this much lower. I've shown on the chart everything possible i could happening however, with the Russia news i think a lot of whales are going to be getting out. Weak hands. My PT is around 19-21 then perhaps consolidation before a spike in stock price, exercise caution everyone.
TQQQ trade ideas

Let me hear it!! so i shorted TQQQ today.. not the best entry but definitely not the worst.... what do yall think am i gonna get stopped out or hit profit?? FYI i had no idea the PPI report was coming out tomorrow

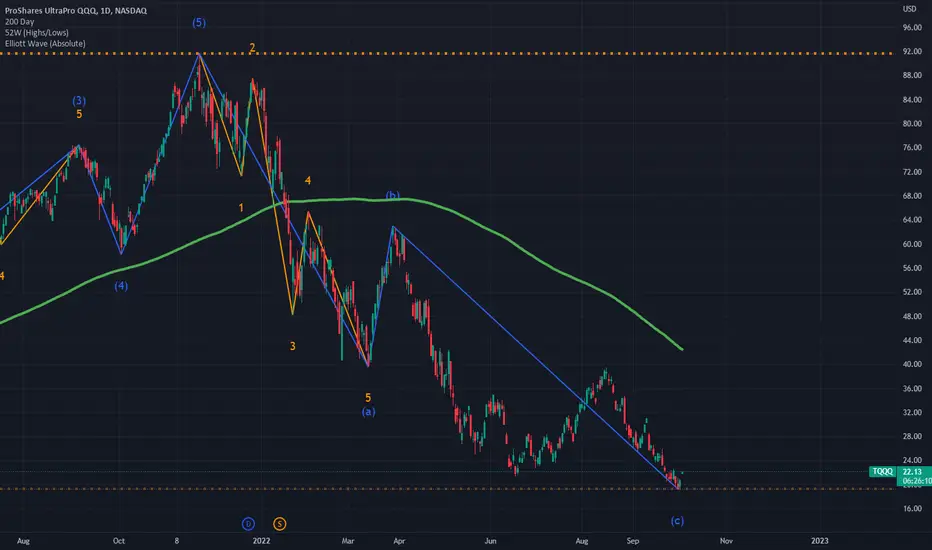
Possible Regular Flat WAVE 4 • A corrective 3 waves move labelled as ABC
• Subdivision of wave A and B is in 3 waves
• Subdivision of wave C is in 5 waves impulse / diagonal
• Subdivision of wave A and B can be in any corrective 3 waves structure including zigzag, flat, double three, triple three
• Wave B terminates near the start of wave A
• Wave C generally terminates slightly beyond the end of wave A
• Wave C needs to have momentum divergence
Fibonacci Ratio Relationship
• Wave B = 90% of wave A
• Wave C = 61.8%, 100%, or 123.6% of wave AB
These are the guidelines for a regular flat
If you would like to learn more here's the link:
elliottwave-forecast.com

TQQQ ahead of fed meeting 11/2/2022Traders it's gonna be a exciting week, so start preparing now.
There is potential that Wave 4 is not complete and we could move up towards the 50 or 61 % fib level, mind you those levels are not typical in a wave 4 especially with a extended wave 3 but it can happen.
On wednesday the fed will announce the next fed rate hike, i don't see the market making big changes until then, if they announce another .75 hike (which is likely), i see the market selling off. If they announce a .50 or they talk about being less hawkish in the future i can see the market selling off initially but recovering fast just enough to break the ascending trend line or maybe retest our support at the $20 range. This will liquidate long positions and open the door for big money.
Now obviously i'm not against idea of new lows i think it's very possible but it's important to always have a plan B, If we start getting rejected off the ascending trend line with good volume i'll be looking to short. If we break above the neck line with good volume i'll be looking to long. Volume is critical here, if you see large candles but lack volume there's a good chance its a fake out.
If yall have a different opinion i would love to hear it.
thanks God bless
“If you fail to plan, you are planning to fail!”
― Benjamin Franklin

Take profits, Prepare for possible BULL trapwww.tradingview.com So just a friendly reminder that we are still in a bear market so be extremely careful trading against the trend! I closed my long position a little early to manage risk.
This is what i'm seeing, the last few large candle sticks have lacked volume behind it, which means we lack BIG money.
TSV showing signs of weakness and bearish divergence
MFI has went over sold and in the past this marked a pivot point to lower lows
Let me be clear i can't predict the market all i can do is prepare for it.
The area we are in a happens to be a strong resistance are, we also had a very strong run up without any pullbacks which concerns me. I can't say forsure if we will see new lows but at the very least a good pullback to previous support which is $19.50 area
Elliot wave calls for another wave down but elliot is not always perfect you have to adapt to the chart and find where u are. We Could have completed the wave 5 which means we could see high highs, to possibly the 50% or 61 fib levels, but for now i am keeping the wave 4 narrative
Happy trading and god bless
I will also share how i came up with the elliot wave narrative
www.tradingview.com www.tradingview.com

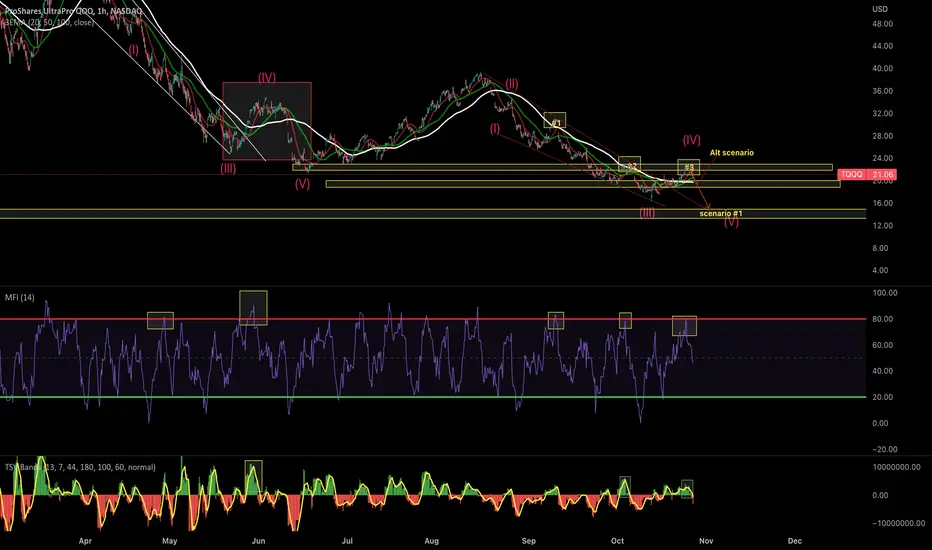
When will it stop???? BULL OR BEAR??1.We are oversold on the 4hr
2. Bullish descending wedge forming
3.Expecting a small bounce to the $19.68
4.Expecting a rejection@ $19.68
5. Hard downward movement to wave 3 @ $15.77
5.Begin wave 4 to the 38% fib level @ $24.85 www.tradingview.com
TQQQ elliots wave TA A slight correction for wave 5 then continue to the down side, no major support on the 4 hr so im thinking TQQQ could go as far as $28.10

Possible Tradable Market BottomThe TQQQ options may be a good way to trade it.
The Nov 25 2022 Call option with Strike price $25.50
Last traded at $0.86. That's $86 cost per option and
your total risk.
Low risk trade for a possible nice reward.
Goodluck.

TQQQ at the close Well everything is going as predicted, i sold SQQQ at the close to manage risk and lock in profits, even though there is a high probability of going to the downside i'm not going to be greedy.
So looking ahead we are forming a head and shoulders on the 1hr time frame with the shoulder area being a high volume / support area ,$19.88-$19.29 as of right now the q's are selling off due to apple's earnings but there is a lot of time from now and tomorrow, things change and we need to make sure we change with them.
That being said if we break the support @$19.65 and retest i'll be jumping back into SQQQ , if we consolidate around that area with the obv moving to the upside there might be a long position there, keep in mind we are at the 61% fib level which is a critical psychological level of support
Another thing to look at is your tsv bars, they are reducing in size which means less sell volume
also your obv is starting to consolidate, no longer moving down which means buy volume is starting to increase with the possibility of a temporary reversal
Last thing wave 4 is usually the longest pullback so even if we get another bounce it could be short lived before going back to the downside. Still maintaining my bearish view but just wanted to share my thoughts on alternative scenario that could play out but unlikely
thanks god bless

SPOOKY OCTOBER!! Why i think we will see new lows! 1. So looking back on the chart when the MFI has hit over bought it has been a good time to short the market, in a downtrend when things become over bought it usually represents a good shorting opportunity
2. If you go back on our last leg down we hit a wave 4 @ the 38% fib level with a descending wedge breakout then dropped to new lows to wave 5 before rallying
3. We had obvious divergences on the MFI( started trending down as prices moved up) also on the tsv( your volume was decreasing)
4. I don't expect earnings to be any good this week and the market will react in a negative way, after earnings are done we should be priced in for the rest of the year, that being said i think november will be our rally month
This is just my opinion, now there is a bullish scenario to this, if we can manage to hold 19.50 support we can maybe see higher highs but as for now i see a lot of resistances,
Please if u have a different opinion i would love to hear it,
thanks
Happy trading and god bless
TQQQ final update, Everything to met on elliots wave for the last leg up, i think we will see the very least a retracement back to the 38% fib level, but keep a close eye for the next wave to develop to the downside, good luck traders

Trend is ur friendTrend is ur friend and theres still no buyers in the stockmarket only stupid americans and this bearmarket will probably end in 2048

TQQQ market swingMarket reversals like this tend to signal market bottoms. Only has happened 9 other times since 1983.

TQQQ weekly bearish hammer continuation wave 5 downtrendOrder SELL TQQQ NASDAQ.NMS Stop 18.29 LMT 18.29 will be automatically canceled at 20230401 01:00:00 EST
TQQQ weekly bearish hammer continuation wave 5 downtrend

Critical level for #TQQQWe are approaching a critical level for #TQQQ I think it might give us some temporary bounce 18.4 is level to watch next week


tqqq trade...wishful thinkingThis can lead to a short-term bottom... need bad earnings to drive the market down....with another 1.25% interest rate hike this year...

TQQQ at the end of an Elliott waveWe are at the end of an Elliott wave. This will be a turning point keep on the lookout for wave 1 of the next cycle. Things are telling me, recession is canceled until next year so wave 1 might be upward.
TQQQBounce to run up 25 range resistance before possible correction to the lower 20 bounce to a catbounce drop possibility to the 13 range

UP, UP AND AWAY FOR TQQQLets go baby, we are at the bottom, making new lows! Only way to go from here is 62.90 by July!
-SPECIAL NOTES-
1. I trade this stock with a very small percentage of my money, I am not dumb.
2. There is a ton of controversy on this stock, in my opinion it should only be day traded, not long term due to volatility decay.
3. Since there is so much misinformation on leveraged stocks, I decided to test $50 every 2 weeks from my paycheck and buy like a robot. NO EMOTIONS INVOLVED. This is a Dollar Cost Averaging (DCA) strategy I am choosing to do.
4. Please be careful with your money and don't go all in because I said the stock is going to go up, it is still just guessing and learning.
Thank you!

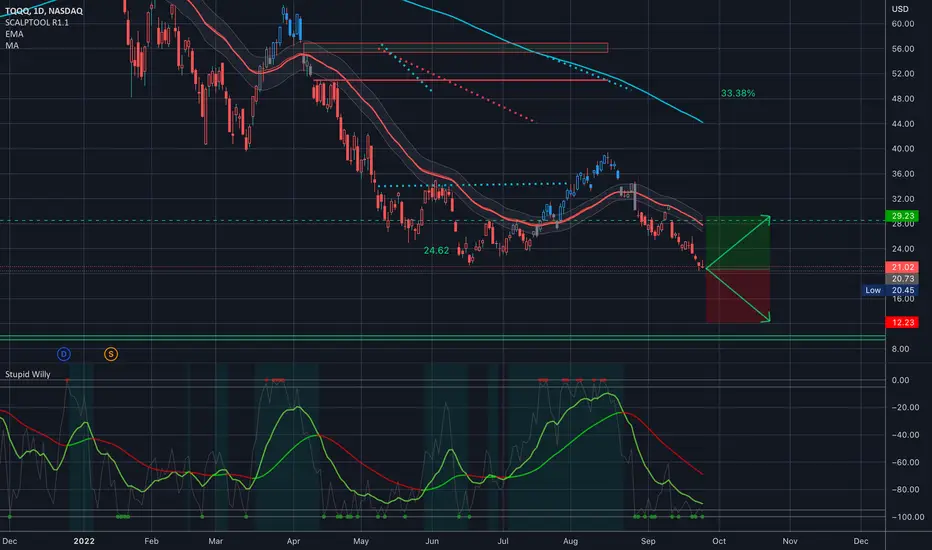
$TQQQ Analysis, Key levels & Targets $TQQQ Analysis, Key levels & Targets
I took a small TQQQ position, just 100 shares, at 20.73…
I’m either taking profit at 29.23 for 41%, or I’m doubling my position at 12.23. No in between.

TQQQ PITCHFORK SETUPWe have a nice pitchfork setup going on. Should see a momentum swing up from here.
