USO trade ideas


$USO Pulls Back on Covid Surge, but this ain't AprilUSO is likely now subject to "fast-money shorting" as a widespread factor in the action. We all saw oil was the hardest hit by the first wave of lockdowns, going to -$40/bbl into May expirations.
But the USO etf restructured to reduce impact on the curve, allowing delivery, and a ton of wells shuttered. Add to that the fact that we probably aren't going to shut back down across the country.
This could be building into a pullback long opp on any further serious cuts.

Oil looking like a pullbackCertainly with the fall two days ago a bounce could be expected but now a declining wedge appears to be forming. I have had to extrapolate the lower resistance but that's essentially what it will probably look like.


🤔 Keep An Eye On Oil. (USO)💰 LET'S GET INTO SOME OIL ANALYSIS!💰
1️⃣ First off SMASH that LIKE BUTTON & Give us a FOLLOW for DAILY ANALYSIS! ❤❤❤
(Overall Market Sentiment) 🐻 Bearish
- 3day Chart
- Doji Compression
- 3/3 EMA DOTS Red
Potential double top as oil takes a 5% hit today. Take entry based off indicators and add the breakout on the range drawn for extra confirmation on trend.
Best of luck to you and all of your trades this week! 🤜
Drop your charts and comments down below, share with us what you think is going on in the markets! ❤❤❤
Thanks for checking out our analysis! ✌😁✌
🥇MLT | MAJOR LEAGUE TRADER


USO on an upward trend?Thought USO might pull back end of last week but trended upwards. Looking at it now might be on track for some solid gains. let me know what yall think and your suggestions.

USO heading higher3 day chart shows USO in ABC correction with second wave heading higher afterwards, which RSI would seem to confirm. Target 20EMA.

$USO ETF (OIL) - Trend Strength Test$USO ETF (OIL) price action has set a temporary Support level in the 25.83 to 25.97 range.
A test of Resistance above in the 27.21 to 28 range is possible. USO has been in an uptrend for the past month.
Resistances: 26.82 and 27.21 and 28.
Supports: 25.96 and 25.83 and 25.

🥇 How We Use Our Strategy With Split Times. (Trading Strategy)👋 Hello, I hope everybody is having an awesome week with their trades! 😁
We here at MLT | MAJOR LEAGUE TRADER want to walk you through our time split system with the crossover strategy and the ema dots indicators. Let's take a look...
So what we will be using in this example today is USO (United States Oil Fund)
Top chart (12 Hour Timeframe)
Bottom chart (1 Day Timeframe)
All markets have trends and at the end of the day your job as a trader is to play the accumulation or the distribution zones aka turning points in the markets to ride the next trend. We use this color coordinated system to help identify when a turning point is taking place in whatever market it is that you're trading. You can apply this method to any chart timeframe. If you want to scalp the 30 min, then you would have a 30 min chart and a 15 min chart. Split the gimeframe that you are focused on playing. We use the split time for an earlier confirmation play to lead into a larger timeframe to secure that early entry for the bigger swing to confirm and play out. We also will use the split time to exit the trade when we get the sell confirmation. (Long / Short | Buy / Sell)
Now let's talk about the process...
Green represents an uptrend.
Red represents a downtrend.
When the 12 hour timeframe on top closes we will get either a green or red candle / ema dot close.
Same with the daily chart on the bottom.
Simple...
So what we look for is the early entry on the 12 hour. We want the candle to turn green, preferably a doji. (Candle that looks like a plus sign, tight price compression)
We want it to close green candle and all 3 dots below to align green with the close. If only 2 dots out of the 3 are green we do not enter! Same concept for red.
We will get the signal for a buy on the 12 hour before we do on the daily meaning that we will secure a better entry price vs just using the daily by itself.
Once you get confirmation on the 12 hour we hold that position and set a tight stoploss in case if it was to sell off. Once you take the buy you place your stoploss, diversify your funds and let it play out. If you get stopped out than you get stopped out. Take the trade and let it play out. As the 12 hour begins to close every 12 hours you will either see it start to form bigger green engulfing candles which shows buyers are pushing up the price, which is a good sign for your buy or you will start to see it shift towards going red which would obviously represent a sale or a short position.
Your job is to play the turning points in the markets and play that turning point range till you capture the next move. Markets go up and down, they don't stay sideways forever. Risk a little on stoploss in the range play and ride the next long term move. Trading is a game of probability and risk management. Even if you don't understand structure, support and Resistance or all the more advanced tools of the trade this will help make it easier on you to understand as a trader. SIMPLE IS BETTER! 👍
I have drawn vertical lines to represent where the buys and sells all lined up from the candles to the dots. Those are your opportunities to enter on the 12 hour.
Now if you look below you see that the daily actually stayed green from the very start of the first trade taken at the bottom of the trend on the 12 hour. The dots on the daily never closed red until the very top of the trend where we finally got all red to line up. That's another option to consider. You can use the split time to take more opportunities and trades for potential of trend changes. Or you can buy the first line up on the 12 hour and hold it till the daily is actually aligned red for a much larger swing trade position. If you did the second option you would of generated around 50% in gains from just one trade!
I hope this helps anybody that is struggling with trading and wants to learn how to get early trend confirmation on a specific timeframe that you want to trade. Swing trade or day trade any market with this strategy!
You can message me if you have any questions that you would like to ask. Please don't forget to smash that like button! ✌😁✌
Have a great day, Take Care! 🍻🍻🍻
🥇MLT | MAJOR LEAGUE TRADER

💰 Wait For Green To Long Oil. (USO)🤔 Day 5, not including weekend of oils trend change.
Your key Resistance level is the green upward support that we broke. This shows potential for a new trend as the Crossover strategy has been red and the ema dots have also been red.
You will want to confirm a long position when the green align back above the new Resistance. Otherwise let it ride. This is for a longterm swing trade confirmation. Easy as that.
Best of luck, 🎲🎲
🥇MLT | MAJOR LEAGUE TRADER

Oil Go Drip! (USO)😯 Uh oh! It seems to be that oil has broke upward support.
Now it seems to be treating support as resistance.
With a potential Elliott 5 Wave completion.
Would not be surprised if it dumped.
27.58 needs to hold.
Break below 27 is a short.
Bear > Bull
Best of luck! 🎲
🥇MLT | MAJOR LEAGUE TRADER

Is it finally time to buy? BULLISH $USOUSO for the first time since the pandemic started is above the 55 ema. Futures looking better and good news came out this weekend. Ticker created a rising channel which is technically bearish, but if it can break to the upside then I expect some major moves to come in this week. I'll be watching this one.
*not financial adviser

long Bulish coming week Target 55-60$ ( 25% pull back)Oil prices up about 5% as OPEC+ plans Saturday meeting to discuss output cut extension.
Pull back Expecting Coming days and Market recovery.
Opec+ Russia Surdia Ready for more cut with extended.

USO ETF Resumes Trading Oil Futures - 155% Price IncreaseFollowing temporary suspension of trading new oil futures contracts for all institutional and private customers by USO's broker RBC, USO has secured a second broker, RCG, to allow the trading of new oil futures contracts by USO , effective May 29, 2020.
In addition to the buying and selling of new oil futures contracts under RCG, USO still maintains full rollover capabilities of preexisting oil futures contracts, prior to May 23, 2020, maintained, and brokered, under RBC .
From the market low of $16.88 on April 28, 2020, USO has seen a 155% increase on price, as of June 2, 2020.
With economic recovery, and an increased demand for oil , poised to dominate the summer season, outlooks for holders of USO ETF are promising.

Purchasing puts on USO for the month of May.April's candle closed below March's candle. The next factor I look for is for price to return to March's lows. If price does this, then I will be looking to begin purchasing puts at the 32.00 strike with an early June expiration.

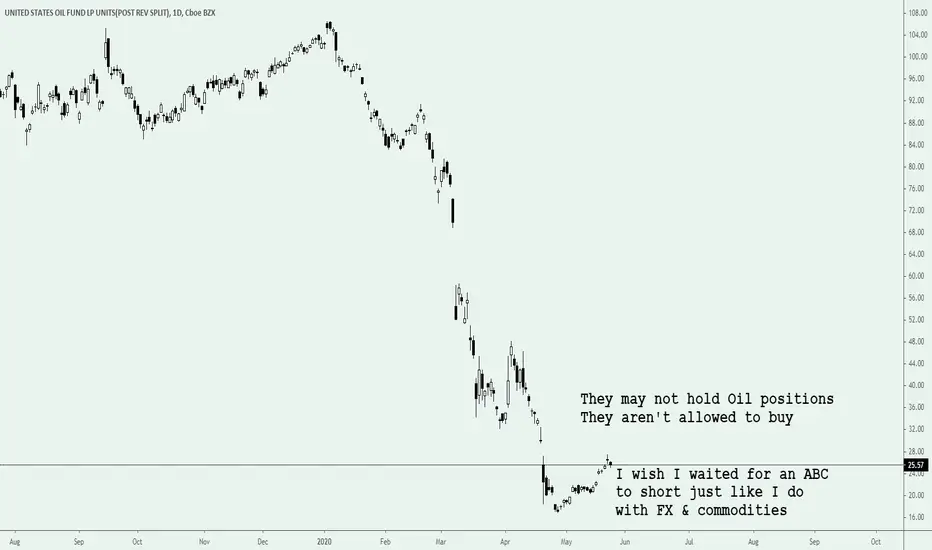
Welp. USO got permabanned from trading Oil.Extremely popular ETF among retail investors United States Oil Fund got banned from trading Oil. Less than 1 month after a 1 to 8 reverse split.
The number of holders on Robinhood, a popular broker among retail investors, has been going up despite all the negative news.
Actually it has been going up more the more negative news there have been.
How to write about this without looking sarcastic or making it look like a parody? I assure you all I am writting is true.
With Oil prices crashing the ETF saw about 2 months ago a massive influx of investors and hit their limit.
They have responded (after losing alot of their investors money and getting limited by the CME & regulators) by spreading their positions over several months.
On April 29th they did a, 8 to 1 reverse split to not get delisted. The price has kept going up since then, perhaps because of all the investors with less than 8 shares that bought back in.
According to a Thursday SEC filing made by the ETF, RBC Capital Markets, their broker, has informed the fund running USO that they could no longer buy oil futures and not even hold oil positions. USO response has been to say they may hold larger amounts of cash & cash equivalents and treasuries (zero or even negative yielding US treasuries).
RBC reason is speaking in layman terms to not end up like Lehman Brothers.
Despite being down 75% YTD USO AUM have quadrupled (and would have done more than this had they not hit the limit).
ycharts.com
RobinTrack data shows that the number of accounts holding USO has soared by about 2000% since March.
So... if they are at the limit, they money they lose can be replenished by new buyers and they can remain at the upper limit forever? (As long as new buyers join).
They might have to redesign their offer, since they cannot hold oil anymore. I guess they're just going to hold "investors" money in cash & bonds while collecting fees.
Let's see what the regulators say. People wanted to buy Oil but we all know they just want to buy something deep in the red and even if the ETF changes they are not going to sell because they enjoy holding losers. They might even be interested to buy more. Seriously. The keyword is "emotional" but better than this would be "irrational" and even better - I have to - is my own description "complete morons".
Of course technical analysts do not need to read the news and knew all of this before it even happened thanks to their magical little oscillators and tools.
Retail investors are unphased and ignoring this "FUD". I expect them to buy more, probably expecting an investment in their own money at a fee to magically go up.
When I'm doing my research I'm angry and ranting half of the time but also I'm just laughing in front of my screen half of the time. I love my 'job'.

TECHNICAL LONG OIL. TINY STOP. GOOD RISK REWARD.A good opportunity has presented itself for a long trade in oil.
A mid term trade, from a nice level. First take gives us a roughly 2:1 risk reward and I will be closing half of my position there.
Next take is at the first big resistance level. I will close my entire position there.
The stop is very short, yet, pay attention, to that it is not ON the level, but slightly BELOW the level.
Avoid simple mistakes.
Wish you luck!

Probable small correction coming soonProbable small correction coming soon. Need more bullish momentum from WTI. but definetely price will rise.


USO Bullish: Long 12mos - 24mos Volatile Stock - Invest Smarty!AMEX:USO
The U.S. largest oil fund has come under fire as of late. USO’s recent actions to cushion the blow from a historic sell-off in oil markets hit by oversupply and a coronavirus-induced plunge in fuel demand have brought about doubt if the fund can still meet its investment objective of reflecting the spot prices of oil. The fund has been trying to mitigate potential losses from falling crude prices by spreading its holdings through contracts expiring in July, August and September. USO said, "The inability to closely track the benchmark oil futures contract, the changes in its portfolio of investments and the impact of higher levels of contango, will impact the performance of USO and the value of its shares."
Many investors have bailed on USO as they understood more about contango. A Seeking Alpha article that described the perils of the futures roll when longer-dated contracts are more expensive than near-term ones. Understanding this motivated many investors to find exposure to oil futures that don’t expire anytime soon such as the United States 12 Month Oil Fund LP (USL), which contains further-out contracts or Invesco DB Oil Fund (DBO).
Taking into account everything that has occurred over the last few weeks, USO's stock has slightly climbed after executing its reverse split and as oil prices are recovering. You must recognize that the USO fund managers are in survival mode right now and doing everything they can to keep the ETF afloat. USO’s portfolio was moved away from the front-month contracts, which they did ahead of everybody else. As the world continues to battle the COVID pandemic, social distance restrictions are beginning to loosen. However, the recovery for oil will be slow. Oil traders believe it’s likely to take more than a year, and perhaps much longer, before global demand reaches the pre-pandemic levels of roughly 100 million barrels a day. But our world is still heavily reliant on fossil fuels as it is the world's primary energy source. Oil is the world's primary fuel source for transportation and the United States is the world's leader in petroleum consumption. So as the U.S.'s transportation activities recover, so will the USO ETF.
My chart analysis sees the stock hitting $32 by January 2021 and expecting to trade above $60 by 2022. I obtained positions in USO when in the stock bottomed out prior to the reverse split and possess several long options at $1.50 & $2.50 calls ($12/$20 with reverse split conversions) that set to expire in 2022.
Be effective and trade smartly my friends!
I am not a financial advisor. The advice here given is not financial advice even though my excitement might make it look like such. Trade at your own risk and remember nobody can guarantee you results. I conduct analysis and make informed decisions on what I believe is right and at the end of the day, I am just a person, not an expert. Again, this is my belief, a belief of an ordinary man, who just works hard and enjoys the pleasures of swing trading personally.
Darell
