Looking for a bounce in XleI'm looking for a bounce to $41. I see an oversold rsi, with price action coming into the bottom of a channel, the 200 day MA is heading towards the price to add some additional support. Contingent on the general markets price action, if all else holds, xle heads to 41 and possibly $50 if a breakout ensues.
XLE trade ideas


XLE will be up for the next few barsReasons to be up.
1. Bull flag on the hourly chart.
2. Failed trend channel line break,
3. 3-pushes down and reversing up.
4. Up trend for the past few months.

Update on XLE: Uptrend test, TA signaling a correctionThe ETF's recovery is starting to show its first cracks as we have dropped from Yesterday's highs and closed without an attempt to buy the dip. Volumes were the around the average for the day and the fall could be mostly a result from long covering.
But there are some technicals that suggest we may return back inside the range. RSI and MACD have bearish crossovers and RIS is also below 50. MACD's histogram is going negative.
Current price is sitting on two major supports and today's price action will be an important one. This is an area for caution.

Update on XLE: Potential continuation of the uptrendTaking a look back at XLE we can see that the ETF has returned to test the area of breach of the symmetrical triangle (or the current support of the descending trend line). Pick up in volume shows that the activity has risen and market participants are getting excited. A breach was made a classical follow-up test was made. Currently, we are sitting at the support and overall there was no attempt in Yesterday's market session to push below it. The dip was bought and XLE closed firmly with a fresh high for the day. Even though here RSI and MACD are laying out the perspectives for a deeper correction it may be "skipped". Recovery in energy assets may pull up the ETF away from the support for the uptrend to continue.
My personal view is that trend will continue and XLE will rise, but it won't be wise not to forecast a negative scenario as well.
The outlook will shift to negative if we see a strong push back inside the triangle. Fundamentals are still shaky with the COVID-19 pandemic still raging. This may raise the question of additional lockdowns or stopping global flights again, which will hit oil and energy prices overall.

OPENING (IRA): XLE MARCH 19TH 32 SHORT PUT... for a .78/contract credit.
Notes: Continuing to build 2021 positions ... . Have some on in the February cycle, so going out to March with 30-day implied at 40.1%, expiry-specific at 41.3%. 2.47% ROC at max as a function of notional risk.

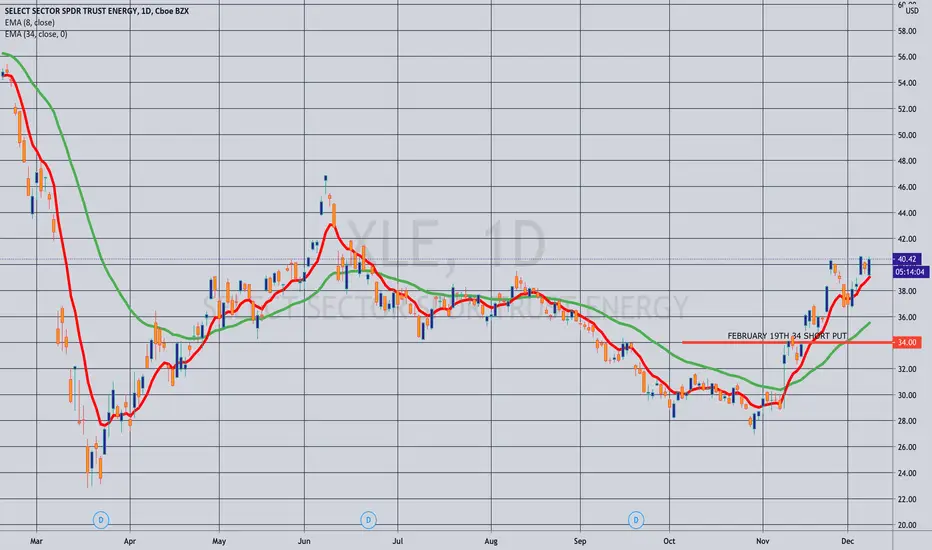
OPENING (IRA): XLE FEBRUARY 19TH 34 SHORT PUT... for a .71/contract credit.
Notes: Highest background implied on my exchange-traded fund board with 30-day at 40.2%, expiry-specific at 41.6%. I've already got some January stuck out there, so am basically laddering out a smidge by selling the 16 delta out in the February monthly. ROC: 2.13% as a function of notional risk at max; 10.65% annualized at max.
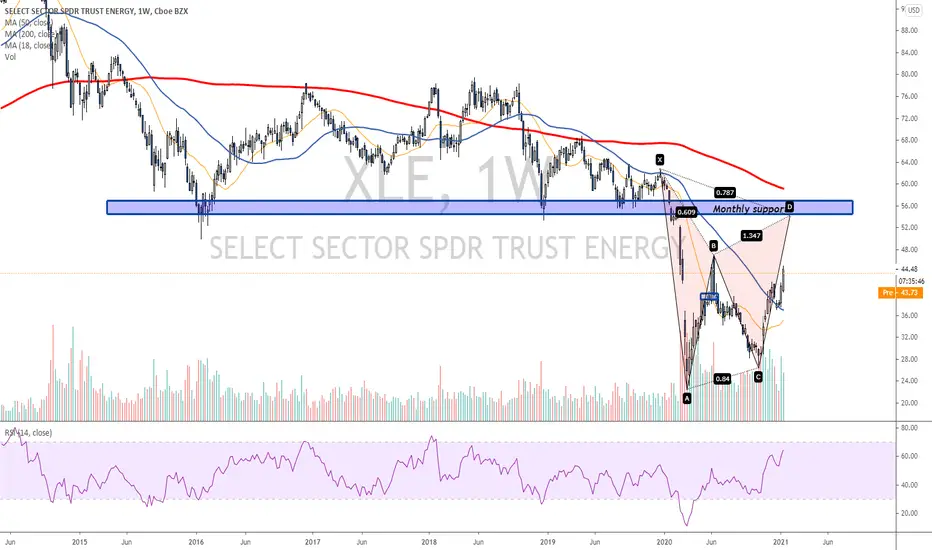
XLE (US energy sector) 10% correctionAwaiting 10% correction to complete wave B of ABC(uptrend correction)
Very similar to SPY (SNP500)

The next resistance zone in XLE is...Check out the weekly chart of XLE with a potential resistance zone to focus on in the coming weeks/months
Revisiting XLE and the recovery of the energy sectorUpdate from a previous post: XLE developing nicely as the price has managed the get out of the range and yesterday we opened with a gap and there almost no attempt to push the price down and to fill the small gap. MACD's crossing is widening and the histogram is expanding as well. RSI moving to the overbought zone, but there is some more room for additional movement North before any correction. The energy sector is starting to recover more and more and demand for the ETF is rising as well. Volumes support the recent movement. My short-term target is $47.

The revival of Energy - XLE on the riseXLE has been in a range for quite some time with the fall of Oil price from the first lockdown. But as thing recover and demand for Oil is returning to somewhat normal levels, the ETF is starting to give signs of life as well.
RSI well above 50 and is moving slowly into overbought territory, but this means that there is more room for the price to rise.
MACD has made a crossover and the histogram is turning positive.
Resistance level circa 40 has been breached.


Golden Cross with Energy ETF at Historic LevelsThe SPDR Energy ETF had a historic selloff last year, but now it’s holding some key levels as an important chart pattern appears.
First, XLE spent the last two weeks of 2020 holding roughly $37.90. That was near the low from March 2009. Looking back even further, it’s also near a high from November 2004. That’s when crude oil began its major ramp toward $100.
Next, XLE’s 50-day simple moving average (SMA) rose above its 200-day SMA last week: a golden cross reversal pattern. It’s the first time the fast line has been over the slow line in more than 2-1/2 years.
The fundamental picture could also be improving as the Saudis hold OPEC+ in check. There are clearly risks to crude oil, but the current situation could be starting to resemble 2003 with a strengthening global economy and weakening dollar. Copper, gold and silver have already rallied. Will black gold follow and climb the wall of worry?
TradeStation is a pioneer in the trading industry, providing access to stocks, options, futures and cryptocurrencies. See our Overview for more.

XLE: Divergence->left turn->slow burn uphill?-ST divergence in the fall- confirmation of trend change to at the VERY least follow the boring, ascending slowly yellow floor???????
-test of yellow trend again->slow burn
-bounce off 50% gap followed by BO, Retest, Resumption of Red
-BO-R-R off green, up to fill the gap from the crash and 83
-insolvency crisis in 21 to bring it back down yellow?
-gunna watch this one, oil is going no where

XLE looking bullish long term on daily chart, target 90So far we do have a 1-2 start coming off the march lows, could complete a micro 2nd wave pullback to begin the wave 3 move to the upside. Additionally, this could signal a longer term change in trend for energy, after the consistent downtrend for the past 5-6 years.
Disclaimer: The proceeding content is informational only and based on information available when created. It is not an offer or a solicitation nor is it tax or legal advice. It does not consider your financial circumstances and objectives and may not be suitable for you.
Copyright Rohan Karunaratne 2020

OPENING (IRA): XLE JANUARY 15TH 32 SHORT PUT ... for a .51/contract credit.
Notes: The exchange-traded fund with the highest implied 30-day on my board. 1.6% ROC at max; 13.0% annualized. Will add "rungs" in subsequent cycles (i.e., Jan/Feb/March) if implied hangs in there.


Xle pullback buy areaLook for xle to pull back to yellow area. Look to buy into at these levels of support

XLE Chart soon to break 100% FibSine the energy sector has been recovering for a couple months XLE and many other gasoline stocks have been performing very well. I expect to see XLE break the 100% and run to the next three pivots with volume.


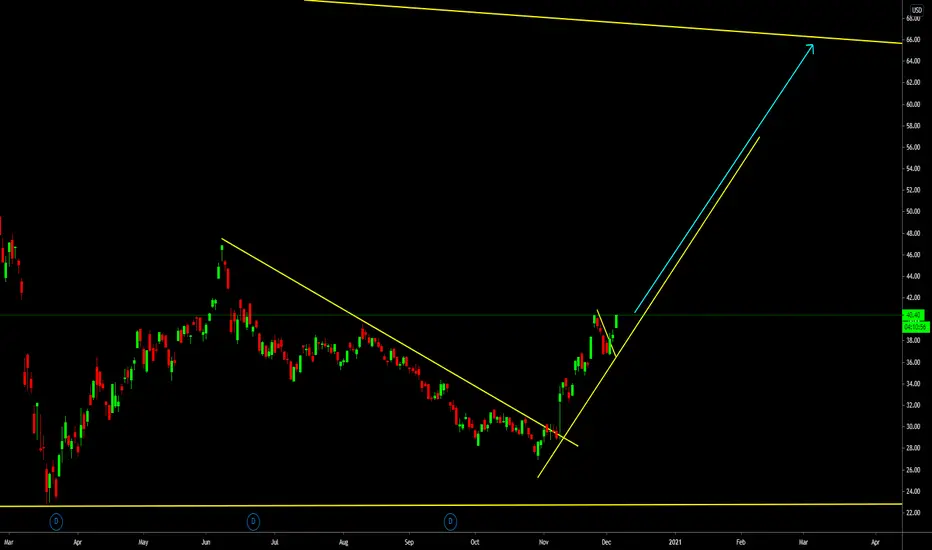
Is the oil sector uninvestable? We don't listen to stories about a future no one knows we just simply trade reversals and continuation wave formations our model gives us. We highlighted the xle in late october and took the trade early november. Obviously the vaccine news was a huge boost and we had no idea it was coming but that's the beauty of markets- you don't know what you don't know. So we are uncertain if the sector will continue to move at this pace but until something changes we are staying long
Ingenuity Trading Model is an algorithm used in- Stock, Forex, Futures, and Crypto markets. The model is a Geometric Markov Model :
In probability theory, a Markov model is a stochastic model used to predict randomly changing systems. Markov Models are used in all aspects of life from Google search to daily weather forecast. The randomly changing systems we focus on are the equity, futures, and forex markets. The geometric element of the model is the fractal sine wave structure you can find on any chart you look at across any market and across all time dimensions.
Our model focuses on the current sine wave formation (current state)- geometric price formation along with its volume and volatility over a given time period and using that information to predict the future state- future price movement. For questions or more information feel free to contact me in the comment section or via private chat