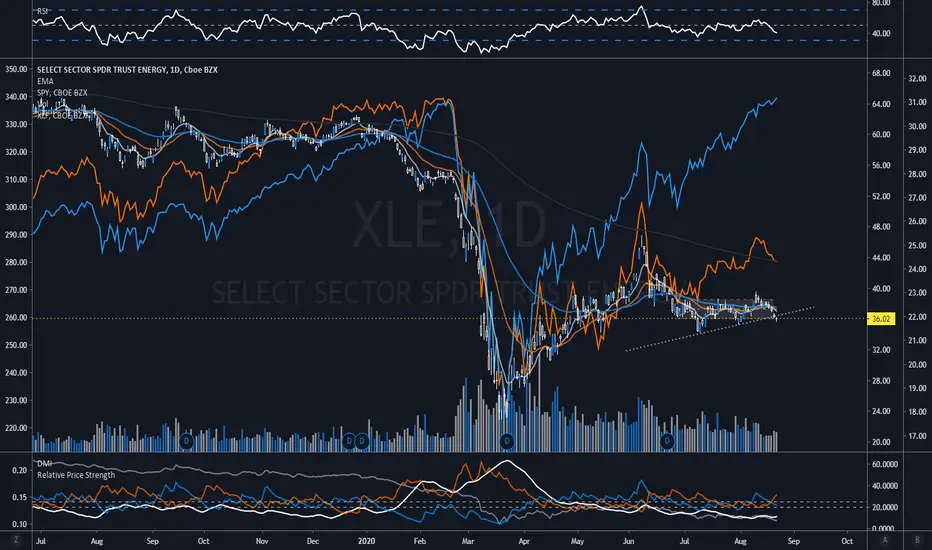
XLE OutlookXLE looks for further down side. The RSI is down on the floor, but I am not expecting a bounce until the purple box.
I am expecting this to revisit it yearly lows in the next few weeks.
XLE trade ideas

Good opportunity to short XLE on this recent popXLE looks extremely bearish. Might be a good idea to sell some call credit spreads to benefit from the last pop and ride it more to the downside.

Price of Oil rising while XLE fallsFutures on crude oil is increasing while XLE is flat or declining. The gap is widening. Bottom indicator is taking the 100 day % change of each and comparing.
How much does XLE need to move to catch up?
Is the tech bubble holding XLE down?
How resilient would XLE be against the market further correcting?


$XLE ; the one XL with a good call/put ratio , targeting $40its oversold conditions and its 0.7 put/call ratio on open interests is the only bullish XL etf in the sector

LONG XLE Nice long here. XLE broke (purple) triangle bearish but saw no follow through as it got bid up from 35.30 support on 08/27. Huge support between 34.26 & 35.30 with 34.88 being the 50% retracement of Covid low to high of Covid bounce. This support area has held since early May and should continue to hold unless we see a significant sell off in the broader markets. Falling wedge (yellow) coinciding with this support also. Could really see an explosive move here, and accompanied with a hard 34.30 stop Risk/Reward is highly favorable.


XLE wedgeBeen long on XLE for a while, pretty familiar with its movement.
It's going to be breaking a big wedge soon and I'm rolling with big upside. Oil could be in a better situation but the bull case is better than the bear. XLE should easily be mid 40s.
I expect it to test $40 and fall back down

Energy ETF Is Trying to Turn HigherEnergy stocks were some of the biggest losers of coronavirus. Not only did petroleum demand fall off a cliff in March and April. They’ve also faced a big institutional shift toward ESG investing (electric vehicles and solar energy).
But few things last forever in the stock market. The fundamental backdrop for energy has improved as travel and the economy rebounds. (Air and rail traffic have both rebounded to their highest levels of the pandemic, and jobless claims have dropped to their lowest level.)
This potential turn could be playing out in the SPDR Energy ETF, which holds big names like Chevron and Exxon Mobil .
XLE had a giant spurt higher in June amid optimism about the economy reopening. It then calmed down and has been consolidating since. A few patterns suggest a turn may be coming soon.
First, XLE held the mid-May low around $34.30. If the downtrend were going to continue, that level had to give way. But it didn’t.
Second, the moving averages have stopped falling. XLE’s 100-day simple moving average (SMA) is now rising. Prices are also pushing up against the 50-day SMA. A breakout through here could get some more attention.
Third, prices are squeezing as volatility declines. XLE’s Bollinger Bandwidth is back to the lowest level since the crisis began. That can also indicate direction is changing.
This chart has a lot of potential but no clear signal yet. Traders may be looking for another close above the 50-day SMA for confirmation.

XLE - Market Rotating Into EnergyMarket topping out, oil looks prime for a break out. See $USOIL idea below. Only question is how high can this rally go if the DXY breaks out of its wedge and rips higher?
If the energy sector takes off, that could give the green light for other equities to continue rallying, while equities go down. That would imply a stronger-than-recent USD and higher priced equities for the next few months aka higher inflation.
Interested to see how this all plays out.


OPENING: XLE AUGUST 21ST 32/43 SHORT STRANGLE... for a 1.56/contract credit.
Notes: Camped out at the 20 delta with break evens at 30.44/44.56. Look to manage at side approaching worthless or break even test ... .
