XLE trade ideas

Energy; The Contrarian PositionEnergy is now historically low in regards to it's percentage allocation in the S&P 500 components.
Likely going to build a long term position if we reach the target, likely early 2020
XOP 3x levered GUSH is trading in the $2's haha... going to need to split soon

SPDR energy sector double bottom and upside divergence XLE has a good double bottom and modest upside divergence. grabbing some oct 11 57.5 calls at 41c

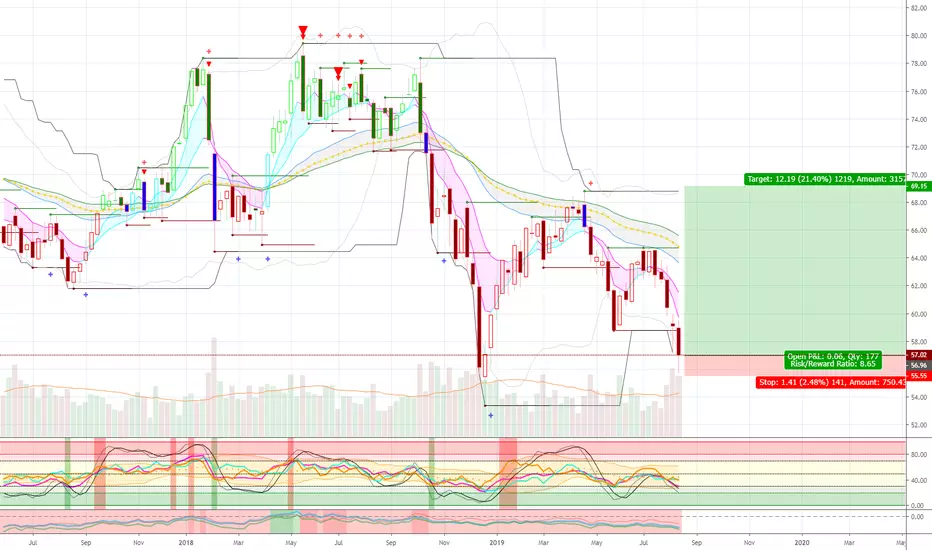
XLE - The time has comeAs the last published idea, I recommended to Buy when price re-test the old bearish trendline. Besides, the price now is supported by a short-term bullish trendline. I believe the time has come for us to get a long position. However, we should consider the possibility that the price would continue to fall and return the bearish trend.
There are 2 strategies:
1. Buy and set SL around 59-59.5
2. If the price breaks down the trend and hit SL. => Wait


Dark matter Energy. Been tracking sectors for opportunities..
This one is a nice entry on the monthly.

XLE - Chance to hold As we can see from the chart, the price had increased over the bearish trendline - which had stood for months, and reached the resistance of EMA 200-period. Besides, the price still created a long tail, although there was massive Sell Volume.
=> XLE would have a great chance of going up.
There are two strategies for this:
1. Going long whenever the price close above the EMA 200-period
2. Wait for the price to test the bearish trendline again and get a long position.


XLE - Quick Short. Bear Call SpreadLong Term Trend Downwards.
Increase in Volume.
RSI >85
PA recent Short term push but looking for Revert to Mean Lower.
Taking 57/58 Call Credit Spread
Also 56 Put for Directional Bias Lower.
Sept 20th Exp
Good Luck - Watch your $$$ RISK

XLE - possible upsideProbably too early to have much confidence in this count, especially with that large red monthly bar, but is this count a possibility for the energy sector going forward?

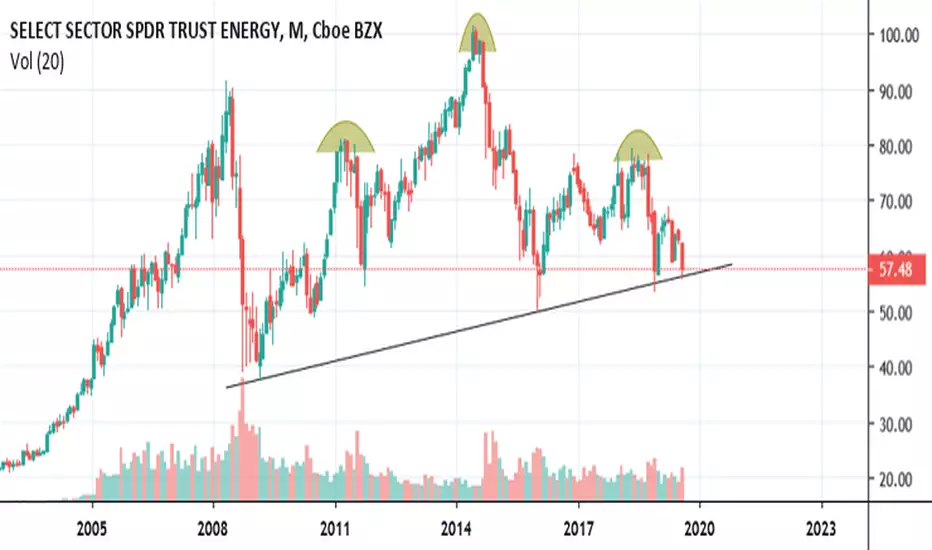
$XLE Possible H&S on multi year chart.Needs to stay above the bottom trend line, or it gets ugly. lots of selling volume recently.
When to Buy a DownTrendThree factors; Seasonals are positive for the next sixt weeks, we broke down through two standard deviations of the channel and reversed higher, and our Momentum Reversal signal flashed a buy (Trade genius Money maker). This is a tradeable event. Now go and search the components and select the trade that fits your criteria.

56.5 xle line in the sand xle has not had a monthly close below 56.5 for many years, ...scratching at the door

Trump the Great! (Or Not)Trump has been in Office for 921 days. He campaigned on bringing back old industries like steel and of course 'clean' coal. He lived up to his promises of lifting and removing thousands of environmental regulations and laws. So what are the results?
....................1/20/09 - 1/20/17..............1/20/09 - 7/30/11..............1/20/17 - 7/30/119 ..........
ETF .............. OB %chg after 8 Years..............OB Days in Office 921..............TR Days in Office 921
SLX .............. 55.58%............................144.79%............................-7.35%
KOL .............. 1.18%..............................281.81%...........................-2.80%
XLE .............. 69.18%..............................73.26%..........................-15.62%
TAN .............. -74.91%..............................-7.66%...........................63.31%
SPY .............. 181.42%...............................9.84%...........................32.63%
QQQ .............. 340.81%............................106.47%...........................57.23%
XHB .............. 218.83%.............................54.52%............................22.74%
Lessons to be taken. 1. Regulations can help keep smaller players out of your industry, thus reducing competition - Hence 'drill baby drill' not always a good thing.
2. No one believes or want our 'clean' coal. 3. The masses are smarter than the select elite few who deny climate change and are investing in solar.

How good is Trump?Trump has been in Office for 921 days. He campaigned on bringing back old industries like steel and of course 'clean' coal. He lived up to his promises of lifting and removing thousands of environmental regulations and laws. So what are the results?
Obama 8 Y 1/20/09 - 7/30/11 1/20/17 - 7/30/19
ETF %chg Obama 8 Years Obama Days in Office 921 Trump Days in Office 921
SLX 55.58% 144.79% -7.35% STEEL
KOL 1.18% 281.81% -2.80% COAL
XLE 69.18% 73.26% -15.62% ENERGY
TAN -74.91% -7.66% 63.31% SOLAR
SPY 181.42% 59.84% 32.63% S&P 500
QQQ 340.81% 106.47% 57.23% NSDQ100
XHB 218.83% 54.52% 22.74% HOUSING
Obama 8 Y 1/20/09 - 7/30/11 1/20/17 - 7/30/19
ETF %chg Obama 8 Years Obama Days in Office 921 Trump Days in Office 921
SLX 55.58% 144.79% -7.35% STEEL
KOL 1.18% 281.81% COAL
XLE 69.18% 73.26% ENERGY
TAN -74.91% -7.66% SOLAR
SPY 181.42% 59.84% S&P 500
QQQ 340.81% 106.47% NSDQ100
XHB 218.83% 54.52% HOUSING
1/20/17 - 7/30/19
ETF Trump Days in Office 921
SLX -7.35% STEEL
KOL -2.80% COAL
XLE -15.62% ENERGY
TAN 63.31% SOLAR
SPY 32.63% S&P 500
QQQ 57.23% NSDQ100
XHB 22.74% HOUSING

Daily XLE stock price trend forecast analysis18-Jul
Price trend forecast timing analysis based on pretiming algorithm of Supply-Demand(S&D) strength.
Investing position: In Falling section of high risk & low profit
S&D strength Trend: About to begin a rebounding trend as a downward trend gradually gives way to slowdown in falling and rises fluctuations
Today's S&D strength Flow: Supply-Demand(S&D) strength flow appropriate to the current trend.
read more: www.pretiming.com
Forecast D+1 Candlestick Color : RED Candlestick
%D+1 Range forecast: 0.6% (HIGH) ~ -0.6% (LOW), -0.1% (CLOSE)
%AVG in case of rising: 1.0% (HIGH) ~ -0.4% (LOW), 0.6% (CLOSE)
%AVG in case of falling: 0.3% (HIGH) ~ -1.2% (LOW), -1.0% (CLOSE)


ENERGY Long I like the RSI and MacD indications for a long portfolio position here. Natural gas and oil have been beat down enough that this looks interesting, a little dollar weakness wouldn't hurt either.
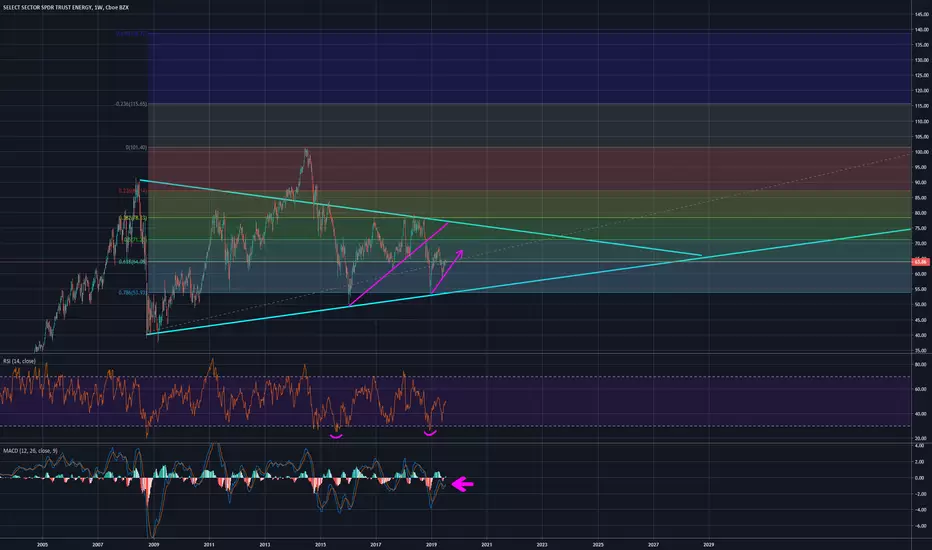
QUARTERLY XLE-ENERGY STRUCTURALLY DETAILED TA-2019 (+MACD/RSI)Safe to say that post 2014 (and even earlier) the renewables have become a serious competition to the traditional part of the XLE sector(coal/gas/oil).
Crucial note: Breaking of the black trendline, could symbolize the start of a recession as this would mean that inflation expectation have decreased.
In any case, this is just a brief analysis, everything is on the chart. There's really not much to say, XLE hasn't performed well in the last 5 years(blue text) compared to other sectors.
>>If you liked this idea give it a thumbs up! Every follow is much appreciated!>>
Full Disclosure: This is just an opinion, you decide what to do with your own money. For any further references- contact me.


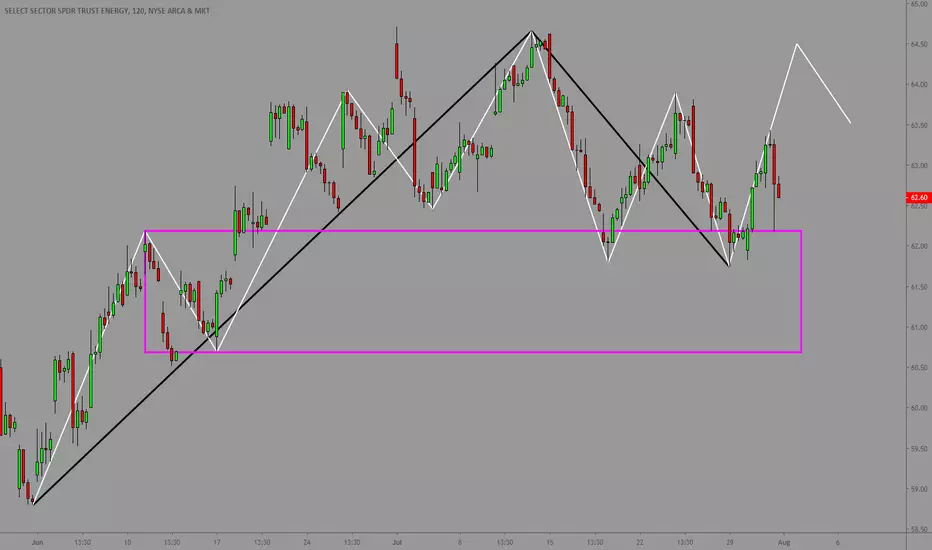
XLE is poised for a breakout, as fuel prices rise. The world is not a very safe place at the moment especially if you own a Oil Tanker, current tensions in the middle east has seen oil prices rise considerably in recent days, threats of storm damage has even resulted in a price rise in Natural gas, thus the beaten down XLE may be a nice trade in the days to come.
We have outlined on the chart a possible trade strategy on a nearterm breakout.
