XLE trade ideas


ERX/XLE - BreakingAfter the weekly key reversal and a follow through here is our trendline break on the daily chart.
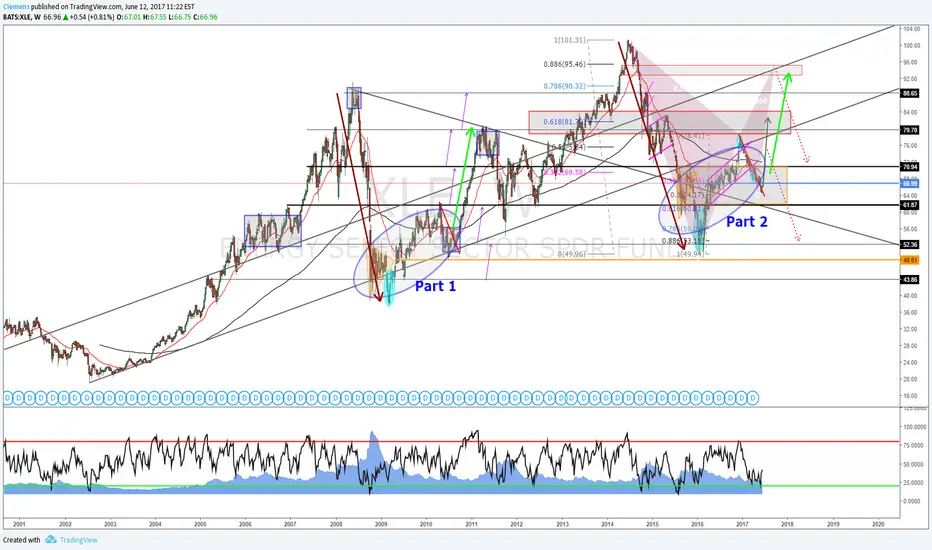
I'm making the call : the energy sector has bottomed.
Oil has bottomed on the 5th of May and it's just coming out of a severe half cycle low . ERX/XLE bottomed a few days ago on the 7th of June.
We are above not just the 10 but also the 20 EMA and right now attacking the 50 EMA.
RSI is heading to overbought but if I'm right it will be overbought for a long time...
If it breaks out finally it has months to run.

ERX/XLE - New hopeFinally we have a reversal candlestick on the weekly chart in XLE.
It's not just a simple reversal candle but a key reversal.
Those who follow me for a while know that this is one of my favourite candlestick especially on the weekly charts.
The daily key reversal is also very good. But the weekly is rare one and almost always followed by big follow through candles - in this case green ones.
The bullish key reversal is valid when:
the bullish monthly (daily) candle (green candle) low is below the previous month's (day's) candle low and the bullish reversal candle's close is above the previous candle's high.
Even better the key reversal is when the bullish candle's open is below the previos candle's close and the close above the high of the previous candle's high.
I used to call the key reversal a super swing also. Actually we will get a swing low when we berak above this week's high next week. But I think as we printed a key reversal it's no use to wait for the swing because after the weekly key reversal the swing is always coming... And it's usually arriving with a big gap.
Many will ask why didn't we wait for this reversal then we could have a better entry price.
The reason because no one can tell if this kind of reversal ever coming or not.
And this is the time when it will be hard to tell when to enter here... The time to enter in ERX and XLE was Friday.
Of course we might open where we closed but watching the volume and violence how ERX and XLE was rallying on Friday I say there is a decent chance that we open by a big gap and my early entry will be in big plus.
And while many will be waiting for a gap close price might never look back again just run...
I will come back to this weekly chart many times in the following months.
The next mission is to close back above the 10 EMA and break the trend line.
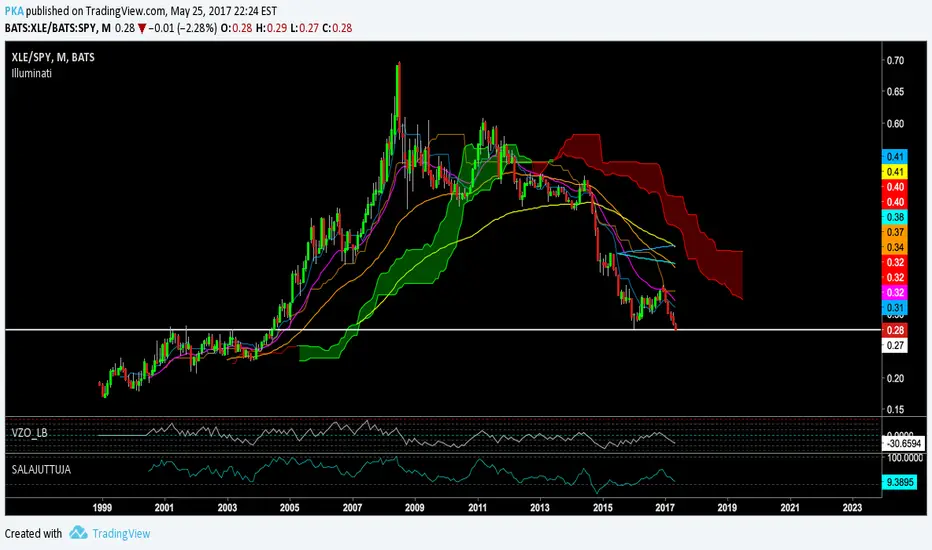
I really can't tell you how far it can go as this sector is really suppressed right now. If the sentiment is changing it will need to work down the divergence between the energy sector and the SM what is at all time highs.
So I really think this rally will be not just big but a very fast surge with all the analysts and traders trying to short it who missed the bottom.
Their stops will accelerate this move.
I will be watching closely the indicators:
The RSI should get overbought in the following months plus MACD neeeds to cross over and head higher.
And the SlowStochastic needs to get overbought and stay there for weeks...
The volume is really good for a reversal again. Notice how the volume spikes signed the previous bottoms in the past.

Neutral trade on XLE (Iron Condor)With IVR at 26 sold the Iron condor 70/73/66/62.5 on XLE with 37 Days to expiration
The Trade:
Short 70 Call
Long 73 Call
Short 66 Put
Long 62.5 Put
Credit = $1.11
55% probability of profit


ERX / XLE - Waiting for GodotI know it looks like never want to break to the upside.... But at the end of a day it will.
I see a head & shoulders pattern under construction. I have corrected the trendline : on the 18th of May we had a trendline back test.
Our key level is: 68.88$ . Once we slice through that level we will be sitting on one of the biggest bull train of this year.
Patience. Our day is coming.

XLE Long OpportunityWaiting for an entry at XLE, its very hard to break the downside channel and start plummeting imo. Good for a mean reversion play here.

TRADE IDEA: XLE SEPT 15TH 57/JULY 21ST 67 PMCC** -- Poor Man's Covered Call.
One of the few sectors that hasn't benefited from the post- November election run-up is XLE, so I'm looking to get into a bullish play here where price of the underlying is comparatively low.
Here, I'm basically looking to emulate a full-on covered call using a deep in the money call in September to stand in for stock, 100 shares of which would be somewhat pricey here, comparatively speaking. A covered call with the same short call would cost 64.56 to put on; the Poor Man's shown here is far less than that. Additionally, if you're looking to acquire XLE shares at some point, the setup gives you the flexibility to reduce some cost basis up front before acquiring the shares, after which you can exercise the long call instead of being stuck with shares with a cost basis of 64.56/share here, as you would be with a covered call here.
Unfortunately, as a form of diagonal, there aren't many metrics to look at, but this is what we do know about the setup:
Max Loss/Buying Power Effect: 7.21
Delta: 61.59
Theta: .75
Generally, you work it like a covered call, rolling the short call out to reduce cost basis in the long aspect of the position. However, on break of the short call, your long call won't be subject to "call away" as it would be with stock; in that event, look to exit the trade profitably and redeploy or roll the short call up and out for a credit if you want to continue to reduce cost basis in the long through expiry.
Notes: The pricing of the setup will probably be different during the regular NY session. I'm working with off hours quotes here, and the bid/ask on the back month is particularly wide here, so overall pricing of the setup may be inaccurate.


Energy Sector Bounce! Hey Traders, We are seeing a setup for a possible trend reversal in Energy. I recently posted an idea regarding energy and in that idea, I explained why a new micro trend may be beginning. I am seeing the same setup again and have entered a long position to take advantage of another micro trend.! Be sure to check out my previous idea "Energy Sector Rally! New Micro Trend Beginning" (Idea linked below). All of the same signals are happening here again! There is also a possible Bearish Cypher Pattern that may complete near $68.30. I will be taking a smaller target for this reason and may even decide to flip the trade to a short if my target is met.
Entry- 67.85
Stop Loss- 67.40
Target- 68.30
New Gold and Silver analysis coming soon. Good luck Traders!

XLE Possible ReversalI will be looking to enter a long position if the next push of sellers fail to move the price lower than the previous support level.

XLE Inverse Head and ShouldersWe can see an inverse head and shoulders pattern on the hourly chart. Due to the weekly macd negative momentum and the longer term downtrend, I would think it's more likely for price to consolidate for a bit rather than move higher right now.

Energy Sector about to Drop! Good Short Term Trade Setup!Hey Traders, XLE is currently at a major level of Resistance and has a shooting star candle on the 1 hour chart. Also price is being rejected by the 20 period SMA. This is a high probability setup! Lets see how it plays out as there may be many things to learn from this trade..
Entry- 66.80
Target 1- 66.20
Target 2- TBD
Stop- 67.40

Energy: an outperformer to come?The Energy sector has been "hated" by investors for a while. However there maybe an opportunity for that sector to outperform the S&P500. XLE, the Energy ETF, is down by 13% since mid December 2016 and back to its lows of 2016.


XLE/ERX - Trend line attackI'm not satisfied with the performance of our XLE and ERX position. Sooner or later the rally will start here also... The more time we spend below the purple trend line the bigger breakout will come. On the 4th of April we broke above the trend line but lost it in a week. On the 4th of May we printed a new low in this decline on very high volume. Most probably that day was the bottom. If stocks are printing a correction during the next 2 weeks - unlikely - we might test back 65.82$...
I think when we break above the purple trendline again that will be a valid breakout and the great rally in oil stocks will start finally.
I will try to trade some individual stocks also. There will be stocks which will print 4-500% rally in the next 3-4 months.
I think ERX also has a good chance of printing a 200-300% rally.
All the indicators (MACD, TSI, SlowStoch) are showing a divergence. I'M preparing for 2 scenarios:
1. We are churning around the trendline for a few more days and breaking out
2. we test back the lows at 65.82$ and a monster rally is coming out of the double bottom.
Nasdaq, S&P, Dow Jones at all time highs. I see zero chance that oil stocks will miss this rally.
XLE 20 Day MVA Decision PointLooking at the past few months on the downtrend. When price reaches the 20 day MVA (red line), it either pushes higher to the 50 day MVA or pushes lower to a lower low. I will be looking for price to move higher or lower from it's current position with those targets in mind.


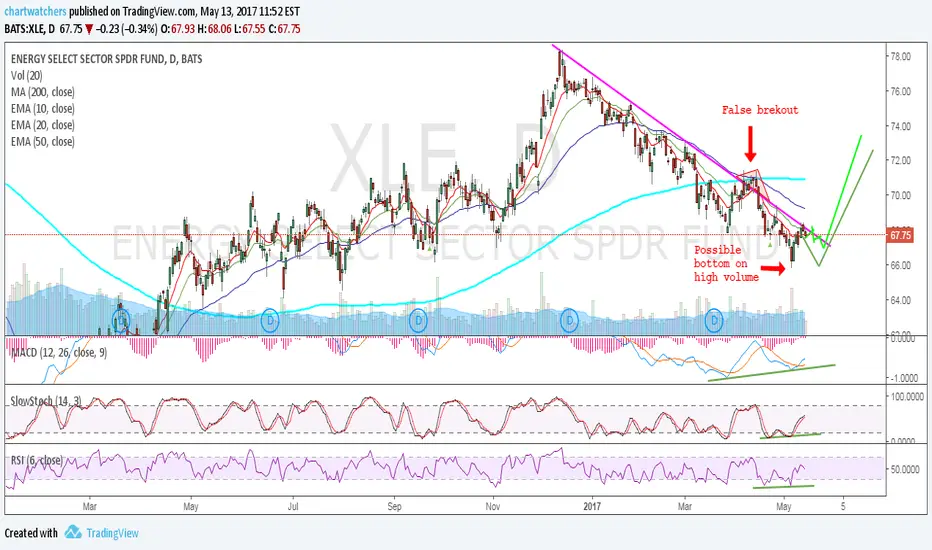
XLE False Break Downwards?XLE appears to have just gone through a false break downwards and returned back to the important 67.7 level. I would expect this price to continue up to around the 68.9 level, as that appears a good spot where the price will meet the 50 day mva and is also a monthly pivot level. Right now, I would expect price to continue heading higher or meet a little bit of resistance at the 67.7 level before heading higher.
