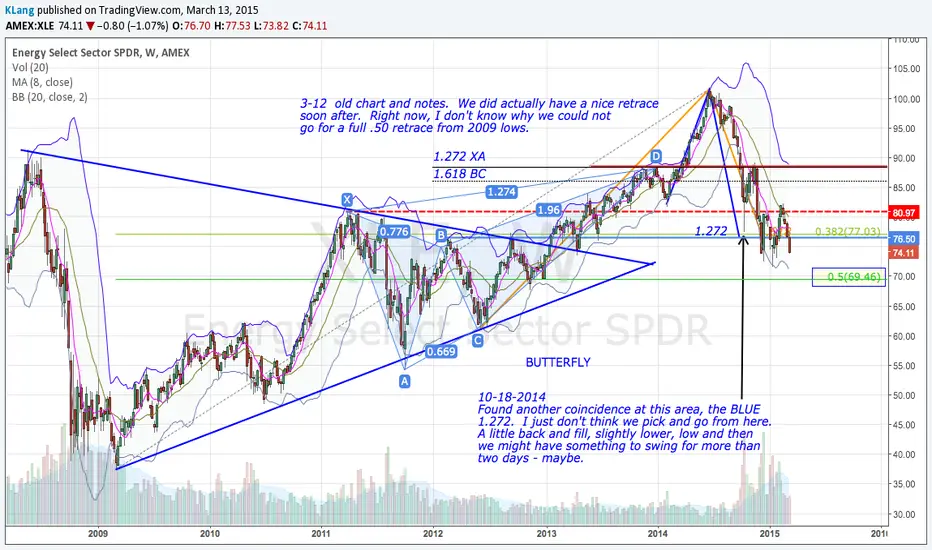
Potential Aggressive C buy - Harmonics setup towards FOMCThe Head and Shoulders pattern I mentioned on my latest analysis for XLE has reached its final target level and now we have an option for an Aggressive Bullish C entry in a bearish Bat pattern (yellow).
This setup basically means that you buy the C point in what could turn out to be a bearish Bat pattern, aiming towards the D point (near 80$) as longer term setup. The 65-68$ zone must be considered also as target zone as the price should meet the downtrend line there if indeed it'll rally from the 60$ support zone.
Stop loss should be with some safety distance below the A point. In the chart I'm showing an example of 3.5% Risk with potential 10% reward (almost 3 R/R ratio).
Despite the potential bullish setup, we don't know that the price indeed intend to rally towards the D point so there's definitely a good chance that $XLE will continue lower and break below 58$ so you have to consider this risk.
Tomer, The MarketZone
This analysis is part of the Weekly Markets Analysis newsletters
To read more interesting technical reviews for the week goo.gl
To subscribe to the newsletters - goo.gl
Follow my blog - goo.gl
Subscribe to my Youtube channel - goo.gl
XLE trade ideas

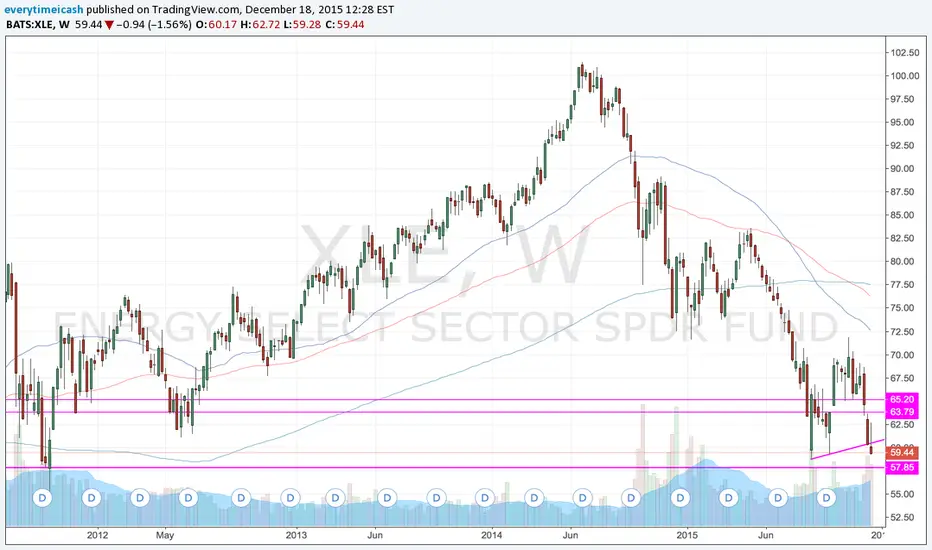
XLE(Daily). Triple Bottom, H&S Target reached.Head and Shoulders pattern Target reached, Potential Triple Bottom pattern(non-Ideal), holding above Support 59 level, potential Bat pattern, Gap fill possible, before C wave.

$XLE Triple Bottom Long Setup$XLE is showing a triple bottom set up with several bullish momentum divergences.


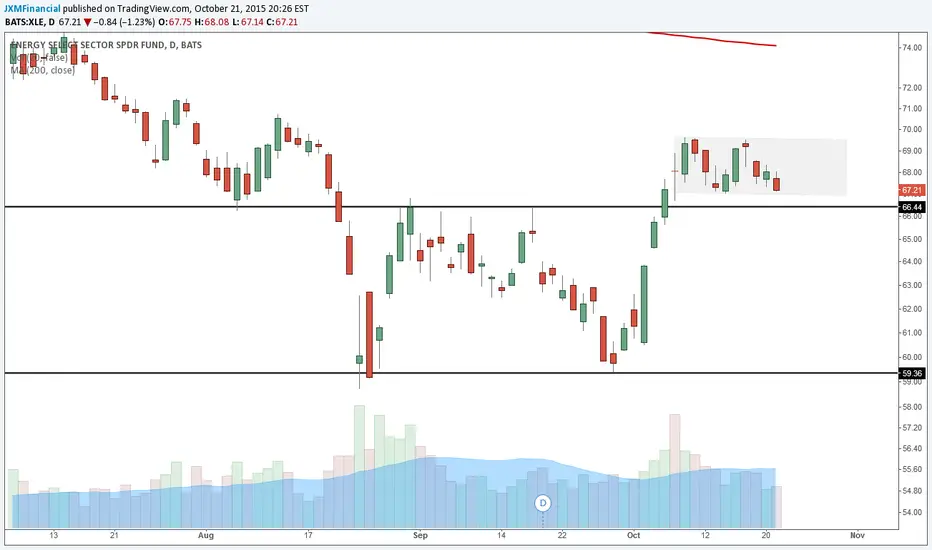
Short energy with dollar rallying into rate hike weekDaily wicks point to down move to retest prior lows, use top of wicks as stop to cover

XLE, triple RSI bullish divergence?For each major dip, i saw a plateau. However the plateau is getting smaller. Does it means that Sellers no longer wants to sell and buyers have thrown in the towel?
Quite a handfuls of energy stocks are showing bullish divergences as well i believe

MACRO VIEW: XLE AT MACRO UNCERTAINTY, ON DOWNTREND RISKEnergy SPDR ETF is at macro uncertainty with a prospect of continued fall (much like the oil market)
On long term basis - XLE is trading below its 10-year mean at 68.5, signalling uncertainty - as price close to a long term means indicates an outlier event, with institutional traders unsure of what to do with the stock. The price is also close to a potential macro downtrend, as it trades close to 5-year downtrend border at 66 (lower 1st standard deviation from 5-year mean)
On short term basis - XLE confirms the downward risk, as price is trading very close to 1-year downtrend border at 67.5 (lower 1st standard deviation from 1-year mean). Thus if price falls below 67.5 it will have good probability of falling below 66, entering a downtrend on 5-year basis.

Technical Short XLE Entered this short yesterday. Well the reason for this short is explained on a Daily chart that I will post in the body of this post...Also, price has remained below the 9MA on the Weekly Chart. Holding the trade until target is reached around the support area, cancelling the trade at a loss if price breaks above 70 / 71 .
Good luck and cheers!

XLE Broke Significant Support on Crude Price WoesPlease check out the full article here: oilpro.com
The Energy Select Sector SPDR® Fund (XLE) has been battered, and it is starting to bruise.
With the price of crude now just hovering $43 per barrel, this exchange-traded fund (ETF) is likely to get a whole lot cheaper.
This fund has support near-term because Wall Street is discounting recent events in the oil industry, as they did during the second-half of 2014. It also pays a dividend of 2.93 percent (SEC 30-day).
Thinking back, the Federal Reserve's call that lower gas prices (via lower oil) was "unambiguously good" is striking a nerve with those laid of in the energy sector, which shed nearly 68,000 jobs last month alone.
With a technical perspective, the XLE has confirmed downside weakness with a close below the major support trend created on 2009's bottom.
The trend's momentum could weakening slightly as traders fish off the bottom, but the strength of the trend still remains quite strong - ADX over 20 and a substantial divergence between +/-DMI.
Near-term range for XLE is $64.39 and $71.46, while a "relief" rally could spark buying up to $74.12; but, crude would have to play nicely.
If current price support breaks, XLE will trend lower within the disjointed angle (purple dotted line with grey shaded body), which represents widening support and resistance.
Additionally, the "death cross" is close to completion on the weekly chart. This bearish technical signal occurs when the 50-week moving average dips below the 200-week moving average.
At $43.27/bbl, crude is less than $2.00 about its inflation-adjusted price.
Please follow me on Twitter @Lemieux_26
Check my posts out at:
bullion.directory
www.investing.com
www.teachingcurrencytrading.com
oilpro.com
Low cost trading solutions:
www.fiverr.com

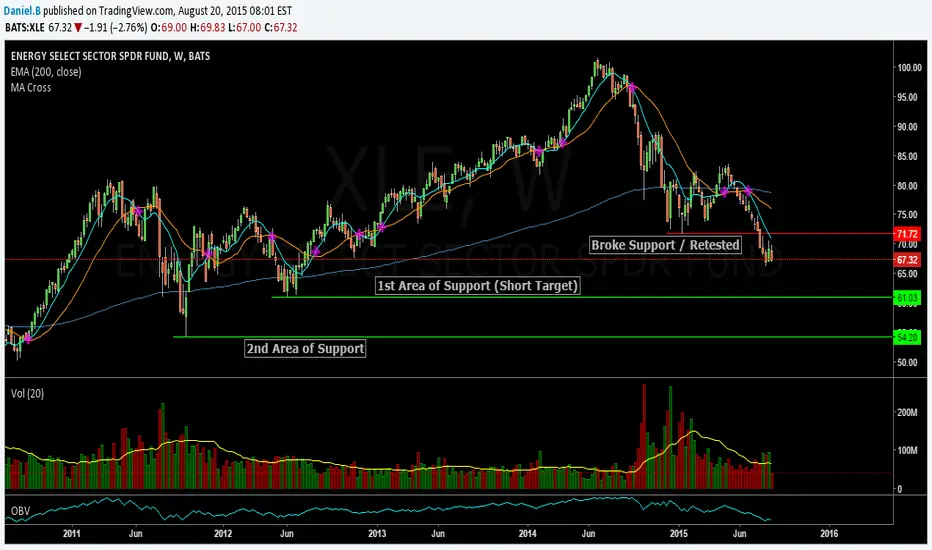
Energy Select SPDR -XLE - Daily/Weekly BEARISH WEDGEThe falling volume through the rally coupled with the rising, converging trend lines could be a sign that XLE is going to re-test the lows and potentially drop far under the lows.
In order to enter this trade though, I'd like to see XLE fall under the wall of volume at the 80 level and breach 79.5 before going short. You can sell on weakness below 79.5 and on rebounds to the 80 level and target the 72-71 level within a month. Typically wedges only need 1/4 of the time of the wedge to completely retrace.
The rally can be assumed to be a short squeeze, which is what falling volume is trying to tell us. If there really aren't buyers supporting this advance, then XLE can just fall on low volume. You don't need to see expanding volume on the downside in order to stay in this trade once short (breaking 79.5), but you do want to see the the market break 78 within one week once in the short. Look for 76.5 to be a big wall of support for a bounce, then once under 76.50, look for 75, then 72 as key levels of support.
Tim 1:31AM EST Thursday May 14, 2015


XLENotes on chart. As I do think there is a SHARK on USO, target not yet met - I wouldn't be surprised to see a bit taken back here - especially with everyone so bullish here. I don't see a pattern calling for it - but certainly would not
establish a long now.

Xle time to turn back down? I've been waiting for this nearly two weak, two weeks ago I found out there was a gap at 82 area. Now, the is filled already, also, the chart looks a little lit exhausted to run up. The M top could be exited here. To be honest, I could be wrong. But, anyway 1st target 79.

XLE $82.98: Formed a 5-month base on breaking above 82.43XLE formed a 5-month base over 71.70 on breaking above the 82.43 range ceiling (February 16, 2015), triggering further bullish momentum towards the next resistance levels including 85.97 (March 10, 2014 higher low) then 89.22 (November 17, 2014 lower high). The immediate support levels are 80.30 (21 week moving average) and 79.21 (April 13, 2015, near 200 week moving average) which should hold dips.
Outlook:
Short term: Buy on pullbacks
Long term: Bullish

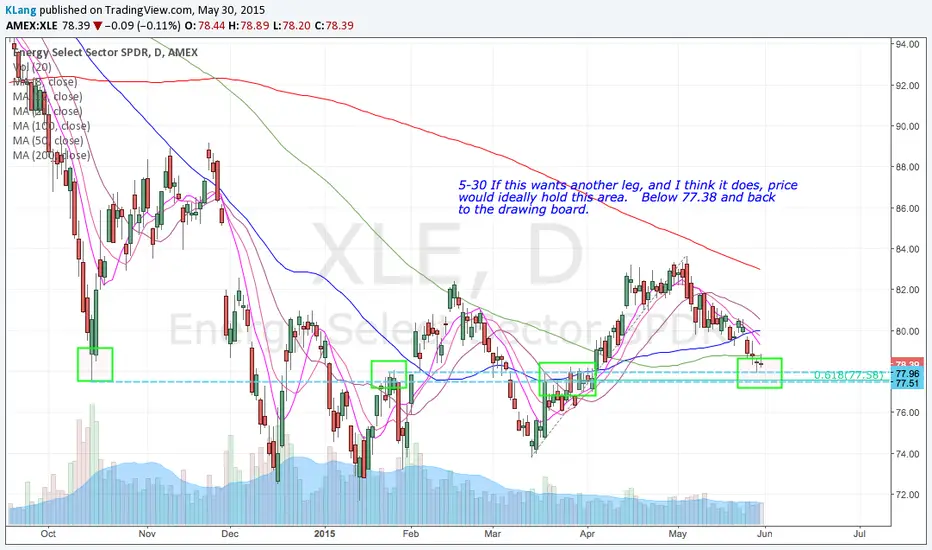
XLE - Signs of recovery?Rising 20, Rising 50, 20/50 cross - all good signs. Watching 50 MA to support
XLELong term move up on XLE...not the down trend link is at the 200 dam. This ETF can be a good play as oil bottoms and may continue to old highs using options I have a Jan 16 Call LEAPS that is 7.25 and expires 3rd week of Jan 16..the BE for this to break-even is 87.25...current projections show much faster advance to that point, however that is if all keeps going like it is ...that never happens but best probable guess

XLE - Interesting Trendlines Confluences. This is interesting, Explains the recent chops in the Market and Energy stocks.
If this so called bottom in oil any good, then we should see some improvement in this sector, along with this HUGE sector, the market will get better.
Apart from this chart - DIA - Broke out. MDY - Broke out. The next is SPY ? we shall see.
-------
as a note to fellow traders, At any given point in time, you should know where the Sectors are. This should drive your trading decisions. Not a news article, that says, "oh Oil is at the bottom, buy them"

At resistance zone and in the PRZ of a small harmonic patternFrom this week's Weekly Markets Analysis.
The aggressive bullish C entry near 73$ was successful and now we are at resistance.
Will it make a small pullback before the rally to complete the bigger pattern?
In case of a pullback - 75$ will be a good target level
