XLK ETF. TO WAR, OR NOT TO WAR — THAT IS THE QUESTION..US stock futures edged lower Wednesday evening ahead of Thursday’s market closure for Juneteenth.
The moves came after the Federal Reserve held interest rates steady, with Chair Jerome Powell striking a cautious tone amid rising geopolitical and economic uncertainty.
Powell reaffirmed a data-dependent approach, pointing to unclear inflation impacts from President Trump’s tariffs and the risk of stagflation.
Fed projections now include two rate cuts in 2025, alongside downgraded growth expectations and higher inflation forecasts.
Investor sentiment was further dampened by escalating tensions in the Middle East, as the ongoing Israel-Iran conflict stoked fears of deeper US involvement, while North Korea has recently launched 10 rockets from near capital Pyongyang.
Futures for 7 of the 11 S&P 500 sectors ended the Prime Day holiday in the red, led by declines in energy, while technology outperformed.
What is more important Technology sector is the one and only over 11 S&P 500 sectors that has printed recently new all the history high, just one - two days before Prime Day.
What is XLK The Technology Select Sector SPDR Fund ETF
AMEX:XLK ETF is respectively The Technology Select Sector ETF, that seeks to provide investment results correspond generally to the price and yield performance of the S&P 500 Technology Sector Index.
The largest 5 holdings of this ETF are Microsoft NASDAQ:MSFT , Nvidia NASDAQ:NVDA , Apple NASDAQ:AAPL , Broadcom NASDAQ:AVGO and Oracle NYSE:ORCL , while all together they weight nearly 50 percent of the fund by market cap.
Microsoft NASDAQ:MSFT shares have experienced a significant upward trend in 2025, reaching new all-time highs and reflecting the company’s robust financial performance and strategic positioning in the technology sector.
Record Highs and Price Momentum
As of June 18, 2025, Microsoft’s stock closed at $480.24, marking its highest closing price ever. This price is just below its 52-week high of $481.00 and represents a 14% gain year-to-date, making Microsoft one of the best-performing stocks among the so-called “Magnificent Seven” tech giants in 2025. The stock’s average price over the past 52 weeks was $422.77, and its 52-week low was $344.79, which is 28.2% below the current level, highlighting the impressive rally over the past year.
Short-Term and Long-Term Performance
In the immediate term, Microsoft’s stock has shown steady gains. Over the past week, the share price rose by 2.03%, and over the past month, it increased by 6.36%. Looking at a broader horizon, the stock is up 6.79% over the last year, underscoring consistent investor confidence and the company’s ability to capitalize on growth opportunities.
Drivers Behind the Rally
Several factors have contributed to Microsoft’s recent share price surge:
Artificial Intelligence Investment. Microsoft continues to invest heavily in AI infrastructure, with plans to spend $80 billion in fiscal 2025. This aggressive investment is seen as crucial to maintaining a competitive edge in cloud computing and AI services, areas that are driving much of the company’s growth.
Cost Management. Despite the heavy spending on AI, Microsoft is also focused on controlling costs. The company is reportedly planning to trim thousands of jobs, particularly in sales, to offset rising expenses and protect profit margins. This follows earlier workforce reductions and reflects a broader trend among major tech firms to optimize operations amid escalating AI-related costs.
Diversified Revenue Streams. Microsoft’s strong position in software, cloud computing, and AI, along with its subscription-based business model and consistent dividend growth, have bolstered investor sentiment. The company’s cloud platform Azure and productivity tools continue to show strong adoption across industries.
Market and Analyst Sentiment
Microsoft’s market capitalization recently reached $3.55 trillion, with a price-to-earnings ratio of 36.94, indicating high investor expectations for future growth. Analysts’ price targets for MSFT range from $432 to $700, suggesting a wide spectrum of views but generally positive long-term sentiment.
Competitive and Operational Challenges
Despite its strong performance, Microsoft faces competitive pressures, particularly from OpenAI, which has been offering discounted ChatGPT subscriptions, impacting Microsoft’s own AI products like Copilot. Additionally, negotiations with OpenAI over continued access to its technology have reportedly stalled, introducing some uncertainty into Microsoft’s AI strategy.
Technical challenge and summary
While Microsoft shares have recently hit record highs, driven by aggressive AI investment, disciplined cost management, and strong core business performance, it robustly helped to all the Technology sector came back to 6-month key resistance after nearly 40 percent recovery rally.
While the market faces different challenges, we keep our strategic focus on next positions and further stock market development.
--
Best wishes,
@PandorraResearch Team 😎
XLK trade ideas

Technology ETF Flirts with New HighsTechnology stocks have been coming to life recently, and some traders may expect new highs soon.
The first pattern on today’s chart of the SPDR Select Sector Technology Fund is last July’s peak around $238. As the fund retreated from that level, it began a period of underperformance. (See ratio chart in the lower study.) The weakness continued through April, when it started to outpace the broader market again.
Second is $240.84, the final price on December 6 and the highest weekly closing price ever. XLK is on track to potentially surpass that level, which could confirm a breakout.
Third, the 50-day simple moving average (SMA) is nearing a potential “golden cross” above the 200-day SMA. Is the longer-term trend turning bullish again?
Finally, price action in this fund could be important for the broader market because technology represents almost one-third of the S&P 500 index.
Standardized Performances for the ETF mentioned above:
SPDR Select Sector Technology ETF (XLK)
1-year: +9.87 %
5-years: +135.69%
10-year: +432.42%
(As of May 30, 2025)
Exchange Traded Funds ("ETFs") are subject to management fees and other expenses. Before making investment decisions, investors should carefully read information found in the prospectus or summary prospectus, if available, including investment objectives, risks, charges, and expenses. Click here to find the prospectus.
Check out TradingView's The Leap competition sponsored by TradeStation.
TradeStation has, for decades, advanced the trading industry, providing access to stocks, options and futures. If you're born to trade, we could be for you. See our Overview for more.
Past performance, whether actual or indicated by historical tests of strategies, is no guarantee of future performance or success. There is a possibility that you may sustain a loss equal to or greater than your entire investment regardless of which asset class you trade (equities, options or futures); therefore, you should not invest or risk money that you cannot afford to lose. Online trading is not suitable for all investors. View the document titled Characteristics and Risks of Standardized Options at www.TradeStation.com . Before trading any asset class, customers must read the relevant risk disclosure statements on www.TradeStation.com . System access and trade placement and execution may be delayed or fail due to market volatility and volume, quote delays, system and software errors, Internet traffic, outages and other factors.
Securities and futures trading is offered to self-directed customers by TradeStation Securities, Inc., a broker-dealer registered with the Securities and Exchange Commission and a futures commission merchant licensed with the Commodity Futures Trading Commission). TradeStation Securities is a member of the Financial Industry Regulatory Authority, the National Futures Association, and a number of exchanges.
TradeStation Securities, Inc. and TradeStation Technologies, Inc. are each wholly owned subsidiaries of TradeStation Group, Inc., both operating, and providing products and services, under the TradeStation brand and trademark. When applying for, or purchasing, accounts, subscriptions, products and services, it is important that you know which company you will be dealing with. Visit www.TradeStation.com for further important information explaining what this means.

XLK Breaks All-Time High – Will It Stick the Landing or Soar?AMEX:XLK just broke into new all-time high (ATH) territory — barely — but the move is worth watching.
The breakout came on the heels of a strong bullish candle in the first week of June, followed by a doji last week, and now we're seeing fresh bullish momentum early this week with a gap-up.
➜ The big question:
Will XLK continue to hover just above the ATH, or finally break through with conviction?
This move could set the tone for tech stocks this summer, especially if we see confirmation like we did with NASDAQ:MSFT — which broke its ATH on June 6 and hasn’t looked back.
➜ Watching for:
➲ Continuation above ATH
➲ Potential summer trend leadership
➲ Confirmation from big names in the sector
#XLK #techstocks #SPDR #technicalanalysis #breakout

XLK/SPY above the 200 WeekXLK/SPY has crossed above the 200 week moving average, secular bull market of tech is back? Might be time to get long tech to not miss the rally if it happens. Tight stop whenever tech loses its 200 week on the ratio.

Bearish XLK: has been underperforming for a while now......made a rounding top starting December, trapped the bulls on a 3-day bullish island reversal in January. Ended up in the middle of July '24 gap down.
Negative YTD, under the VWAP from the top. It was never about NVDIA or DeepSeek news.

Indices quant zones, expression can be through nasdaq 100already have slight bull flow
in the event of a flush on market opens,
look for momentum slow and buy around these zones
expression can be through nasdaq 100
Check out our socials for some nice insights.
Let us know if there're any pair you like to see or if this is something you like.
Do ask if you have any question
Not as refined as our direct trade setups. More for advanced active traders.
information created and published doesn't constitute investment advice!
NOT financial advice

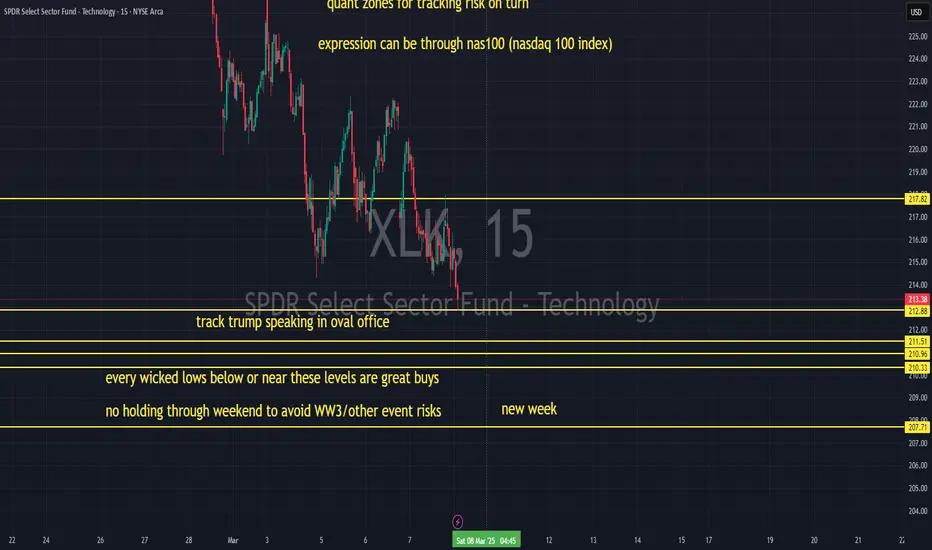
quant zones for tracking risk on turnevery wicked lows below or near these levels are great buys
no holding through weekend to avoid WW3/other event risks
expression can be through nas100 (nasdaq 100 index)
track trump speaking in oval office
momentum still strong. wait for momentum dissipation
quant zones for tracking risk on turn
Check out our socials for some nice insights.
Let us know if there're any pair you like to see or if this is something you like.
Do ask if you have any question
Not as refined as our direct trade setups. More for advanced active traders.
information created and published doesn't constitute investment advice!
NOT financial advice
Techonology relative strenght does not look promisingAMEX:XLK XLK has been lagging and the Relative Picture agains SP:SPX does not look promising. The triangle-like pattern is not good for the sector that has been the fuel for the stock market.
Not a short view yet for me, but a cautious one.

Tech stocks looking tired, more downside probableSince having reached the area near the all time high, the ratio of XLK/SPY has been in a pullback.
It looks like this might continue until we reach the bottom of the uptrend channel from where it could resume its uptrend to complet its 5th wave higher.
MACD and RSI are showing serious bearish divergence.

Technology ruled 2023 and 2024. What will lead future 2025?🚀 Technology ruled 2023 and 2024. But what will lead the future in 2025? Discover the next big boom! 🌟

Introducing the Safe Risk Advisor SystemIntroducing the Safe Risk Advisor System: Combining Fundamentals and Technicals for Long-Term Success
Hello, fellow traders and investors!
I’ve been part of the trading world for several years and have honed my approach to focus on "Weekly Trend Following" and medium-to-long-term investments, rather than the more common short-term strategies. My goal is to share insights from my unique system, the Safe Risk Advisor System , which combines the best of fundamental analysis and technical analysis (Elliott Wave Theory) to identify high-quality investment opportunities.
Key Features of the Safe Risk Advisor System
Sector Analysis:
Objective: Identify sectors likely to outperform the S&P 500 over a medium-term horizon (several months).
Method: Using Elliott Wave Theory, I pinpoint sectors in confirmed upward trends.
Traffic Light System:
Example Application: I’ve applied this approach to the technology sector and would love to share charts and insights to demonstrate its practical use.
Stock Selection:
Fundamental Analysis:
Inspired by the principles in the book Valuation, I use fundamental ratios to identify high-quality stocks with long-term growth potential.
Elliott Wave Theory:
Helps avoid premature investments during downtrends.
Guides entry timing based on impulsive wave patterns (1, 2, 3, 4, 5).
Wave 5 serves as a signal to reduce exposure and seek new opportunities.
Risk Management with ATR Channels:
ATR Channels play a vital role in identifying trend strength and managing risk effectively.
Why Follow My Insights?
If you’re interested in strategies that blend long-term vision with the precision of technical tools, my system might offer you a fresh perspective.
I’ll be sharing regular updates, including sector analyses and actionable ideas, designed to empower traders and investors with a focus on sustainable trends.
What’s Next?
I’m currently writing an eBook that outlines the Safe Risk Advisor System in detail. My ambition is to bridge the gap between fundamental and technical analysis to create a comprehensive guide for long-term investors.
Follow me for more updates, and let’s explore opportunities in the market together!
Happy trading! 🚀
Carlos Resendes

XLK - still bullish in a 5th waveSome nice Elliott Wave Fib measurements and alternation on this count and a somewhat clear wave count. Is this a possible route for this tech etf? This count suggests a bullish count but I guess the real question is how high can it go....

Double Top on Tech?Technology stocks had a strong first half but could be ending the year on a weak note. Is the sector finally losing its leadership?
Today’s chart of the SPDR Select Sector Technology Fund highlights the July 10 closing high of $237.68. XLK stalled around that same level a week ago, resulting in a potential double top on the fund.
Second, prices have slipped below October's closing high of $233.73. That stands in contrast with other big sectors like Communications, Financials and Consumer Discretionaries.
Third, relative strength in the lower study shows fading leadership in technology versus the broader market.
We end with a look at Nvidia NASDAQ:NVDA , which has been a major driver of the sector this year. Notice the sharply rising lower trendline and the higher trendline with less of an upward slope. That kind of rising wedge is a potential reversal pattern.
It could also raise the stakes headed into NVDA’s big earnings report after the closing bell next Wednesday, November 20.
Standardized Performances for the ETF mentioned above:
SPDR Select Sector Technology ETF (XLK)
1-year: +35.50%
5-years: +165.61%
10-year: +448.20%
(As of October 31, 2024)
Exchange Traded Funds ("ETFs") are subject to management fees and other expenses. Before making investment decisions, investors should carefully read information found in the prospectus or summary prospectus, if available, including investment objectives, risks, charges, and expenses. Click here to find the prospectus.
TradeStation has, for decades, advanced the trading industry, providing access to stocks, options and futures. If you're born to trade, we could be for you. See our Overview for more.
Past performance, whether actual or indicated by historical tests of strategies, is no guarantee of future performance or success. There is a possibility that you may sustain a loss equal to or greater than your entire investment regardless of which asset class you trade (equities, options or futures); therefore, you should not invest or risk money that you cannot afford to lose. Online trading is not suitable for all investors. View the document titled Characteristics and Risks of Standardized Options at www.TradeStation.com . Before trading any asset class, customers must read the relevant risk disclosure statements on www.TradeStation.com . System access and trade placement and execution may be delayed or fail due to market volatility and volume, quote delays, system and software errors, Internet traffic, outages and other factors.
Securities and futures trading is offered to self-directed customers by TradeStation Securities, Inc., a broker-dealer registered with the Securities and Exchange Commission and a futures commission merchant licensed with the Commodity Futures Trading Commission). TradeStation Securities is a member of the Financial Industry Regulatory Authority, the National Futures Association, and a number of exchanges.
TradeStation Securities, Inc. and TradeStation Technologies, Inc. are each wholly owned subsidiaries of TradeStation Group, Inc., both operating, and providing products and services, under the TradeStation brand and trademark. When applying for, or purchasing, accounts, subscriptions, products and services, it is important that you know which company you will be dealing with. Visit www.TradeStation.com for further important information explaining what this means.

The best performing sectors under Trump's 1st administrationHere's the best performing sectors during Trump's 1st Presidential administration. (Nov. 2016- Nov. 2020) XLK +152% AMEX:XLY +97% AMEX:XLV +64%

Switched out long XLK to a short 220.95Ok guys that was sweet rally time get out and short again
look daily stoch rolling over look vol decreasing look candle
look watch see 50 day cross down thru 100
look weekly stoch wants to roll down
Looking for sell off in rate cut maybe down 208
Then boom rally till election

Long XLK 206.35 Target 240Look daily chart look stoch on bottom turning up. Look candle saying buyers came in see the wick on daily candle, Vol not bad still more sellers. Nice swing trade long
240.
Know the kicker we rallied on AI like madness
rallied on Rate Cuts well gonna get them so rumor cut fact sell so they sold into it like I said it would fed cut means economy hmm not doing well and its not guys and the cuts creates inflation labor jobs suck inflation high defect out control getting worse banks broke about collapse More tech lay offs coming.
So I see after election after xmas 2025 or after election a major a major CRASH in tech and market I mean Major shits going to hit fan wont happen during election guys listen to charts banks are BROKE. For know riding the train up. Also the cut PLAY PLAY GLD gold higher dollar crashes. So Bull its about over enjoy 2024 last attempt 600

XLK Crossover IdeaAMEX:XLK
Standard crossover idea:
Buying at open so long as we open or push above yesterdays close.
Looking at an Oct contract
Oct18 215c for roughly 9.7 (I'll try to buy at the mid)
Using the ATR of 5.7 -
SL: 215.89 (just below YLOD and 100d SMA)
TP1: 227.37 resistance
TP2: 232.17 supply zone test
TP3: 238.12 ATH's test
Max Date: Market open of 9/25/24
**As always, if targets are not met by max date, I will exit full no matter the p/l.
Also keep in mind that there are certainly more catalysts ahead next week with the rate decision.

Short XLK @ the 50 day ma 221.28Hey guys what a week huh SPY target was 454 then they came out with saying the consumer u and I are resilient and Walmart rallied cause U and I are going their instead other stores cause why it cheap u clowns and last week 4 small banks come out say they are 4 billion in debt no one paying it back lot on car loans etc. So lets see how far we pull back or see do we give it all back their is a very very good chance we do hit 91 again XLK .
Shorted why lower highs and vol heading down as we go into the 50 day MA.
Know this can go higher how stock buy backs lets just see though we drop from here that gonna make another lower high on all indices. Comments welcome
I like to thank all that follow me I try give best TA information I can I would not be buying up here I swing trade.

XLK - possible opportunity but don't plant all your seed at onceTime to start accumulating some XLK? I think so. With the 200-day on the yearly chart being breached, I believe this a good entry point. Buyer be aware, painful times may be ahead. Going with weekly purchases on this one for dollar cost averaging. Quick spike up my result in a quick sell on my end but I’ll also welcome ongoing movement down.
From a technical standpoint, the last time XLK breached the 200-day was August 5th. It quickly recovered. From a guessing standpoint, I don’t see this happening again. I’m thinking a sideways movement from here until November (excellent candidate for the wheel) or more downward pressure. Beyond this current area, next major support is the $190ish range.
I added Volume Profile to the chart. Still learning this one but wanted to leave it on. Comments are welcomed as to what you see, especially with Volume Profile.
I am not an attorney, accountant or financial advisor, nor am I holding myself out to be, and the information contained in this post is not a substitute for financial advice from a professional who is aware of the facts and circumstances of your individual situation

XLK vs SPY shows key break throughThe tech sectors sell off we experienced over the past month looks to be coming to a close
In multiple tech giant ETFS (XLK and SMH) are seeing breakthoughs of the past months violent sell off
comparing XLK/SPY we see that the recent downtrend has broken
The pair setup had reached level of support which it hit this time last year
Since September is typically a rough month we should not expect any big rallies during the next month or so.
Do not expect any rally to start until atleast October possibly early November
Anticipate market trades flat overall for next month or so.

Shorted XLK Small 217.50app.screencast.com
Look Daily under the 50 day lower highs more selling buying yes selling getting less that why I am small like see 221.68 stop drop into the 50 day ma
look weekly stoch perfect just starting this thin can drop 205 or 193

My positions on SPXL IWM XLK SQQQHey guys in video I said that it wait there more I said it twice chart updated in middle video. Enjoy comments welcomed disagree please explain TA wise if not keep to yourself
Guys markets in Trouble and its caused by tech NVDA. Be ready short

Tech vs Real World StuffTech vs Real World Stuff indexes. Trying to determine if markets are quietly rolling over.
