Bitcoin Grabbing Lower Liquidation For Higher Price.Bitcoin Grabbed the high leverage longers and now is ready to go higher.PPI today could bring more volatility to the market.Still rooting for 32K.could happen today or tomorrow then a drop in volume on weekends like always.
thanks for watching
BVOL24H trade ideas

Hold the line! What to know about this BTC breakoutBitcoin with a strong breakout. We would want to see the key fib areas here generate some kind of bullish market action.
- morning star
- bullish hammer
- SFP of a local fractal low
Breakdown here and a lower low from the start of this market structure break could put the breaks on this move and at least result in more consolidation before then either breaking down or breaking up.
Targets for a bullish move would be -0.272 and -0.618.
Letsss gooo!

how will Bitcoin unfold in the future?This wave of market should be said to be a very typical war example. It took the bulls 2 months to create a bear trap, and finally the Jedi counterattacked, crushing the bears' defense in one fell swoop.
Some say it was a collusion between the SEC and Wall Street, and some even say Gary made a lot of money shorting Bitcoin. But these may not be confirmed, but from the technical trend review, we can still find a basis.
The correction that began in April has been a sudden setback, with one wave of lows being lower than the next. It looks as if the bulls are losing out. But the system's new features played a huge role this time. In order to cheat the line, the bulls caused MA144 to lose and the bottom neck line of the head and shoulders was worn through the illusion. But we can clearly see with the chart pattern hint function that this is a standard descending wedge trend, and finally stops falling at the wedge support line.
We all know that in some key support technologies, there is a false breakthrough standard of the deceptive line, generally no more than 3%. So this time, the main force of the bulls is familiar with it, and the dark position of the plank road is Chen Cang, and finally the goal of killing the bears is achieved.
A 20% increase in a week, although not much compared to a bull market, is still a good morale boost after a 2-month downturn. After all, global financial markets have rebounded recently, India, Japan have even come out of the big bull market, and even the Nasdaq has soared under the leadership of NVIDIA. The cryptocurrency circle has been plagued by the SEC suing Binance and Coinbase incidents, altcoin bulls fell apart, and the market wailed.
And the current long white candlestick at least keeps everyone hopeful.
But the market is not a welfare home, and trading is never charity. So we can't judge the market trend with emotion.
At the beginning of this rally, I made a judgment on the nature of the rebound, from the peak of $70,000, the market entered a bear market, theoretically, will use the ABC trend to complete the bear market correction (red line in the figure). This can be found in 2018-2019. Although history is not simply repeated, in a market that lacks fundamental support, chart movements are the basis for most investors' reference.
The adjustment of the 12-month history of 2021-2022 should be wave A, and then the rebound that opened is theoretically wave B, which should currently run in the third stage of wave B.
I thought this rebound was also the trend of ABC (gold line in the chart), and I thought that the high of the rally should not exceed $42200, where the golden section is 0.5. Of course, there are other technical indicators out there that form a suppression.
At present, from November last year to April this year, there is a clear 5 waves rising (purple line in the figure), followed by a 2-month correction, also 5 waves (blue line in the figure), I remember Elliott's wave theory for the definition of the rebound ABC trend, there is one, that is, if A is a complex wave, C may be a simple wave. So I judge that the trend of this C may be the ABC structure (123 of the dashed line standard in the figure).
Then there was a big C wave of decline.
This judgment is based on the following logic
1. Fundamentals, the SEC's lawsuit against Binance is actually an extension of the previous FTX incident, and the central issue is security. Whether altcoins are tokens or securities is also a question they need to solve. These questions are always the sword of Damox hanging over the head of the coin.
When we look at the end of the first two bear markets, they are also inextricably linked to fundamentals.
2015 was the beginning of the booming blockchain boom in China, with the emergence of blockchain companies, the issuance of coins, and the listing of exchanges became the norm, and Chinese exchanges monopolized more than 70% of the world's trading volume. It wasn't until 2018 that China began to drive away digital exchanges and the Bitcoin bull market ended.
In 2019, it was the issuance of US Bitcoin ETF contracts, and mainstream institutions entered the currency circle, taking over Chinese capital and becoming new Bitcoin players. And in March 2022, the Fed entered a rate hike cycle that became the end of a bull market, and Bitcoin once again entered a bear market cycle.
So in the next bull market, there should be a fundamental change, either the SEC will give a compromise plan for the legalization of the currency circle, or new capital will enter. In conclusion, it is difficult to judge the end of a bear market without these changes.
2. Technical, compared with the three bull and bear markets after 2011, although the time of each adjustment is about 12 months, the first two declines were 87% and 84%, and this time it was only 77%, which is slightly insufficient. The bear market in 2019 uses the ABC trend, although the latter wave of C has not reached a new low, but the amplitude is still large.
Based on the above analysis, I believe that it should be in the late stage of the big B wave rebound, if it cannot break through the golden section of $42,200 at 0.5, it is not ruled out to copy the trend of 2019 and fall again.

$btc Testing resistance. Watch for breakout above channel highs!Bitcoin is testing resistance at channel highs. Watch for breakout above 25k little resistance between 25 and 30 should it break higher.

One of The next big things could be AI driven Asset managment!Sam Altmans Tweeted:" The efficient market hypothesis is interesting not only because it’s widely believed and obviously untrue, but also because it becomes more untrue the more people act as if it were true."
I have no doubt they used their AI model and have Found a Significant Edge over the market!
Be Ready for the new generation of AI-driven Quants!
This could be a good time to review some of my previous posts!:

BTCUSDT LONG SETUP #BTCUSDT
ENTRY : around 25500
Targets : 25900 26500 27300 28600 30800 33200
Sl : 24650

Possible rejection for BTCI think a rejection from $28700-29250 area will happen, possibly a major one, up to 18-17k at least (uptrend + support - can support the upward movement).
Those resistances will represent an extremely important test for the fate of BTC's direction.

Onchain analysisGuys , I see some Big amount of Bitcoin going out from exchanges ....
is it bad or good alarm.....
in the other hand we have large longs positions versus sell in Bitfinex exchange all these things tickling me and intrigue me ,,,,Watch video for more ....
share your opinion with me in comments.
Good luck

Bitcoin Price vs Bitcoin Short vs Bitcoin LongDouble bottom in the Shorts indicates no further downside.

SEC harvests the bigwigs of the coin circle, and the copycat coi
The reincarnation of the coin circle does not need to live long. In every bear market, the copycat coins are played according to the rhythm of “zeroing”.
Of course, this time is no exception. I have always been skeptical about copycat coins. They are both currency and securities, and they are impossible to exist in the mainstream market. Which reliable government can let the currency issuance power fall to others? So when I wrote articles in Golden Finance in those years, I repeatedly emphasized the risk of copycat coins, and this view has not changed until now.
Bitcoin and Ethereum are defined as commodities, which are barely squeezed into the mainstream trading market, but a copycat coin also wants to enter the hall, isn’t it a dream? Now it’s fine, SEC has taken action, and unlike the Chinese government, the US government has shown the nature of capitalism. Everything is operated around economic interests. I don’t expel you, I just want money. If you are willing to redeem yourself and whitewash yourself, otherwise, I will let you go to hell.
This time on the surface is harvesting Binance, coinbase, in fact, those blind followers are the final leeks.
If we only look at the technical chart and do not consider the survival ability of the non-mainstream market in the future, this wave of copycat coins basically fell by 90%, which is definitely worth rebounding. But if you think about it, you can’t log in to compliant exchanges, including licensed markets such as Hong Kong’s encrypted exchanges in the future, then compliant funds will not be able to participate in transactions. And whether non-compliant funds can still play the role of market leader as before 2018?
To be honest, I don’t have much concept of copycat coins and can’t give you more advice. In a highly speculative market, being conservative may not be a bad thing.
From the daily line, bitcoin has a macd bottom divergence, ma144 and the previous head and shoulder bottom neckline 25200 have a certain support nearby, and the bulls also try to defend here. As for whether it can succeed, we need to see if macd can form a bottom divergence. And from the perspective of rebounding, I gave out abc’s structure earlier. At present, it should be in b’s adjustment. If the neckline fails to defend, 23200-21400 US dollars may be the adjustment target below.
Of course, if we look at the monthly line, here is a larger adjustment structure ABC in which B wave rebounds cycle. Bitcoin has fallen by 77% in one wave this time. Compared with the decline in previous bear markets (more than 80%), it is still not in place (more than 80%), and it seems that the bear market has not ended from time to time. So after rebounding, there may be a more tragic wave of killing.
In short, although institutional investors in the United States have joined in and changed the ecology of coin circles, although the previous barbaric growth mode will not disappear immediately, but game rules must change and make SEC comfortable. Change so that Wall Street tycoons can play more easily.

BTC - My short planIt is the optimal trade entry plan I set up to get the liquidity in 24K. If I have made a wrong approach about the optimal trend entry, please warn me.

BTC - Movement in the RangeIn my previous chart, I was aiming to get 24k liquidity quickly. I realized that BTC made the range move. According to the range structure I see here, I expect such a movement on BTC.

BEARISH AnticipationLooking forward to a bearish week on BTC am capitalizing the shorts presented by the bears

BTC.USDTAccording to our long-term analysis, Bitcoin correctly has 4 bearish waves
Elliot did the previous one, now it's the turn of wave 5, which means it's final
A wave that is not regular like the previous 4 waves may be complete
If it is fully formed, then we have to wait for 8000
If it is not completed, it can return 23-25 thousand from the weekly support

bearish head & shoulder completed!As you can see, a bearish head and shoulder pattern has been formed. The main support is also lost. With a pullback up, the main dump begins.

The current operation of Bitcoin should be simplified and less a
Bitcoin broke through in March and created a rebound high of 31,000 after entering a shock adjustment stage. Although the voice of ending the US dollar interest rate hike is getting higher and higher, the surrounding stock markets are also falling to new highs. But the currency market seems to be lukewarm and not too passionate.
We can see from the chart that I gave a head and shoulder bottom shape at the beginning, which is very similar to the trend of retracement after the March breakthrough. If it does not fall below. The neckline of 25,100 US dollars, theoretically this head and shoulder bottom trend is valid. If you look at the theoretical amplitude of the head and shoulder bottom, the rebound can at least see above 35,000 US dollars.
However, there are many factors that restrict the rebound at present, such as the angle of the moving average. The pressure formed by ma200 is also obvious. This moving average is currently around 31,500 US dollars and is falling at a speed of more than 80 points every 3 days. Of course, ma50 is also accelerating upward, so in the next stage, Bitcoin will run in the angle formed by the two moving averages and finally choose a direction.
Bitcoin is now in a state of shock before breaking through. It is not a good opportunity for left-side trading. You should wait patiently. Good traders do not frequently look for opportunities, but make correct choices at the first time when the trend is formed.

BTCUSDT $26840 Quick Update May18 2023BTCUSDT $26840 Quick Update May18 2023
Price continues to consolidate below the 3D21EMA
The 3D macd remains negative
Directional target 24-22k at 0.382-0.50fib
For the trend to flip bullish, bulls would need to print a positive 2DMACD and price above the 2D21ema
As mentioned previously, the current move from 31k could possibly be the starting point of the correction phase for Wave2.
The Wave1 was from 15.5k to 31k. This could be valid as long as bulls dont break 31k.
Once bears complete the wave2 (without breaking 15.5k), will start to focus on wave3, which could be 1.618extension of wave1.

It makes no sense!-It makes sense?Or Does not make sense. Many standards have been thrown to the ground by BTC in recent months.
-But if we have a bubble in this "crypto", for sure the prices are out of place. 10K is at least its proper place.
-We have a bearish pivot that projects, at first, to seek the 25K region.
-Will looking for the 25K region hold prices down, or will we go down a little further to the 21K region?
-We will see the next candles!
-See previous review below!
-Do your analysis and good business.
-Be Aware, If You Buy Use Stop!
-See below for other graphic reviews!

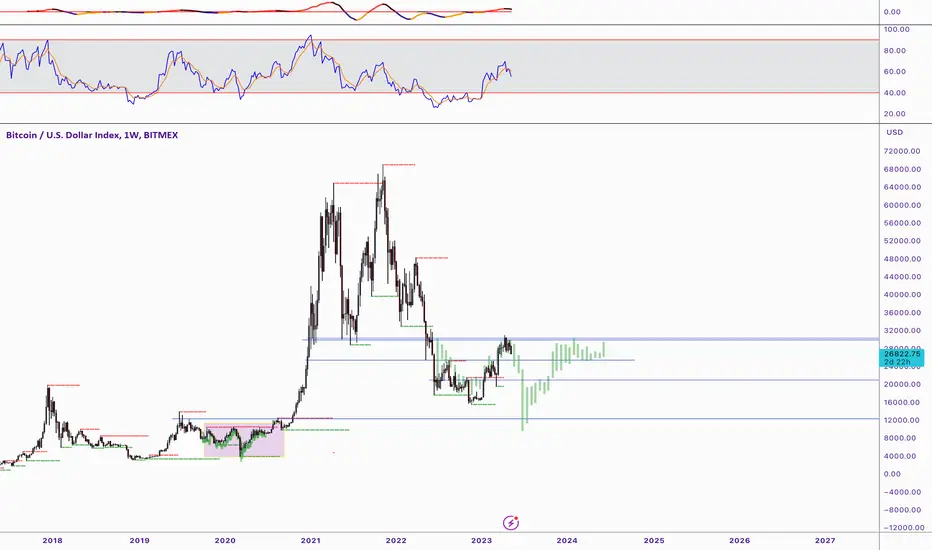
Sideways until late 2024The recent price movement in bitcoin could be described as "a small wave after a big one". This same description could be applied to 2019.
If price is to continue on a similar path to that of 2019 (bar pattern in blue), then we would see sideways trading for a a year or so, before a breakout to new highs.
Supply and demand zones provide buy/sell opportunities (red and green lines)

Silly BTC Fractal I'd previously published my idea on BTC, which has been decently accurate over the last few months. But this fractal has been in mind as of late. Not taking this too seriously but definitely want to see how closely it follows a 2020-style flash down.
For reference: my serious btc idea:
BTC and Russian RUBLE chartscheck out the RUBLE BTC... top chart is the strength of the RUBLE the bottom chart is the BTCRUBLE chart.. both are prime for a massive trend break...
BTC going to drop

btc and the trend continuationduo to my look to usd index as it will have a huge down move coming this week . btc may visit this resistance at 40000

Need strength!-Need strength, that's BTC's motto for the moments ahead.
-I'll get straight to the point.
-The daily chart tells me that it is throwing in the towel, that is, there are no more spaces for increases.
-In previous analyses, I mentioned that we had an accumulation of continued bullishness, but this accumulation did not have the strength to raise prices, opening precedents for corrections.
-The configuration of the hourly chart is just below, and it is not suggesting me a good thing. But it's best to wait! lol
-The bad news is on the weekly chart, which is on the verge of a bearish pivot if prices keep working below 27K.
-See previous graphical analysis!
-Do your analysis and good business!
-Be Aware, If You Buy, Use Stop!
-See below for other graphic analysis!
