Bitcoin Bullish Continuation in Progress🔵 Bitcoin Weekly structure confirms higher highs & higher lows, reinforcing the bullish trend.
📈 As long as CRYPTO:BTCUSD holds above key support near $106K, the next leg could target $127K–$143K within the coming 2 months.
BVOL7D trade ideas

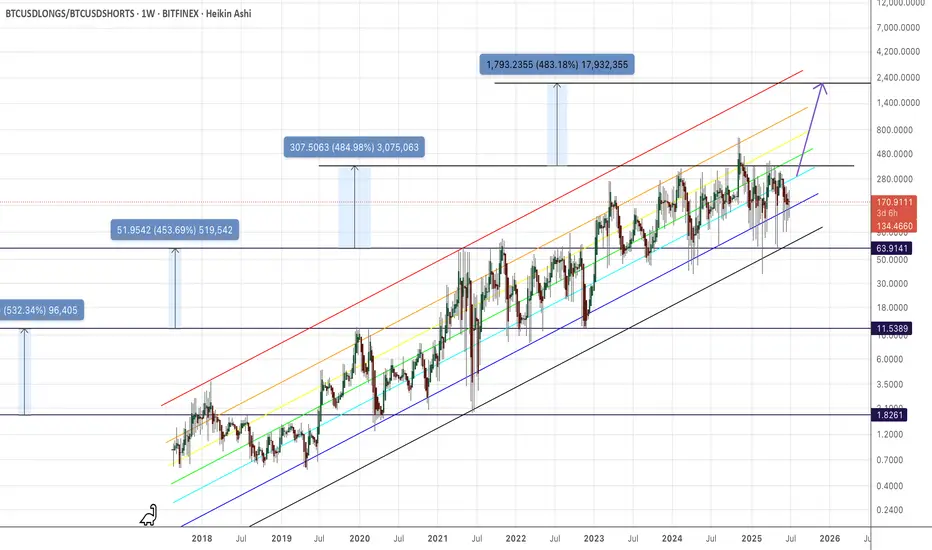
LONG/SHORT RatioHi,
Here's the long short ratio in a Fibonacci channel. Seems to me the ratio has consolidated near the highs for quite some time, and recent volatility could set up BTC for a pump into fresh high longs.
I'm calling for 95% "gap-close" attempt in the BTC.D, and simultaneously a $1M BTC as a "revert to mean" on the Stock-to-flow" curve.
# of coins on the exchanges are said to be low, but I don't know that for a fact. I do know that coins started leaving exchanges in December 2024 at an accelerated rate. Supply crunch coming? I think so.
Miners are hoarding coins, and they will just eventually stop selling to plebs altogether. Why sell any to you, when they can just hold them like Strategy, except they mine them themselves? No reason to sell to you, so the price goes way higher.
_Bitcoin Update
No need for long caption, this legend pattern tell the possible move. 😄〽️
— Whitebox support keylevel ( broke down & invalidated as support )
— If price stays below whitebox bias will be bearish
— For bullish reclaim we need to sit down again above whitebox support
— Bear possible target at PBr1 89512 - 88045

Bitcoin: Weekly Bullish Continuation🟠 The weekly divergence between the March 2024 and January 2025 peaks has driven the recent 3-month decline.
🔴 BTC is expected to make a weekly move higher, creating another divergence in the way.
🔵 BTC held above the 2024 peak range 73K without overlap, while the Stock RSI has completed a full reset, reinforcing the bullish momentum.
🟢 Outlook: Over the next 6 months, Bitcoin CRYPTO:BTCUSD is expected to rally into new ATH, with a potential target around 127K by October 2025.

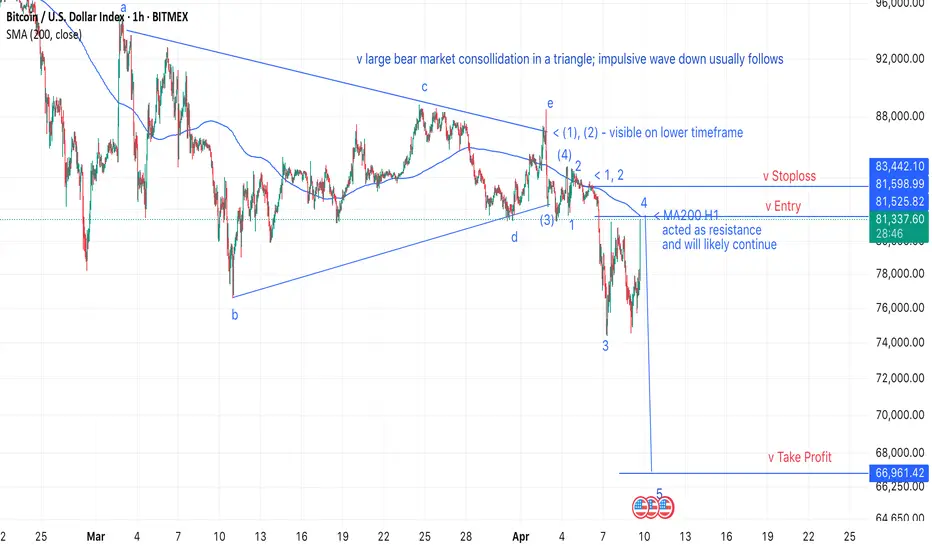
[BTC short] Entry: 81.5k, SL: 83.5k, TP: 67kThe backdrop is my prediction of a 2008-style crash, with Bitcoin (BTC) dropping to $26k (see related ideas).
During the crash, I’ll aim to capitalize on short-term moves, targeting clear patterns with high reward-to-risk ratios.
Following a prolonged consolidation—resembling a triangle—an impulsive wave down has begun to form. I now expect the 200-hour moving average (MA200 H1) to act as resistance, pushing the price to a new low and trade accordingly.
[BTC] Crash to $26k: Generational Buying OpportunitySince 2022, Bitcoin has surged in a major bull market, hitting the psychological $100k milestone. However, a triple divergence on the weekly RSI signals an overbought market, pointing to an imminent pullback.
The recent peak likely marked the end of Wave (3). Given that Wave (2) was an expanding flat (verifiable on lower timeframes), Wave (4) should bring a sharp, significant correction.
Wave 4 of (3) formed a running triangle, followed by a short Wave 5—exactly as occurred. Running triangles in Wave 4 paired with a brief Wave 5 often indicate distribution, typically preceding a major move against the trend.
The price action from March 2024 into 2025 resembles classic distribution. Since peaking near $110k, Bitcoin has declined slowly but steadily, suggesting a major crash rather than a typical medium-term pullback.
The $26k–$30k range offers robust support, and it’s unlikely the price will drop much lower. Along the way, the 200-week moving average (MA200 Weekly)—Bitcoin’s strongest historical support—could trigger a significant bounce. However, if this level is decisively breached, full-blown panic could ensue.
Given my expectation of a 2008-style bear market in the S&P 500 (see related ideas), the timing aligns perfectly. A market-wide crash would inevitably impact Bitcoin, as panic drives capital out of all markets to meet margin calls.
The $26k zone should mark the crash’s bottom, potentially presenting a generational Bitcoin-buying opportunity. If the S&P 500 retests its COVID lows while Bitcoin only revisits its 2023 consolidation range, it would underscore BTC’s relative strength. Once panic subsides, capital could flood into Bitcoin from across the globe.
Technically, this would be the bottom of Wave (4). Wave (5) could then propel Bitcoin to $1 million per coin in a powerful uptrend.

[BTC] $1M Bitcoin Inevitable—After a $26k CrashToday, I posted predictions that Bitcoin (BTC) will crash to $26k and the S&P 500 (SPX) will retest COVID lows (see related ideas). Yet, I firmly believe that post-crash, Bitcoin will soar to $1 million per coin—an inevitable outcome that could unfold rapidly, perhaps within one or two years.
Consider this: Bitcoin is no longer a fringe, unproven technology. It’s the world’s largest and most robust computer network, running without downtime for 16 years.
Critics argue quantum computing will kill it, but they overlook a key point: if quantum computers break traditional encryption, the entire internet, banking system, and digital infrastructure collapse too. Is this possible? Yes, but humanity tends to solve such challenges. By then, quantum-resistant cryptography will likely be implemented, and no profit-driven miner will resist it.
Hyperbitcoinization, forecasted 11 years ago (hyperbitcoinization.com), is unfolding now. Reports suggest 60–70% of hodlers never sell, stabilizing supply. Meanwhile, demand is surging globally. Individuals are pouring savings into Bitcoin, selling homes, borrowing, and maxing out credit cards. Visionaries like Michael Saylor borrow billions to buy more. New demand streams keep emerging: ETFs enable retirement account investments, seasoned “wise” investors are finally onboard, institutions are piling in, banks worldwide offer Bitcoin accounts, nation-states and politicians join the fray. Capital is flooding into Bitcoin from every corner, draining other markets.
This is arguably the strongest bull market in modern history. Bitcoin’s price lacks traditional fundamentals—it’s a psychological market fueled by belief and emotion. Emotionally charged bull markets don’t fizzle out with quiet distribution; they end in a euphoric squeeze beyond imagination. What’s happening resembles a market cornering (en.wikipedia.org) —not by a malicious group, but by humanity-wide groupthink. Think Tulip Mania or the Dutch East India Company. Skeptical? Read Extraordinary Popular Delusions and the Madness of Crowds by Charles Mackay.
Bull markets don’t die under selling pressure; they collapse when demand is exhausted. But with capital being siphoned from all markets, when will demand dry up? Only when the price reaches a level requiring infinite capital to push higher. No one knows exactly when, but it won’t be before $1 million per Bitcoin.
If my 2008-style SPX crash prediction (see related ideas) proves correct and Bitcoin only falls to 2023 levels ($26k), its resilience will shine. While the SPX retests COVID lows, Bitcoin’s shallower drop would signal unmatched strength.
TECHNICAL ANALYSIS
Bitcoin’s long-term chart is stunning. Since the 2018 bottom, it’s traced Elliott Waves , , , and . From the 2022 low, we’re in Wave . A pullback to $26k would be Wave (4) within the larger —unlikely to dip much lower.
Since inception, the 200-week moving average (MA200 Weekly) has been Bitcoin’s bedrock, supporting every bear market. Odds favor it holding again. A crash to $26k would confirm a four-year consolidation/reaccumulation phase. Once it breaks out, the move will be explosive.
This reaccumulation also resembles a rounding bottom, cup-and-handle, and inverse head-and-shoulders pattern—classic bullish signals in a strong trend, promising a massive upward surge post-breakout.


Let's see if ICT's right...Casual markup of where BTC might be headed this year. Purely technical; not accounting for fundamentals here. Just curious to see if this will play out as marked up.

BITCOIN FORECAST RANGE BETWEEN 66K AND 50K Just testing a theory I've had for awhile now... BTC seems to move between a certain range ever sense its initial spring into a bullish market from around 5k. Using the springs initial range and finding a rough 50% area between the price points you can almost exactly forecast (Swings & Corrections).

BTC = $8900. Global reversal. 0.5 Fibonacci level in November 2022 did not work, all the growth was false. Many people will lose money in altcoins, there will be no altseason because the bear market HAS COME. I talked about this 4 months ago, look at my forecasts.
BTC is very energy-intensive. The network of miners and ASICs consumes a huge amount of energy that could be used to produce goods and services.

Volatility to spike?If you go by Bitcoin's volatility alone as a measurement to decide where we are in the bullrun, this shows we are no where near the peak. Historically, BTC concluded its prior runs while seeing high volatility. Bitcoin's volatility is currently near its range low and hasn't replicated what we've seen in prior runs.
I believe volatility will lessen in the long term, but I feel like there's still more left in the tank to give.

Magical 30kPrice action moves violently away from 30k. I'll post more thoughts on this later. Just putting the idea out there for now.

BTC"The price is within the channel, waiting for a breakout. Since it is at the bottom of the support level, I will buy with a stop-loss for swing trading."

BTC still in 4hrs Bearish Time CycleBitcoin hasn't do anything yet which is good cause as long as it stays in that trading range with controlled drops while Bearish TIME is consumed bulls still has the upper hand. So for now and the rest of week #6 the move still is to the down side even if price doesn't drop we should get confirmation of trend this week for now the move still down meaning any long trade should be started in the area of 93k and below the 89k support. Buckle up ladies and gentlemen turbulence ahead.

4hrs and Weekly Bitcoin UpdateWe just closed week #5 and doesn't look good and we enter week #6 where we usually get confirmation of trend in this case Weekly Down Trend if during the week price breaks support of 89K and closes below it then weekly downtrend will be confirm and eventually we will see prices below 80k but if it bounces from above 93k then another test and possible break of the ATH will be on the table. Remember we still in the 4hrs Bearish Time Cycle and even tho Bulls are playing very well their game they are losing power. Lets see what this week brings , Buckle up ladies and gentlemen cause we are going for another wild....wild....wild ride.

Bitcoin road to 33 000 BITSTAMP:BTCUSD
✅Before we start to discuss, I would be glad if you share your opinion on this post's comment section and hit the like button if you enjoyed it.
Thank you.
Possible Targets and explanation idea
➡️ Everything going according by my global 2023 plan for BTC what i’ve posted here in December 2022
➡️ We got uptrend line since covid dump
➡️ We retested downtrend line with FTX crash
➡️ Now we can see impulse-correction-impulse. Second impulse to test uptrend line and I think first rejection in April
➡️ All FOMC rate already included in price. Recession is only one things what not included, so we can see dump
➡️ After rejection at trend line and full fill of 3 month FVG we can drop by end of summer to 20K to find a support
Hope you enjoyed the content I created, You can support with your likes and comments this idea so more people can watch!
✅Disclaimer: Please be aware of the risks involved in trading. This idea was made for educational purposes only not for financial Investment Purposes.
---
• Look at my ideas about interesting altcoins in the related section down below ↓
• For more ideas please hit "Like" and "Follow"!

Bitcoin and Wyckoff Accumulation D1BINANCE:BTCUSDT
Lets check classic Wyckoff Accumulation phase since drop In June. This is D1 Timeframe and if Historically October is green month with 15-60% moves up. We have an all chances break resistance and hit even 28-30K.
Hope you enjoyed the content I created, You can support with your likes and comments this idea so more people can watch!
✅Disclaimer: Please be aware of the risks involved in trading. This idea was made for educational purposes only not for financial Investment Purposes.
* Look at my ideas about interesting altcoins in the related section down below ↓
* For more ideas please hit "Like" and "Follow"!

Bitcoin September rally BINANCE:BTCUSDT
✅Before we start to discuss, I would be glad if you share your opinion on this post's comment section and hit the like button if you enjoyed it.
Thank you.
On chart you can find out Yellow line - global uptrend line since COVID dump
Red line - downtrend line since November 2021
Like always we got 2 scenarios. Red dot line move to 23k out of downtrend line with retest around beginning October
Second scenario continuation to middle sellers zone 28K with retest uptrend line same in October.
Hope you enjoyed the content I created, You can support with your likes and comments this idea so more people can watch!
✅Disclaimer: Please be aware of the risks involved in trading. This idea was made for educational purposes only not for financial Investment Purposes.
* Look at my ideas about interesting altcoins in the related section down below ↓
* For more ideas please hit "Like" and "Follow"!

updatebtc shorts increasing. Still believe all the wicks below will be filled a full body candle. When that happens most likely will be the top for btc.


Bitcoin Macro TP 2 Target: $132.5kTwo simple reasons why Bitcoin's secondary macro target from two different patterns lines up with roughly 132.5k.
Could we go higher? Sure, but this is a good measured macro target for this cycle.
An old W or double bottom pattern which successfully targeted 62.8k as a macro TP 1 during the last cycle's top, points to a macro TP 2 of 132.5k.
A parallel channel formed between last cycle top and the lows that followed it, targeted a more local TP 1 around 75-80k, which we've reached and since exceeded, and its TP 2 is also 132.5k.

BTCUSD towards 115k and lowerBased on RSI divergence and supportlines. Supportline below RSI. Channel for the impulse. Supportline for the finalization of wave 5. Top in start January.
