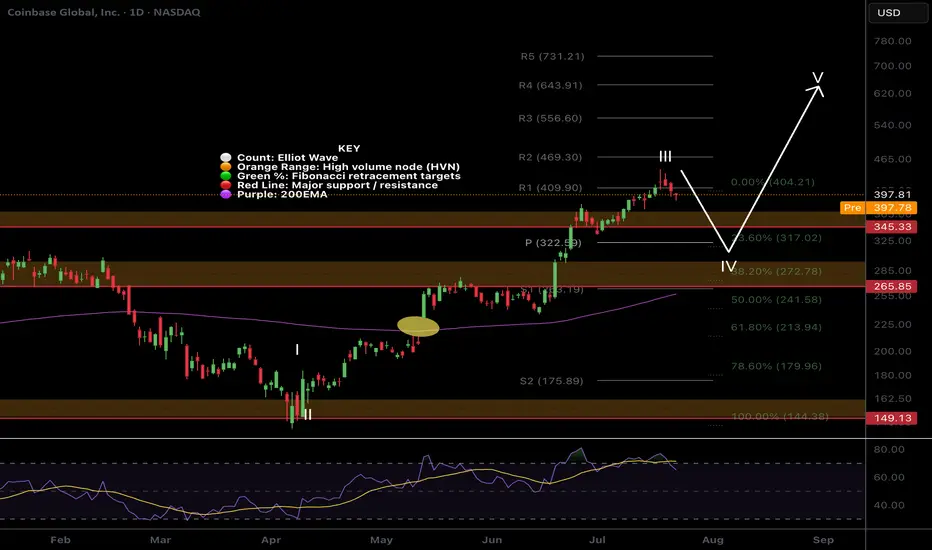
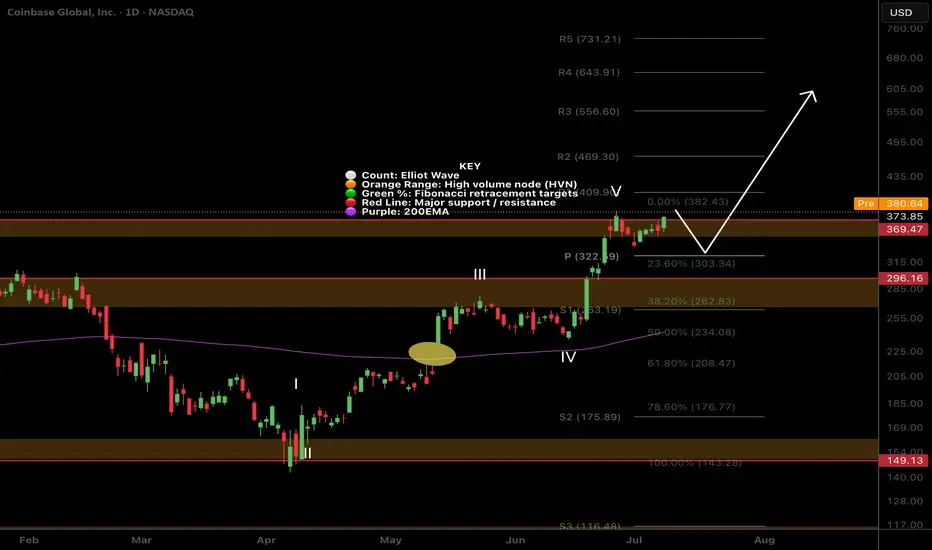
$COIN Wave 4 pullback?NASDAQ:COIN had a tremendous run, a text book Elliot wave 3 but has confirmed bearish divergence on the daily RSI.
The trend is strong so wave 4 could be shallow, only reaching the previous all time high, High Volume Node and 0.236 Fibonacci retracement and daily pivot point between $322-345
Further decline brings up the High Volume Node support at 0.382 Fib retracement and ascending daily 200EMA! Also a highly probable scenario!
Long term outlook remains around $600 target
Safe trading.
1QZ trade ideas
COINBASE I Strong Bearish Outlook (Take Action Now)Welcome back! Let me know your thoughts in the comments!
** COINBASE Analysis - Listen to video!
We recommend that you keep this stock on your watchlist and enter when the entry criteria of your strategy is met.
Please support this idea with a LIKE and COMMENT if you find it useful and Click "Follow" on our profile if you'd like these trade ideas delivered straight to your email in the future.
Thanks for your continued support!

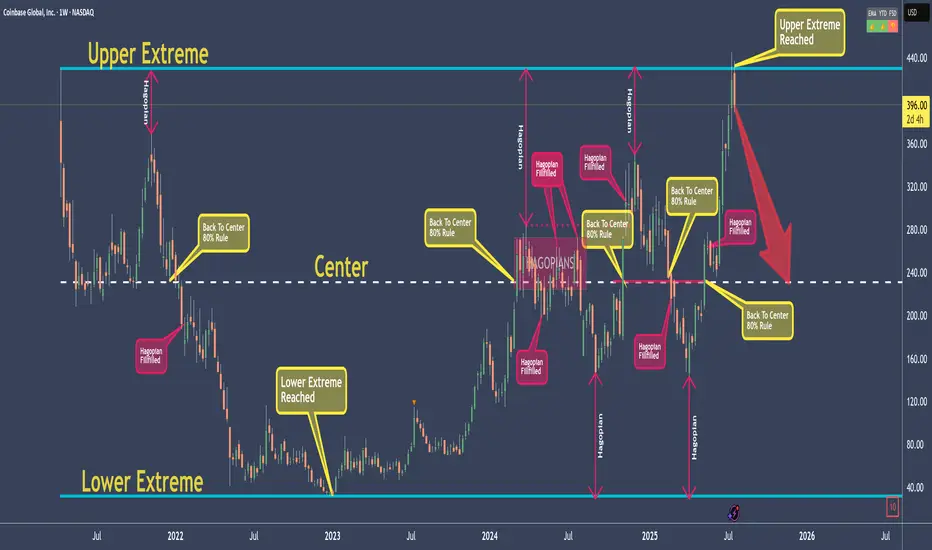
COINBASE - My rules say: Down with high probabilityI don't elaborate too much here, because I want to give you a chance to learn something!
As for the Trade, my rules say that it is a good Short.
The Short is not valid anymore, if price open and close above the Upper Extreme!
So, what are the rules?
Well, that's exactly what you will learn today ;-)
Go to my previous post which I will link, and you find everything you need to jump on the Steam-Train if you like.
As my old Mentors always said: "Larn To Earn"
Happy Profits Guys & Gals §8-)
Coinbase targetsI'm confident that coinbase has more upside after this recent retracement. I have zoomed in (on 15 min timeframe), on what I believe may be the bottom of this dip. As Coinbase dips, we note that Alt coins are also retracing. I believe Alts and Coinbase will soon see a reversal to the upside. This chart shows my entry points and how I anticipate price action to unfold.

COIN Shares Buy at 404 Take Profit at 425NASDAQ:COIN Shares Buy at 404 Take Profit at 425
Stocks SPOT ACCOUNT:
NASDAQ:COIN shares: my buy trade with take profit.
This is my SPOT Accounts for Stocks Portfolio.
Trade shows my Buying and Take Profit Level.
Spot account doesn't need SL because its stocks buying account.
Looks good Trade.
Disclaimer: only idea, not advice

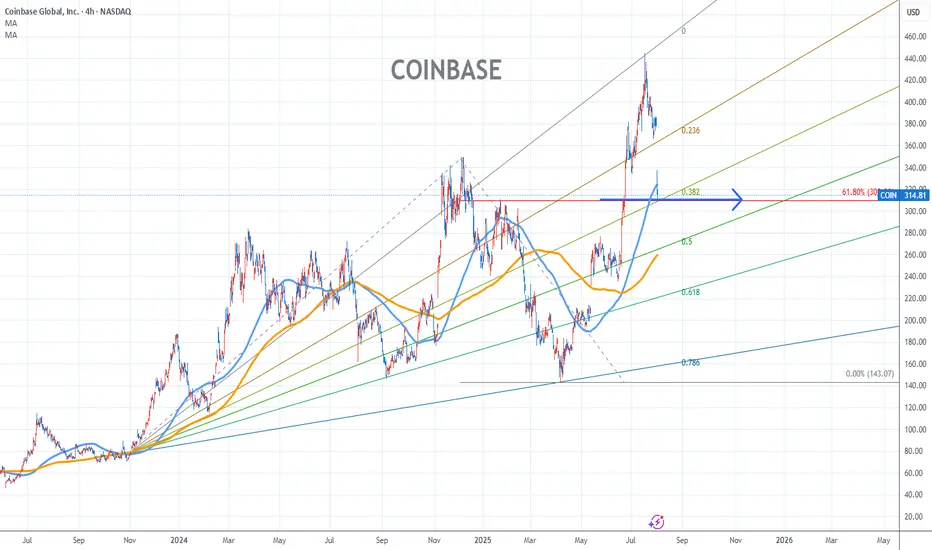
Coinbase Stock Chart Fibonacci Analysis 080125Trading Idea
1) Find a FIBO slingshot
2) Check FIBO 61.80% level
3) Entry Point > 310/61.80%
Chart time frame:C
A) 15 min(1W-3M)
B) 1 hr(3M-6M)
C) 4 hr(6M-1year)
D) 1 day(1-3years)
Stock progress:C
A) Keep rising over 61.80% resistance
B) 61.80% resistance
C) 61.80% support
D) Hit the bottom
E) Hit the top
Stocks rise as they rise from support and fall from resistance. Our goal is to find a low support point and enter. It can be referred to as buying at the pullback point. The pullback point can be found with a Fibonacci extension of 61.80%. This is a step to find entry level. 1) Find a triangle (Fibonacci Speed Fan Line) that connects the high (resistance) and low (support) points of the stock in progress, where it is continuously expressed as a Slingshot, 2) and create a Fibonacci extension level for the first rising wave from the start point of slingshot pattern.
When the current price goes over 61.80% level , that can be a good entry point, especially if the SMA 100 and 200 curves are gathered together at 61.80%, it is a very good entry point.
As a great help, tradingview provides these Fibonacci speed fan lines and extension levels with ease. So if you use the Fibonacci fan line, the extension level, and the SMA 100/200 curve well, you can find an entry point for the stock market. At least you have to enter at this low point to avoid trading failure, and if you are skilled at entering this low point, with fibonacci6180 technique, your reading skill to chart will be greatly improved.
If you want to do day trading, please set the time frame to 5 minutes or 15 minutes, and you will see many of the low point of rising stocks.
If want to prefer long term range trading, you can set the time frame to 1 hr or 1 day.
COIN 0DTE Trade Breakdown – July 25, 2025
📉 COIN 0DTE Trade Breakdown – July 25, 2025
Put Play or Pass? Let’s break it down 👇
📍 Price: $392.34
🧠 Sentiment: Neutral → Bearish
📊 Call/Put Ratio: 1.08 (Balanced flow)
⚠️ Gamma Risk: HIGH
⌛ Time Decay: Accelerating (0DTE!)
⸻
🎯 TRADE IDEA: 0DTE PUT
✅ Strike: $380.00
💵 Entry Price: $0.69
🎯 Profit Target: $1.00
🛑 Stop Loss: $0.37
📆 Expiration: Today (Jul 25)
📈 Confidence: 65%
📍 Entry Timing: At Open
⸻
⚠️ Why This Trade?
🔻 RSI trending down
🚫 Weak institutional volume
⚠️ High volatility expected from gamma squeeze
🕒 Tick. Tock. Time decay’s your biggest enemy here.
📌 Strategy:
➡️ Naked PUT (speculative short-term play)
⛳ Goal? Quick move → quick exit
⸻
🚨 Risk Warning:
❗ 0DTE = Massive swings
❗ One wrong move = rapid premium decay
❗ Stay nimble. Know your exit.
⸻
💬 Drop a 🔥 if you’re watching COIN today
#OptionsTrading #0DTE #COIN #DayTrading #PutOption #TradingView #StockTok #GammaRisk #TradeSetup

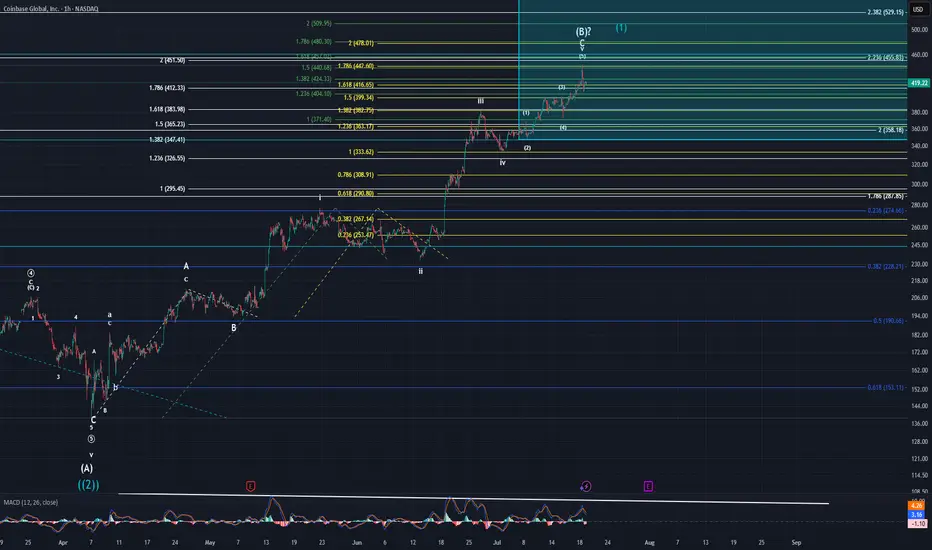
Coinbase UpdateI stated that if price broke through the yellow 1.618 @ $416 with strength that I would start to very seriously doubt the corrective count that I have. Well, it broke well through that fib only to immediately fall right back down and close only $3 away from it. Now, that being said, I am still in very seriously skeptical of the corrective pattern I am tracking. Lets start at the beginning of how I re-evaluated this pattern.
First thing I did was revisit the very beginning of the larger move higher that started way back in January 2023. I zoomed out to the monthly and then worked my way through the weekly, daily, 4hr, so on and so forth. I looked at MACD in relation to price action and notice a few things.
MACD Observations:
#1 - Monthly is still pointing higher in a strong manner.
#2 - Weekly is also pointing higher with strength and is on the verge of making a new high.
#3 - Daily just made a new ATH. This is significant given we're supposed to be in a (B) wave according to my white count.
#4 - Daily high in MACD combined with a high in price suggests eventual continued upside movement as momentum is still to the upside.
#5 - 4Hr and below is showing weakness
Now, to interpret all of this, one must know the typical correlation between price and MACD. Before, my ALT was that this was a continuation of intermediate (5) of primary ((1)). Now, after I have reflected on the recent longer-term developments, I am of a mind that this could be the intermediate wave (1) of primary wave ((3)). That would help to explain why the move down that began in Dec 2024 breached the wave 4 of a lesser degree. When you turn off log scale on the longer-term retracement fibs, it shows price slightly breached the 0.618 @ $153.11 to hit a low of $138.45. Is this the more accurate way to look at this? I cannot say for certain, but it sure is starting to seem like it.
Chris and I have been forecasting an imminent high in the overall markets for some time now. I still believe the markets are on the precipice of a super cycle wave (III) high. So how does this new possible outlook on Coinbase fit in with the overall markets dropping for the next few decades. How can it continue to move higher towards such highs while most everything else is getting hammered? Short answer, I have no idea. I have largely given up trying to link causation with events. Sure, it is fun to think about it and try to link certain things towards price action. In the end though, what does it really matter? All I care about is WHAT price does. Not WHY it does it.
For now, I am still stuck in not being able to make a decision on which count I prefer more. After this last week or two of price action I am beginning to strongly lean towards Coinbase entering into a new bull phase in the form of primary wave ((3)). The main problem I have with wave ((3)) though is that would suggest that primary wave ((2)) only lasted for four months whereas primary wave ((1)) lasted for two years. There are no rules that says this cannot be the case. It is odd for sure though.
Rather this is wave (1) of ((3)) or wave (B) of ((2)), price is overextended and does need a consolidation of the gains made in the last four months. As of now, if we have a top or only make a minimal new high, I forecast that retracement will fall to sub $300 easily and likely $250 to as low as $170. Once we have a larger abc pattern down from a top, that will be a GREAT time to go long. Worst case scenario, I will ride the minor B wave higher if it is a larger corrective pattern. Best case scenario, I ride the wave (3) of ((3)) to all time new highs. Obviously, it goes without saying one needs to keep their assets protected no matter what happens.
P.S: I am sorry the chart looks a little messy. I thought it pertinent to leave the three different fib extensions to give you as much information possible as to what prices possible intentions are. There is a lot of information in this post. PLEASE let me know if you have questions or I left anything unanswered.
Coinbase next targetCoinbase may have a small pump to my bullish target (+7-10%) up from this recent low.
After that I expect a breakout retest and probably a retrace to the golden pocket of that move.

COIN Weekly Bullish Options Setup (Jul 22, 2025)
🚀 NASDAQ:COIN Weekly Bullish Options Setup (Jul 22, 2025)
Institutional call flow is heavy. Momentum is fading — but not dead. Volume confirms bulls. This is a calculated strike before earnings zone noise.
⸻
📊 Trade Setup
• 🎯 Direction: CALL
• 📍 Strike: 410
• 💰 Entry: $14.70
• 🎯 Target: $17.00+
• 🛑 Stop: $11.60
• ⏰ Expiry: 07/25/2025 (3DTE)
• 📈 Confidence: 65%
• 📍 Entry Timing: Market open
⸻
🔍 Model Consensus (Multi-AI Synthesis)
• 🟢 3/5 models bullish: Grok, Llama, DeepSeek
• 🟡 1 neutral: Gemini (momentum divergence noted)
• 🔴 1 bearish: Claude (overbought RSI divergence risk)
• 📈 VIX < 22 = Green Light
• 🧠 Key Catalyst: PNC x Coinbase partnership + institutional volume surge
• 📉 Watch for RSI reversal > Weekly 83.5
⸻
📎 Trade Logic
• Options flow + volume = 🔥 institutional accumulation
• RSI high but manageable — expect momentum pockets, not full reversals
• Range target: $428–$444.65
• Stop loss = discipline, not fear
⸻
🧠 Risk Note:
• Momentum divergence is real.
• Avoid chasing if VIX > 22 or if open shows reversal.
• Size small. Let the volume do the work.
⸻
📢 Tagline (for virality)
“Snakes see a breakout, but bulls smell blood. NASDAQ:COIN loading calls on institutional flow. 3DTE scalp or breakout runner. Your move.” 🐂📈

Coinbase long potential Price is currently sitting at the first buying zone. Accumulating 50/50% in each. In case of price reversal after the 1st support zone, other 50% will be added when price will fix above 358$ at least with one full candle.
Target is on chart.
NFA
DYOR

Coinbase - T2 hit (but stopped out)We can't win them all, but I can limit my losses by knowing where are the best entry points, and quickly understanding how/when my strategy gets invalidated. So I know where to set my stop losses and minimize risk. Proper risk management is key.
I'm more focused on Btc and alts, but if anyone is interested in more of my Coinbase trading ideas let me know.

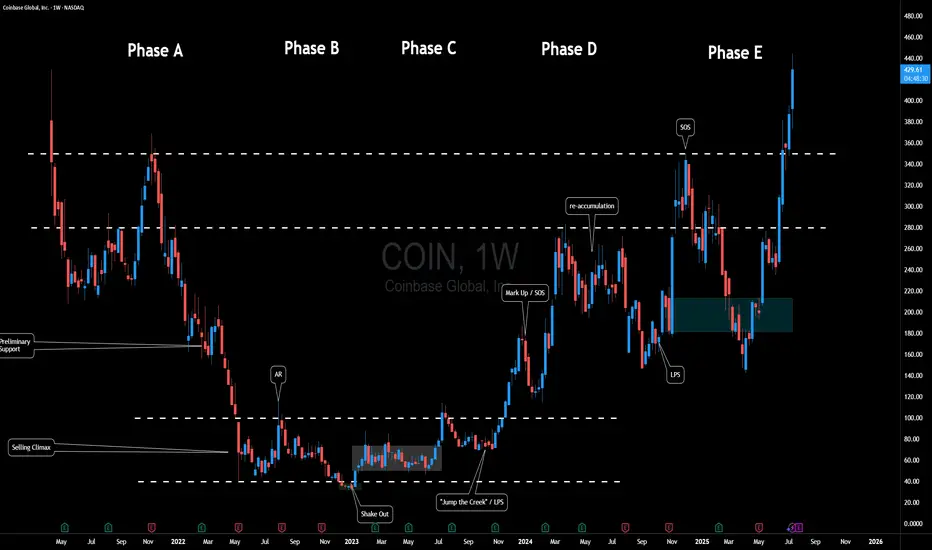
$COIN Fun Wyckoff InterpretationHere's a fun Wyckoff-inspired take on Coinbase Global ( NASDAQ:COIN ) over the past few years, mapping its weekly chart to the classic Accumulation Schematic. Wyckoff's method, envisioning the "Composite Man" quietly scooping up shares during weakness before blasting off... fits COIN perfectly, especially in crypto's wild swings.
We can see a textbook multi-year accumulation from mid 2022, a breakout into markup in 2024, and even a cheeky re-accumulation mid-2024 to fuel the latest highs.
Phase A: Stopping the Downtrend
After the initial IPO Coinbase experienced quite a bit of downside pressure.
Eventually price began to range between $40 and $100.
Phase B: Building Cause
Months of boring sideways chop.
Sellers exhausted because let's think for a moment... If crypto was truly going to stick around - how much lower could this thing go?
Smart money absorbs.
Phase C: The Trap
That shakeout low at ~$32 in early 2023. If you study Wyckoff, this is Schematic #1 vibes.
Phase D: Demand Dominates
Explosive rally (SOS) to ~$280 in early 2024, breaking the range on surging volume.
Mid-2024 pullback to ~$150 acts as a mini Re-Accumulation with its own LPS at the low. Higher lows / mitigation confirm no real distribution yet. Another SOS post-re-accumulation, pushing toward $400+.
Phase E: Markup Phase
Where will the composite man be eyeing for the next target?
Overall, Crypto adoption's heating up (BTC ETF flows, regulatory, etc), and the chart's still in a strong uptrend. But remember, Wyckoff's not crystal ball... it can however be used as a roadmap to navigate the chart.
Fun fact: COIN often mirrors BTC, so keep an eye out for correlation.
What's your opinion - accumulation complete or more shakeouts ahead? 🚀📈
Disclaimer: Not financial advice; DYOR! Chart based on weekly data up to July 2025.
COIN (Update) -- Potential Max Price TargetHello Traders!
Coin seems to potentially have a little bit more steam left. If it does make one more push... where will price go?
At $429.54 we have the All Time High for COIN.. interesting enough that price was hit on the first day of trading for COIN which adds to the significance of this price level. There is also a trendline connected from pivot to pivot. These two factors converge and create a significant level of resistance.
Most likely I will be entering a short position at this level.
Thanks everyone and best of luck on your trading journey!

COIN -- Major Trendlines + Bearish Divergence = Breakdown?Hello Traders!
Today I have shared the chart of COINBASE. Of course we cant know for sure what price will do, however you can take clues and combine them to give you a high probability reading of the chart.
Here are the clues:
1) MAJOR TRENDLINE
2) TRENDLINE
3) BEARISH DIVERGENCE
4) BULL FLAG MEASURED MOVE
When we combine these clues, a very bearish picture is painted... This signals to me that there is a high probability price will likely reverse and trade to the downside in the near future.
I hope everyone enjoyed this post and is able to use it as an educational tool.
Thanks everyone and best of luck on your trading journey!

COIN Breakout Loading: Smart Money Reclaim Underway | WaverVanir🚀 COIN Breakout Loading: Smart Money Reclaim Underway | WaverVanir Alpha Alert
NASDAQ:COIN just tapped a deep discount zone, rebounded from the 0.5–0.618 retracement band, and is now reloading liquidity under the previous high.
⚙️ Technical Breakdown:
✅ Fibonacci Golden Pocket (0.618 at $384.67) was respected with strong wick rejections.
🧠 Volume compression hints at algorithmic absorption under $388.
🔴 Red Supply Block @ $393.91–$395.80 is next liquidity target.
🟡 EMA ribbon acting as dynamic support, stabilizing at $381–$382.
🎯 Target Structure:
🚀 Break $388 → blast through $393.91 (1.236) → ignite options gamma toward $400.19
🔥 Your move, institutions. This is the last discount before markup.
💰 Trade Thesis:
Holding 7/11 $387.5C @ 0.71 – Target Sell @ $1,000 per contract.
Time is short. But so is volatility.
One wick above $393.91 can detonate open interest.
🧠 If this reclaims $388 with a strong candle and volume surge, expect FOMO to carry this into the gamma squeeze zone by EOD.
📍 Posted by WaverVanir International LLC – Quant-Fueled Liquidity Engine | VolanX Protocol Alpha Layer
#COIN #Coinbase NASDAQ:COIN #OptionsFlow #GammaSqueeze #LiquidityRaid #SmartMoney #TradingStrategy #SMC #QuantEdge #FibLevel #WaverVanirAlpha #VolanX #BreakoutTrade #VolumeProfile #BuyTheDip #HighConvictionTrade

Bullische Formation - Tassen mit HenkelKey Takeaways:
* Coinbase receives massive support from the Trump administration
* New all-time highs reached
* 50% year-to-date performance
* Strong position in the regulated US market
Valuation: The stock currently appears overvalued, but with political tailwinds.
Outlook:
* Short-term: Continuation of the uptrend due to the Trump effect
* Medium-term: Dependent on regulatory developments
* Long-term: Growth potential through mainstream crypto adoption
Potential Catalysts:
* Implementation of the strategic crypto reserve
* Regulatory clarity
* Institutional adoption
* Bitcoin ETF success
Strengths:
* Market leadership in the US
* Regulatory compliance
* Strong brand
Challenges:
* Cyclical dependence on the crypto market
* International competition
* Regulatory risks
Where it's doing well:
* Institutional services
* Regulatory compliance
* US market share

Coinbase (COIN) Shares Reach All-Time HighCoinbase (COIN) Shares Reach All-Time High
According to the chart of Coinbase Global (COIN), the share price of the cryptocurrency exchange has reached a historical all-time high (closing price).
The bullish sentiment has been supported by the following factors:
→ Bitcoin price rally. Yesterday, we analysed the BTC/USD chart and anticipated that bulls might attempt to set a new record. Following the publication, Bitcoin made a strong upward move, breaking above the $118,000 level.
→ Passage of the GENIUS bill in the US , which establishes a regulatory framework for the use of stablecoins.
Can COIN stock continue to climb?
Technical Analysis of Coinbase (COIN) Share Price
At the end of June, our analysis of the COIN chart highlighted the following:
→ From a broader perspective, COIN’s price fluctuations over the past year had formed an ascending channel (marked in grey).
→ The ongoing intermediate rally (marked in blue) had the potential to drive the price towards the upper boundary of this grey channel.
This scenario has materialised: today, COIN shares are trading near the upper edge of the grey channel. However, several factors now warrant a bearish outlook:
→ The upper boundary of the channel may act as resistance;
→ The psychological level of $400 could also serve as resistance;
→ Shareholders may be tempted to lock in profits;
→ A potential bearish divergence on the RSI indicator.
It is possible that in the near term, COIN bulls will attempt to break through the $400 level. However, if buying momentum weakens, the conditions may favour a price correction — which would appear justified after a nearly 60% rally since early June.
This article represents the opinion of the Companies operating under the FXOpen brand only. It is not to be construed as an offer, solicitation, or recommendation with respect to products and services provided by the Companies operating under the FXOpen brand, nor is it to be considered financial advice.

COIN Trade Update – July 11, 2025🚀
COIN is climbing with strength, pushing higher inside a rising wedge formation.
Price action is tight but bullish — buyers defending trendline support beautifully.
📍 Entry activated at $388.97 after confirmation near wedge resistance.
🎯 Targets locked in: $393.55 and $399.60
🛡️ Risk managed with stop below $383.00 — structure still intact.
This is a classic breakout anticipation setup with momentum building. Watching closely for volume surge and resistance break. Trade active — bias remains bullish.
🔍 Strategy: Rising Wedge + Breakout Continuation
📊 Sentiment: Bullish Cautious
📅 Holding through the session — price near key breakout level.

COIN long -- currently in Wave 3 of 5 wave advance I've been using Elliott Wave Theory to look at COIN's price action. We seem to be in the middle of Wave 3.
- Wave 1: April 7, 2025 to May 22, 2025
- Wave 2: May 23, 2025 to June 13, 2025 - we pulled back right below the 23.6% Fibonacci retracement level with ~$244 serving as support.
- Wave 3: June 14, 2025 - now. The third wave usually has 5 distinct sub-waves. As of July 7, 2025 We appear to be in the 3rd sub-wave of wave 3. Using the upper channel line, price target for this wave is around $408-$410. Quite possible if we see BTC move up explosively, which also seems imminent given the highest weekly close on July 6, 2025.
COIN is a very volatile stock that has explosive moves to the up and downside. I think we still have more room to run in this current wave 3--even beyond sub-wave 1 peak at $380.

$COIN Price discovery?I was looking for a deeper pullback on NASDAQ:COIN but it appears to be heading into price discovery!
The pivot at $322 was my target but sentiment must be bullish if investors are impatient! Still... i wouldn't count out another sell off as a bear trap on a poke above the swing high.
Safe trading
Analyzing the Bearish Trend in $COIN with AI & Smart Money Insig📅 Posted on July 8, 2025 by WaverVanir International LLC
Today, our advanced predictive model highlighted a potential short-term decline in NASDAQ:COIN (Coinbase Global Inc.), leveraging AI-driven forecasts and Smart Money Concepts (SMC) analysis to validate the trend.
📊 Insights from AI Model:
- Current Price: $353.30
- Expected Movement: Decline to $284.67
- Confidence Level: 60%
- Timeframe: 1 hour
📉 Noteworthy Observation:
- VolanX Alpha Layer detected a significant -19.42% probability spike.
📉 SMC Analysis Overview:
- Identified distribution pattern in premium zone
- Rejection of weak high levels
- Anticipated liquidity gap below equilibrium point ($306.10)
- Imbalance in volume profile awaiting resolution
🧠 Key Takeaway:
The alignment of AI predictions and market structure signals a substantial institutional impact. WaverVanir remains proactive in the face of volatility, strategically reallocating resources based on high-probability scenarios.
⚠️ Risk Advisory:
Kindly note, this information is not financial advice but derived from our internal Decision Support System (DSS) and AI technologies. It is essential to prudently manage position sizes and account for potential scenario variations.
📡 Connect with WaverVanir for further insights into market dynamics, strategic signals, and structured trading approaches.
#WaverVanir #COIN #VolanX #SmartMoneyConcepts #AITrading #InstitutionalEdge #MarketStructure #LinkedInFinance #TradingAI #DSS #LiquidityHunting

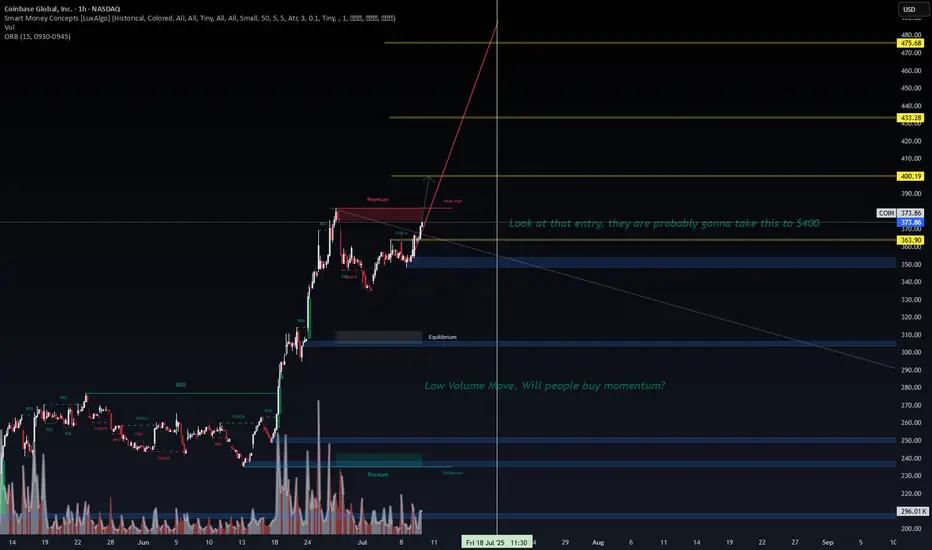
$COIN – Smart Money Lining Up a $400 Magnet?📈 NASDAQ:COIN – Smart Money Lining Up a $400 Magnet?
Narrative:
After a clean BOS (Break of Structure) and multiple CHoCHs (Change of Character), NASDAQ:COIN has reclaimed premium territory with precision.
What’s more telling?
➡️ The recent low-volume accumulation followed by a sharp breakout into the prior supply zone.
📌 The entry zone (highlighted) was surgical—likely smart money loading long exposure just below $365.
You don’t get that kind of entry without intent.
🔍 Technical Highlights:
Price reclaimed the weak high and flipped it into a potential continuation breakout.
Next clear magnet = $400 psychological + liquidity level
Volume behavior = “low-volume push” → likely testing market’s willingness to chase momentum.
🧠 AI System Insight:
While my LSTM model initially flagged this zone as exhaustion (which led to my prior failed put play), options flow and structure now confirm:
→ The market is likely rotating toward bullish momentum.
"Look at that entry… they’re probably gonna take this to $400."
⚠️ Watchlist Considerations:
Volume surge + price above $380 = confirmed squeeze
Failure below $365 = trap → back to EQ or discount zones
Options traders are bidding → flow supports bullish continuation
📌 I’m not in this trade yet—but watching for either a breakout confirmation or pullback retest for entry.
Don’t fade the strength unless you see absorption + reversal candle.
—
Prabhawa Koirala (Pravo)
Founder – WaverVanir International LLC
#COIN #SmartMoneyConcepts #OptionsFlow #Breakout #LSTM #VolumeAnalysis #WaverVanir #TradingViewIdeas