AVGO earnings todayBroadcom (AVGO) Q2 earnings are today 6/1/23 at 4:15pm.
Broadcom (AVGO) reported Q1 January 2023 earnings of 10.33 per share on revenue of 8.9 billion. The consensus earnings estimate was 10.11 per share on revenue of 8.9 billion. Revenue grew 15.7% on a year-over-year basis. "Consolidated revenue grew 16% year-over-year to 8.9 billion and adjusted EBITDA margin increased year-over-year to 64%," said Kirsten Spears, CFO of Broadcom Inc. "We generated 3.9 billion in free cash flow, representing a 16% increase year-over-year, and expect even stronger free cash flow in the second quarter."
Q2 April 2023 Consensus:
EPS = 10.09
Revenue = 8.70 B
6/2/23 expiry options data:
Put Volume Total 12,273
Call Volume Total 18,669
Put/Call Volume Ratio 0.66
Put Open Interest Total 19,314
Call Open Interest Total 18,641
Put/Call Open Interest Ratio 1.04
6/9/23 expiry options data:
Put Volume Tota l1,607
Call Volume Total 6,289
Put/Call Volume Ratio 0.26
Put Open Interest Total 4,717
Call Open Interest Total 4,979
Put/Call Open Interest Ratio 0.95
6/16/23 expiry options data:
Put Volume Total 2,493
Call Volume Total 4,775
Put/Call Volume Ratio 0.52
Put Open Interest Total 38,577
Call Open Interest Total 27,669
Put/Call Open Interest Ratio 1.39
1 day chart technical levels:
SMA50 = 646
SMA200 = 563
YTD high = 921.78
YTD low = 549.99
TTCATR VWMA20
top = 833
R3 = 812
R2 = 792
R1 = 772
pivot = 752
S1 = 732
S2 = 712
S3 = 692
bottom = 671
1YD trade ideas

NVDA Closed at Support | SPY & QQQ Long Term Outlook Guide- NVDA closed right at support very likely testing it again tomorrow morning.
- Nvidia does not have a lot of support in the gap zone so potentially more sell off if we do get into the zone.
- SPY rising wedge pattern is still in play.
- QQQ daily consolidation is still healthy havnt even pull back to 0.382 yet which potentially can still be a daily bull flag.
- pulling back over 0.5 will start to favor the bears on the next bounce as of now we still need more proving from the bears.

AVGO 500 SOON VERY SOON AND EVERY CHIP WITH IT The chart posted is what I would call a repeat of the saying in april 2000 .We are in a NEW PARADINE .From a candle stick view most could be like the run up in Gme


How to Trade Symmetrical TrianglesHow to trade symmetrical triangle patterns with entries and stop levels.

AVGO - Rising Trend Channel [MID TERM]- AVGO shows strong development within a rising trend channel in the medium long term.
- The price has broken the resistance at 633 of a rectangle pattern, which signals a further rise.
- The stock is testing resistance at 640.
- This could give a negative reaction, but an upward breakthrough of 640 means a positive signal.
- Overall assessed as technically positive for the medium long term.
*EP: Enter Price, SL: Support, TP: Take Profit, CL: Cut Loss, TF: Time Frame, RST: Resistance, RTS: Resistance to be Support LT TP: Long Term Target Price
*Chart Pattern:
DT - Double Top | BEARISH | RED
DB - Double Bottom | BULLISH | GREEN
HNS - Head & Shoulder | BEARISH | RED
REC - Rectangle | BLUE
iHNS - inverse head & Shoulder | BULLISH | GREEN
Verify it first and believe later.
WavePoint ❤️

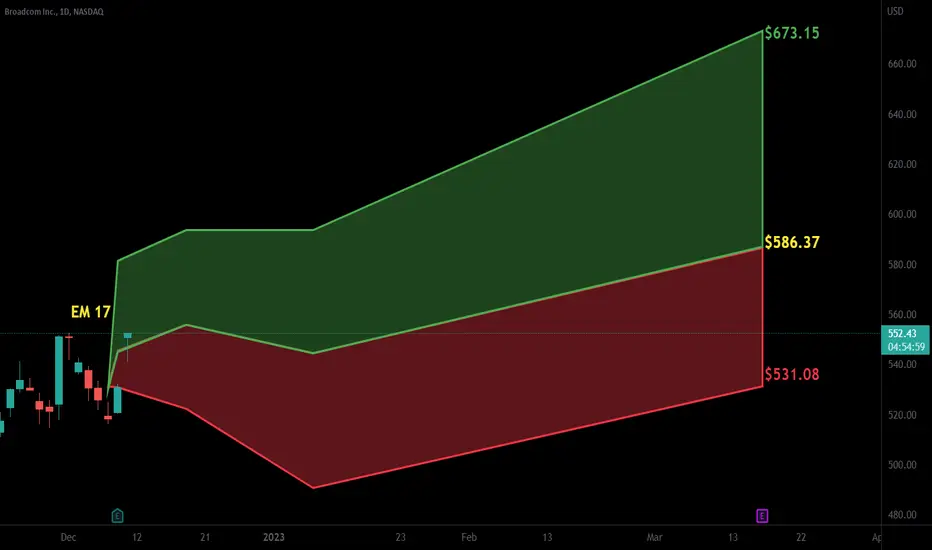
Broadcom: Slide 🛝Broadcom is amusing itself in the playground consisting of the green zone between $648.08 and $577.41 and has lately been lingering mainly at the 78.60%-retracement at $621.54. However, soon, the share should switch over to the red slide leading below the support at $572.10 and into the lower green zone between $531.78 and $465.02 to finish wave 2 in green. This low should then grant the share new upwards momentum. There is a 37% chance, though, that Broadcom could prefer the jungle gym and thus climb above the resistance at $648.50. In that case, we would expect a new high in the form of wave alt.1 in green in the magenta-colored zone between $673.07 and $774.04 first, before the downwards movement can start again.

Had a good run, time to restStock price had a good run, and now is hitting a strong resistance. Price has been rejected multiple times and is getting weaker. I think is going to drop to the strong support level at HKEX:580 before trying another poke to the HKEX:645 strong resistance level.

AVGO keep it in your watchlistPrice broke out the bullish flag, wait for a retest of the $518 support level, it's already to extended to jump in. If it doesn't retest and keeps going up, the trade is null.

Looking to buy Broadcom at 50 EMA.Broadcom - 30d expiry - We look to Buy at 601.11 (stop at 579.11)
Price action continues to trade around the all-time highs.
Daily signals are bullish.
There is no clear indication that the upward move is coming to an end.
We look to buy dips.
50 1day EMA is at 600.11.
A lower correction is expected.
Bespoke support is located at 600.
This stock has seen good sales growth.
Our profit targets will be 654.32 and 664.32
Resistance: 648.50 / 665.00 / 677.76
Support: 625.00 / 615.00 / 600.00
Please be advised that the information presented on TradingView is provided to Vantage (‘Vantage Global Limited’, ‘we’) by a third-party provider (‘Signal Centre’). Please be reminded that you are solely responsible for the trading decisions on your account. There is a very high degree of risk involved in trading. Any information and/or content is intended entirely for research, educational and informational purposes only and does not constitute investment or consultation advice or investment strategy. The information is not tailored to the investment needs of any specific person and therefore does not involve a consideration of any of the investment objectives, financial situation or needs of any viewer that may receive it. Kindly also note that past performance is not a reliable indicator of future results. Actual results may differ materially from those anticipated in forward-looking or past performance statements. We assume no liability as to the accuracy or completeness of any of the information and/or content provided herein and the Company cannot be held responsible for any omission, mistake nor for any loss or damage including without limitation to any loss of profit which may arise from reliance on any information supplied by Signal Centre.

AVGO Tight Rising WedgeThis rising wedge is getting tighter and tighter. It does favor a break lower as it approaches the apex of the triangle.
The short trade setup may coincide with a hit of the double top and top of the rising wedge.
Some distribution is clearly occurring near these levels.

AVGO - Not much left for Northbound travelsLong-term this champion looks in need of a much needed respite from all of its journeys northbound. It still appears to have some energy left in the tanks, so another higher high is not out of the cards. IMO this has the look of a titan that will likely shift focus to acquiring more vertical integration type of companies, hence capping upside potential. If a new high is reached, then this is likely the continuation of (5) via a wave v of (5) - target 850ish - note alt count. Losing 540 on a daily close would shift odds to the more immediate corrective count and likely eliminate another higher high. GLTA!

Avgo Avgo interesting here post earnings gap up above avwap from the recent swing high and above Vwap from the swing low before the gap

$AVGO with a bullish outlook following its earnings #StocksThe PEAD projected a bullish outlook for $AVGO after a positive under reaction following its earnings release placing the stock in drift A with an expected accuracy of 87.5%.

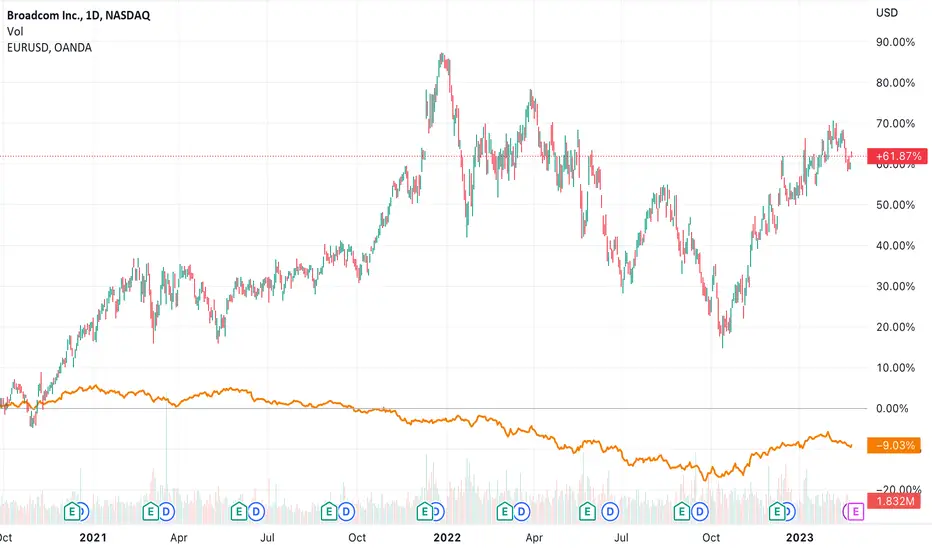
Broadcom’s performance before earnings report Broadcom Inc. (symbol ‘AVGO’) share price has performed very well in the last quarter of the year and also into the new year so far with a minor correction happening in the last 3 sessions. After an overall hard year the company managed to gain most of its losses back and is looking strong in the near short run. The company’s earnings report for the fiscal quarter ending January 2023 is set to be released on Thursday 2nd of March, after market close. The consensus EPS for Q1 is $9,38 compared to Q1 2022’s $7.68.
‘Even though the company’s share value is lower than the beginning of the year, the financials of the company are looking healthy. The net income has increased compared to previous years and the current ratio is over 260% meaning the company has the capacity in assets to cover its short term liabilities. ’ said Antreas Themistokleous at Exness. ‘The dividend yield rate is over 3% while the payout ratio is just above 60% making the share an attractive addition to investors portfolio’
From the technical analysis perspective the price has been trading in a steady bullish movement throughout the whole quarter while a correction came after the resistance of the upper band of Bollinger bands in early February. Currently the price is trading at a strong technical support area which consists of the 50 day moving average, the lower band of Bollinger bands and the 23.6% of the Fibonacci retracement level.
The Stochastic oscillator is recording extreme oversold levels possibly indicating that the correction might be close to its end and a rebound to the upside might be imminent. The following sessions are important to the share price since it would pretty much indicate the near term movement of the stock.
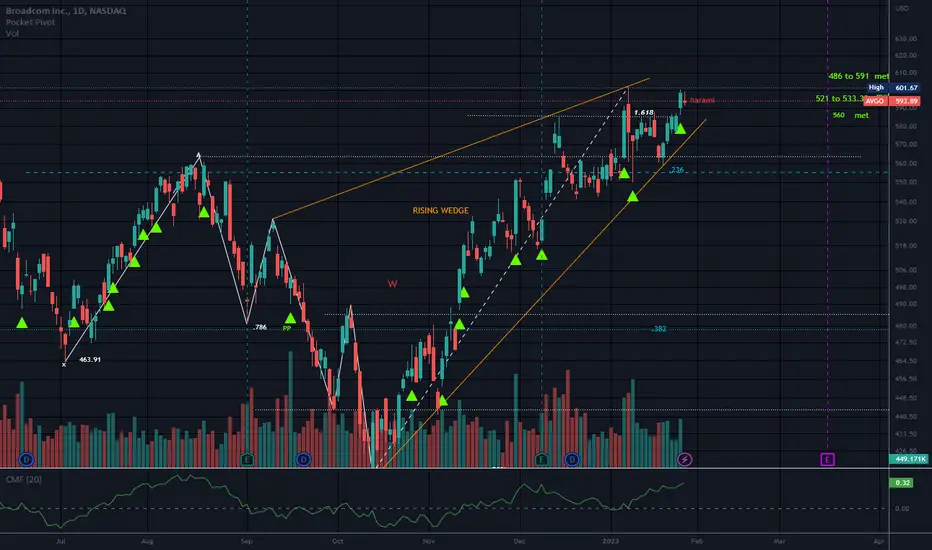
Rising WedgeBoth lines sloping up and narrowing at the apex.
Bearish but not valid until bottom line is broken.
Bearish Harami today that needs confirmation.
Short when support line is broken.
Price is above the .236 of the trend up.
Possible bearish crab that terminated above the 1.616 if the 4th leg is complete.
No recommendation.
The Crab is a reversal pattern that allows you to enter the market at extreme highs or lows.
The Crab is similar to the Butterfly, but while the Butterfly pattern ends at a point that represents a 127% Fibonacci extension of the initial X-A leg, the Crab ends at a point that represents an even deeper 161.8% Fibonacci extension of the X-A leg.
There are bearish Crabs (crooked W) and bullish Crabs (crooked M)
AVGO Setup for LongAVGO 1H Setup
1- trend is bullish
2- trend line is respected many time
3- current support is between 598 - 594
4- next resistance is at 627
5- if price go up to 599 then enter the trade and ride till 625
7- if price goes down then next entry point is at 594
8- Entry points for long calls only:
-Zone1: 598-600
-Zone2: 580-594

AVGO Setup, wait for the price to come at entry point- Overall trend is bullish
- 1st point of entry is at 588 and then the price may go up
- 2nd point of entry is at 564 and then the price may go up
- 3rd point of entry is at 548 and then the price may go up
Resistance is at 608, so you can expect the price to go till that level

AVGO - bearish move short-termAVGO has been in a short-term uptrend. However it looks that the price is approaching the key resistance. We expect that the stock price may decrease in the coming period.
Therefore, we recommend taking a short position when and only if the price breaks the upsloping trendline that has been acting as a support. Once the price breaks this support , we can enter a short position, however it’s also possible to enter short when the price bounce back up and retests the trendline, get rejected and confirm it as a resistance.
When we look at the RSI, we see that there is a regular bearish divergence. That divergence shows the buyers exhaustion therefore there is a high probability that the price of the AVGO will go down in the next few days. We recommend closing to the short at 0.618 Fibonacci point. Target is shown on the chart.

Ready to break upCheck my previous post below. Good time to add or open a long position if you missed it before.

Bearish to upper 400sNeeds to breakdown below 552 to set this in motion, but a few gaps to fill to downside and upside has run its course for now.
Initial target range in coming weeks is 492-520 (point target 505)
Goal target is around 475 where it will accumulate and form right shoulder of larger accumulation structure around the 2022 low. From the right shoulder it will begin next bullish cycle to new all time highs.


$AVGO with a Bullish outlook following its earnings #Stocks The PEAD projected a Bullish outlook for $AVGO after a Positive over reaction following its earnings release placing the stock in drift B with an expected accuracy of 83.33%.