AVGO Weekly Options Outlook — May 31, 2025📉 AVGO Weekly Options Outlook — May 31, 2025
🚨 AI Model Consensus: Cautiously Bearish Into June 6 Expiry
🧠 Model Breakdown
🔹 Grok (xAI)
Bias: Moderately Bullish
Technicals: Price > EMAs, strong momentum, RSI near 80.
Sentiment: Positive earnings, falling VIX, call OI heavy at $250.
Trade: Buy $245C @ $8.25 → PT +20%, SL −10%
Confidence: 75%
🔹 Claude (Anthropic)
Bias: Moderately Bearish
Technicals: RSI 80.6 = extreme; resistance near $242.3.
Trade: Buy $230P @ $4.55 → PT $6.85 (+50%), SL $3.40 (−25%)
Confidence: 72%
🔹 Llama (Meta)
Bias: Moderately Bearish
Technicals: Bullish trend fading, MACD divergence, RSI 80+.
Trade: Buy $227.5P @ $3.85 → PT +50%, SL −50%
Confidence: 70%
🔹 Gemini (Google)
Bias: Moderately Bearish
Technicals: RSI >80, MACD bear cross, volume spike = fatigue.
Trade: Buy $220P @ ~$2.07 → PT +75–100%, SL −30–35%
Confidence: 65–70%
🔹 DeepSeek
Bias: Moderately Bearish
Technicals: Daily MACD bearish, resistance at $242.25.
Trade: Buy $240P @ ~$8.40 → PT +50%, SL −30%
Confidence: 65%
✅ Consensus Summary
📈 AVGO has rallied hard—RSI now overbought (~80–81)
💡 4 of 5 models see pullback risk due to:
RSI extremes
MACD bearish divergence
Heavy distance above Max Pain @ $220
📉 Sentiment cooling despite strong earnings backdrop
⚠️ Disagreements
Aspect Bullish (Grok) Bearish (Others)
📊 Direction $245 Calls $230P / $227.5P / $220P / $240P
🎯 Strike Range $245 (OTM call) $220–$240 (puts)
🧠 Confidence Range 65%–75% 65%–72%
🎯 Recommended Trade
💡 Strategy: Bearish Naked Weekly Put
🔘 Ticker: AVGO
📉 Direction: PUT
🎯 Strike: $230
💵 Entry: $4.55
🎯 Target: $6.83 (+50%)
🛑 Stop: $3.40 (−25%)
📏 Size: 1 contract
📅 Expiry: 2025-06-06 (weekly)
⏰ Entry Timing: Market Open
📈 Confidence: 72%
⚠️ Key Risks
🔼 A continued rally from strong AI/macro themes could break bearish setups
⚡ Gaps at open may widen bid/ask and auto-trigger stops
⌛ Time decay (theta) ramps midweek—price action must confirm early
📉 Max Pain @ $220 could magnet price or fail if trend remains strong
📊 TRADE DETAILS (JSON)
json
Copy
Edit
{
"instrument": "AVGO",
"direction": "put",
"strike": 230.0,
"expiry": "2025-06-06",
"confidence": 0.72,
"profit_target": 6.83,
"stop_loss": 3.40,
"size": 1,
"entry_price": 4.55,
"entry_timing": "open",
"signal_publish_time": "2025-05-31 23:51:03 UTC-04:00"
}
1YD trade ideas
Weekly Options Strategy – CALL on AVGO + Tactical PUTs on DLTR, Idea linked to NASDAQ:AVGO – Full structured breakdown for the week ahead
This week I’m deploying a mixed options strategy based on high-probability setups and strict risk management.
We’re combining a bullish CALL play on NASDAQ:AVGO ahead of earnings, with three tactical PUT ideas on companies that meet our 20-point bearish checklist across technical, fundamental, and macro filters.
This isn’t guesswork.
✅ We only enter when multiple signals align in our favor.
📌 This is a game of probability, not certainty – and we want the odds stacked heavily on our side.
🟢 Bullish Setup – AVGO (Broadcom)
Current price: $237.09 (adjusted post-split)
Catalyst: Earnings on Thursday, June 6
Price target: $255–$265
✔️ Why this setup stands out:
✅ Leading sector (semiconductors + AI tailwinds)
✅ Consistent EPS & revenue growth
✅ Increasing institutional volume
✅ Clean technical breakout (MA50 > MA200)
✅ RSI healthy, not overbought
✅ Strong momentum into earnings
✅ Macro support for chip stocks
🛡️ Risk Plan:
– Partial entry before earnings
– Add only on post-earnings confirmation
– Stop-loss below $225
– Max risk per trade: <6% of total capital
🎯 This is a high-conviction setup, backed by fundamentals and strong technicals.
🔴 Bearish Setups – Tactical PUTs with Breakdown Potential
These three stocks meet our 20/20 bearish checklist, showing clear signs of technical deterioration and weak fundamentals.
1. DLTR – Dollar Tree
Current price: $90.36
Earnings: Wednesday, June 5
Downside target: $82–$85
❌ Key bearish signals:
– Weak guidance and margin pressure
– Inflation hurting target customer base
– Strong technical downtrend
– Rejected at MA200
– No positive catalysts in sight
🎯 If earnings disappoint, a breakdown toward $82 support is likely.
2. SIG – Signet Jewelers
Current price: $66.57
Target: $58–$60
❌ Structural deterioration:
– Discretionary sales declining
– Momentum in EPS fading
– Head & Shoulders pattern activated
– Low volume and no institutional support
🎯 A break below support could trigger a rapid move to the $58 zone.
3. NIO – NIO Inc.
Current price: $3.54
Target: $2.70–$2.50
❌ Clear red flags:
– Persistent losses and cash burn
– Weak EV sales in China
– Geopolitical and tariff pressure
– Fading volume and buyer interest
– No short-term catalyst
🎯 The trend is clearly bearish – we’re targeting continuation toward $2.50 support.
🧠 Strategic Recap
✅ Bullish CALL on AVGO with strong setup ahead of earnings
✅ Bearish PUTs on DLTR, SIG, and NIO with deteriorating fundamentals and clean charts
✅ Each trade risk-adjusted under 6% of total capital
✅ Executing only when the majority of signals point in the same direction
📌 We don’t need to be right 100% of the time – we just need the probabilities to be in our favor when we enter.
💬 Drop your thoughts or follow if you’re tracking these setups too – I’ll post follow-ups after earnings.
#AVGO #DLTR #SIG #NIO #OptionsTrading #CALLStrategy #PUTOptions #TechnicalAnalysis #EarningsPlays #TradingWithDiscipline #ProbabilityTrading #RiskManagement #TradingPlan #TradingView
Trade IdeaAVGO Long June Calls at the break of this tight consolidation range looks like a good R/R play. Make the trade your own.

Broadcom (AVGO) is triggering a powerful breakout todayNASDAQ:AVGO – High Tight Flag + Range Breakout Setup
Broadcom ( NASDAQ:AVGO ) is triggering a powerful breakout today with two bullish patterns stacking up — a high tight flag and a larger range breakout.
🔹 High Tight Flag Breakout
Price action has been coiling tightly just under recent highs — a textbook high tight flag formation.
These setups often lead to strong continuation when they break with volume.
🔹 Range Break in the Works
We're now pushing through the $233–$234 zone, a key resistance level that has capped price recently.
A breakout here opens the door for a major trend continuation.
🔹 My Trading Plan:
1️⃣ Position: I’m playing the $235 calls for next week.
2️⃣ Entry Trigger: Breakout through the $234 level with volume.
3️⃣ Stop Loss: Stop will be based on intraday price action — likely below the 9 EMA or breakout level to manage risk.
🔹 Why This Setup Has Juice:
Strong consolidation near highs is a sign of strength, not weakness.
This is the kind of pattern where institutions start piling in.
Dual setup (flag + range breakout) increases probability of follow-through.
⚠️ Risk Management: Tight stop under breakout zone — manage risk, stay nimble.

Broadcom Inc. (AVGO): Software-Driven Growth Meets AI Hardware ECompany Overview:
Broadcom NASDAQ:AVGO is undergoing a strategic transformation—shifting from a hardware-centric model to a hybrid software and subscription platform. The VMware acquisition is proving pivotal, reshaping AVGO’s margin profile and deepening its enterprise moat.
🔑 Growth Catalysts:
💻 VMware Integration = High-Margin Recurring Revenue
70%+ of top 10,000 VMware customers already moved to subscription model
Transition boosts revenue visibility, margin expansion, and valuation multiples
Strong cross-sell opportunities within Broadcom’s enterprise base
⚙️ Custom AI Chips – A Key NVIDIA Hedge
Broadcom’s custom AI accelerators offer an alternative amid export curbs
Strong demand from hyperscalers and cloud players (Amazon, Google, Meta)
Positioned as a strategic silicon supplier in the AI infrastructure stack
📶 Diversification = Resilience
Deep reach across networking, broadband, storage, and wireless
Reduced cyclicality vs. pure-play semiconductor firms
Balanced between enterprise software and hardware demand
🛡️ Geopolitical Edge
Broadcom’s chip solutions provide alternatives in regions impacted by U.S.-China tech tensions
VMware’s software suite ensures relevance in multi-cloud and hybrid IT environments
📊 Financial Highlights:
Consistent double-digit free cash flow growth
EBITDA margin expansion via software scale and cost synergy post-VMware
Shareholder-friendly with strong buybacks and dividend growth
📈 Investment Outlook:
✅ Bullish Above: $165.00–$170.00
🚀 Upside Target: $270.00–$280.00
🎯 Thesis: With AI tailwinds, VMware synergies, and rising recurring revenues, Broadcom is evolving into a software+silicon powerhouse—positioned for outsized returns and resilience in volatile markets.
#Broadcom #AVGO #VMware #AIchips #Semiconductors #EnterpriseSoftware #RecurringRevenue

AVGO eyes on $192: Double Fib Resistance holding up the bounce Tariff relive bounce has reached Golden Genesis fib at $192.34.
That fib is reinforced by tight confluence of a Covid fib at $191.92.
This double-fib Resistance is now key to the whole recovery process.

BroadcomUptrend
The chart has confirmed a new uptrend by moving decisively above the 185 level after breaking a descending trend line. Subsequently, another price level has been breached. The small pullback observed after this breakout could indeed signal a continuation of the upward movement towards the next target around 237.
Remember to always implement a reliable stop-loss (SL) for any long positions. You might consider placing it around 192 or setting it according to the specific rules of your trading strategy.
Good luck.

$AVGO looks bullish here. Can go as high as 276 $ NASDAQ:AVGO has seen a faster recovery from the April 8th lows faster that other Semi stocks. The recovery has been stronger than $NVDA. The stock lost 45% of its value during the recent bear market. Since then, the stock has also recovered 45% of its value form the lows of 145 $. The weekly close of NASDAQ:AVGO above the psychological level of 200 $ is very bullish for the stock.
If we plot the fib retracement level NASDAQ:AVGO form the Aug 2024 Yen carry trade sharp sell off, then we can see that the there are major levels which we can reach in the next few weeks. With the management declaring 10 Bn $ of stock buy back there is a floor for the stock price and it provide more upside support for the stock. In this blog we had said on 6th April that the price is good for accumulation, and we should go long on $AVGO. And that was a good trade for those who took it. We should stay long in NASDAQ:AVGO as the stock can go higher before any sell off can set in.
Verdict : Stay long $AVGO. Next stop 219 $ and 250 $.

BROADCOM: Long term Channel Up points to $350 within 2025.AVGO is bullish on its 1D technical outlook (RSI = 64.250, MACD = 3.500, ADX = 29.483) as last week it crossed and close over its 1W MA50 and on the current 1W candle it is about to close over the 0.618 Fibonacci retracement level as well. This is similar to the November-December 2022 fractal that followed after the last major market bottom. Both sequences bottomed on the same 1W RSI level (34.80), so the structures share more similarities than differences. Since the 3 year pattern is a Channel Up, the stock is now on the new bullish wave aiming for the next HH. The 2022 rebound reached the 1.618 Fib extension before consolidating for weeks, so our long term target is the current 1.618 Fib (TP = $350.00).
## If you like our free content follow our profile to get more daily ideas. ##
## Comments and likes are greatly appreciated. ##

AVGO -Break Test GO!This is a classic setup of a break structure, test the bottom, and GO!!!!
These moves are designed to provoke emotion, both to the downside and to the upside. They go up to give false hope and then rip it lower to deliver a perfect knockout combo.
Such setups are all over the charts in big names such as AAPL
Its better to be out of the market wishing you were in than in the market wishing you were out.
Take your profits and GTFO!

$AVGO #Breakout #Retest GOOOO!!! Price Target: $200Seeing a lot of "Buy The Dip" Opportunities built over the past 3 weeks...
NASDAQ:AVGO giving you a second chance at #WhiteBoySummer if you missed the first go around ;p
Look for High Volume Buying in the coming days, AI narrative isn't dead, NASDAQ:AVGO trying to challenge NASDAQ:NVDA ? I'm looking at both and also monitoring NASDAQ:SMH as well. Below red line idea is DEAD...
Paytience Pays!
- Prophecies

BROADCOM's 15 year chart is why you will regret not buying now.Broadcom Inc. (AVGO) has been on a strong correction in the past 4 months, completing so far 3 straight brutally red 1M (monthly) candles since January, having broken below its 1W MA50 (blue trend-line).
This month, it hit its 1W MA100 (green trend-line) for the first time since November 2022. This is a key Support level as it is AVGO's main Support during Bull Cycles that historically has only broken during Bear Cycles.
In fact, the stock has been trading within a 15-year Channel Up since it's IPO. And this is the reason why this correction is a blessing in disguise for long-term investors. The 1W MA100 was intact during the previous historic Bull Cycle from May 2013 to July 2018. So since we tested it now, there is a far stronger probability of it holding and extending the Bull Cycle that started on the October 2022 Low, than turning into a Bear Cycle.
Notice also how symmetric the rises have been within this Channel Up. The 2012 - 2015 rise has been +500% before the 1W MA50 was breached again. Similarly, AVGO has grown by +500% again from the October 2022 bottom to the recent All Time High, before it broke last month again below the 1W MA50.
If this is a new Low similar to August 2015, then we can expect an equally symmetric follow up rise of +178.64% in the next 2 years. This gives us a rough long-term Target of $380.
-------------------------------------------------------------------------------
** Please LIKE 👍, FOLLOW ✅, SHARE 🙌 and COMMENT ✍ if you enjoy this idea! Also share your ideas and charts in the comments section below! This is best way to keep it relevant, support us, keep the content here free and allow the idea to reach as many people as possible. **
-------------------------------------------------------------------------------
💸💸💸💸💸💸
👇 👇 👇 👇 👇 👇


Broadcom May Be OverboughtBroadcom has bounced sharply from its early-April lows, but some traders may see risk of another push to the downside.
The first pattern on today’s chart is $186.90, a weekly low from mid-March. The chip stock has been trapped below that level, which may suggest old support is new resistance.
Second, prices are stalling under the 200-day simple moving average. That may indicate its long-term trend is getting less bullish.
Third, the 8-day exponential moving average (EMA) is below the 21-day EMA. That may reflect short-term bearishness.
AVGO also retraced half its drop from mid-February but climbed no further, which could confirm its direction is pointing lower.
Next, stochastics have reached an overbought condition.
Finally, AVGO is a highly active underlier in the options market, trading about 300,000 contracts per session in the last month. (It ranks 12th in the S&P 500, according to TradeStation data.) That could help traders take positions with calls and puts.
TradeStation has, for decades, advanced the trading industry, providing access to stocks, options and futures. If you're born to trade, we could be for you. See our Overview for more.
Past performance, whether actual or indicated by historical tests of strategies, is no guarantee of future performance or success. There is a possibility that you may sustain a loss equal to or greater than your entire investment regardless of which asset class you trade (equities, options or futures); therefore, you should not invest or risk money that you cannot afford to lose. Online trading is not suitable for all investors. View the document titled Characteristics and Risks of Standardized Options at www.TradeStation.com . Before trading any asset class, customers must read the relevant risk disclosure statements on www.TradeStation.com . System access and trade placement and execution may be delayed or fail due to market volatility and volume, quote delays, system and software errors, Internet traffic, outages and other factors.
Securities and futures trading is offered to self-directed customers by TradeStation Securities, Inc., a broker-dealer registered with the Securities and Exchange Commission and a futures commission merchant licensed with the Commodity Futures Trading Commission). TradeStation Securities is a member of the Financial Industry Regulatory Authority, the National Futures Association, and a number of exchanges.
Options trading is not suitable for all investors. Your TradeStation Securities’ account application to trade options will be considered and approved or disapproved based on all relevant factors, including your trading experience. See www.TradeStation.com . Visit www.TradeStation.com for full details on the costs and fees associated with options.
Margin trading involves risks, and it is important that you fully understand those risks before trading on margin. The Margin Disclosure Statement outlines many of those risks, including that you can lose more funds than you deposit in your margin account; your brokerage firm can force the sale of securities in your account; your brokerage firm can sell your securities without contacting you; and you are not entitled to an extension of time on a margin call. Review the Margin Disclosure Statement at www.TradeStation.com .
TradeStation Securities, Inc. and TradeStation Technologies, Inc. are each wholly owned subsidiaries of TradeStation Group, Inc., both operating, and providing products and services, under the TradeStation brand and trademark. When applying for, or purchasing, accounts, subscriptions, products and services, it is important that you know which company you will be dealing with. Visit www.TradeStation.com for further important information explaining what this means.

Broadcom Approaches Major Resistance
Broadcom has rebounded +30% off its March lows, recovering from recent weakness.
The stock is currently testing the 200-day moving average ( around 183) but has so far failed to break above it.
It now faces a confluence of resistance near $185 — a key level to monitor for potential rejection or breakout.

Optimistic Outlook for AVGO: Long Position Targeting $195–$198 N- Key Insights: Broadcom (AVGO) stands at a critical juncture within the
semiconductor space, trading near resistance levels at $184–$185. While the
sector remains soft, AVGO benefits from favorable developments, including
anticipated tariff exemptions and growth in AI, cloud computing, and 5G.
These catalysts could boost the stock's performance and drive momentum
toward higher price targets.
- Price Targets:
- Long Position Next Week:
- Target 1 (T1): $195
- Target 2 (T2): $198
- Stop Levels:
- Stop Level 1 (S1): $182
- Stop Level 2 (S2): $180
- Recent Performance: AVGO has traded within a tight range, testing key
resistance levels ($184–$185) without a decisive breakout. Sector-wide
weakness in semiconductors has capped upward movement. However, AVGO's
resilience and sector leadership provide confidence for potential gains. A
sustained push through resistance could lead to higher price targets and
signal renewed investor optimism.
- Expert Analysis: Market experts have a cautiously optimistic view of AVGO,
highlighting its exposure to tariff exemptions and demand drivers like AI
and 5G. The $195–$198 range is considered achievable under bullish
conditions. However, broader semiconductor softness points to the importance
of monitoring market sentiment and key macroeconomic trends.
- News Impact: Tariff exemptions for technology companies are expected to reduce
manufacturing costs and boost margins for players like Broadcom.
Additionally, ongoing advancements in AI, cloud, and 5G technologies
continue to favor AVGO as a market leader, providing significant tailwinds
for the stock's recovery. Investors should keep a close eye on broader
indicators in the semiconductor and technology sectors to gauge AVGO’s
upward potential in the coming week.
Bear Flags: $NVDA first, then $AVGO In this AI Mega cycle there were 2 clear visible winners. NASDAQ:NVDA and $AVGO. Broadcom ( NASDAQ:AVGO ) has had a late bull run in the AI super cycle which started in 2022 and was ongoing until Dec 2024. During this tariff-based bear run NASDAQ:NVDA is almost down 40%. The same is true for Broadcom. NASDAQ:AVGO is also down 40% from the ATH.
But we must investigate the confluence of some more technical indicators on top of the simple % drawdown we see in stocks. The 2 most helpful indicators are the RSI and Fib retracement levels, which can give us some more price levels which we might be looking forward to in the upcoming weeks. The RSI is at 36 on the weekly chart for both the stocks NASDAQ:AVGO and $NVDA. But let’s focus on NASDAQ:AVGO in this blog. Today we are combining the Gan and Fib retracements levels on the weekly chart of NASDAQ:AVGO and we see the clear price levels. We are already at 0.618 Fib retracement which is the price level 145. We closed @ 146 $ on Friday. If we break tis support level, then the next level we are looking at is 121 $ which will be 0.5 Fib retracement levels. If that level is broken, then we are looking at a 100 $ Stock price on $ AVGO 0.382 Fib retracement level.
Verdict: Buy 33% now, buy 33% between 120 $ - 130 $ , buy the rest 33% between 95 $ - 100 $

BROADCOM Megaphone bottom hit. Will it hold?Broadcom Inc. (AVGO) has been trading within a Bullish Megaphone pattern since the January 05 2024 Low and this week it hit its bottom (Higher Lows trend-line). This technically concludes the Bearish Leg and should start the new Bullish Leg.
The last Bullish Leg's initial rebound hit the 0.786 Fibonacci retracement level before pulling back again. If the market starts the new one here, which is not as easy as last time as we've already broken below the 1D MA200 (orange trend-line) last week, the immediate Target is 228.50.
-------------------------------------------------------------------------------
** Please LIKE 👍, FOLLOW ✅, SHARE 🙌 and COMMENT ✍ if you enjoy this idea! Also share your ideas and charts in the comments section below! This is best way to keep it relevant, support us, keep the content here free and allow the idea to reach as many people as possible. **
-------------------------------------------------------------------------------
💸💸💸💸💸💸
👇 👇 👇 👇 👇 👇

AVGOit is very amazing chart here 2 targets we will wait small corrrection between (165$ _ 160$) then go on to (195$_199$) or expended to 218$ it is very strong resistant

Lets see what will happen The stock is approaching levels that have historically acted as support, such as the $180-$186 zone or even lower at $157-$164, where buying interest might emerge.

$AVGO - move lower if $177..15 support breaks AVGO - stock tested and held previous low support of $177.15. looking for puts below that level for a move towards $157.39. Stock is weak on indicator and could move lower.

AVGO about to big move AVGO is key area struggle
let;s see what;s going on long short scenario is on the chart ~~

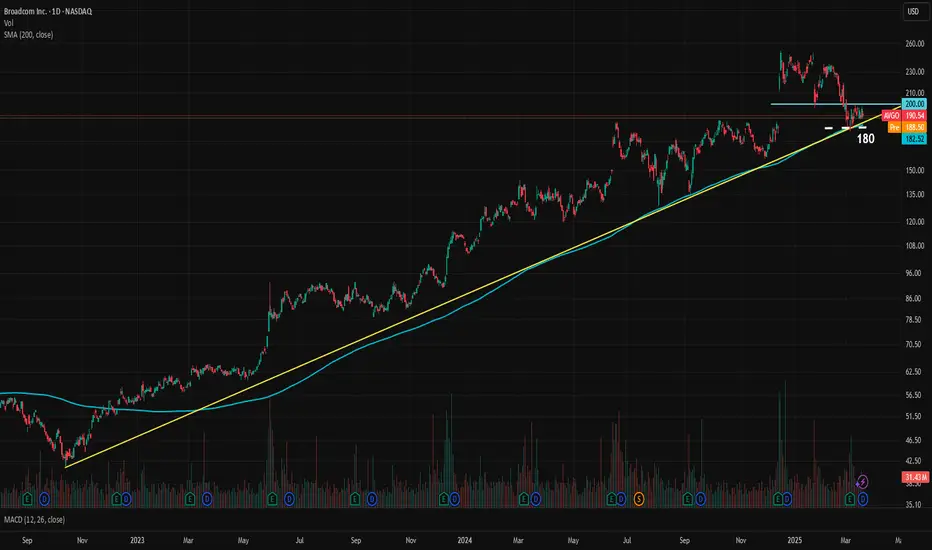
AVGO Stuck Between Key Levels, A Calm Before the Storm?Broadcom, one of the key favorites in the AI rally, is at a crossroads. AVGO has been in a steady logarithmic uptrend since October 2022, carrying the stock price from 41.51 to 251.88, marking an impressive 506% gain in about two and a half years. The company's EPS has been consistently increasing over the years and is expected to accelerate further this year. Although valuations are high, if Broadcom's performance in 2025 meets or exceeds expectations, the bullish case remains strong. The forward P/E for 2025 end is 28.7x.
Currently, the price is stuck between the trendline and the 200 resistance level. The uptrend is supported by the 200-day moving average. The trendline sits around 184, while the SMA is at 182.50. For a more cautious approach, 180 can be considered the key medium-term support level. If 180 holds and AVGO manages to break above the 200 resistance, there is significant upside potential for the bulls.
The current analyst consensus for the 12-month price target is 251, which also coincides with the stock's all-time high (ATH).