Visa Head and Shoulder Bearish pattern forming with Visa, which could turn into a 15-20% correction if pattern plays out.
3V64 trade ideas

V 1H wolfe wave bearishV 1H wolfe wave bearish
A Wolfe Wave is a chart pattern composed of five wave patterns in price that imply an underlying equilibrium price. Investors who use this system time their trades based upon the resistance and support lines indicated by the pattern.

VISA bearish analysisV, bear flag forming on the daily chart. plus looks like a Head and Shoulders pattern forming which is a bearish pattern. Visa has earnings this week.

VISA potential long-got a break of 232usd, not confimred to this point of time
- after 8h close above 233, i think next target would be 237, then 242
- got a lot of triggerwaves and increasing money flow on the 8 and 12h

Inverse Head and ShouldersPossible stop under lower shoulder. Long entry level is a break of the neckline with an uptrend.
Earnings are 10-26 AMC.
No recommendation.
Price appears to be trying to stay above the 50 SMA. The 20 may cross up through the 50 which is a bullish crossover, close but no cigar yet. The 200 is sloping up as is the 20.
I did not leave it on the but William's Alligator indicator is waking up and the shorter term moving averages this indicator uses are in order and pointing up.

Visa Is Starting to Rise Up !Hello everyone, as we all know the market action discounts everything :)
_________________________________Make sure to Like and Follow if you like the idea_________________________________
It looks like Visa Bearish movement has ended when a Breakout of the Descending Channel happened on the 23rd of Sep. after that the stock has started moving sideways with a small edge to the upper direction.
The breakout point has formed what seems to be a solid support level where the market was able to bounce twice from.
The 19th of Oct was a great day for the stock where the market value has jumped from 228.27 to 233.52, a 2,2% increase in 1 day and this bullish push doesn’t seem like it's going to stop yet.
Possible Scenarios for the market :
Scenario 1 :
The market seems to be having a good Bullish momentum at the time this will lead the stock value to push up and hit the resistance level located at 235.14, If the buyers were able to gather more force and breakout that resistance then we will be seeing the price zigzag until it gets to the resistance level located at 247.63.
Scenario 2 :
The Bears might attempt to drive the market back into the descending channel range but they will be met by a big support zone that’s located near the 224.00 range, where a lot of buy power is located, if the Bears were able to drive the price to that level then we will see a big battle where the price will most likely bounce back up and return to Scenario 1 movement.
Technical indicators show :
1) The market is above the 5 10 20 50 100 and 200 MA and EMA (Strong Bullish Sign)
2) The MACD line has crossed the 0 line indicating the market changing from a Bearish state to a Bullish state. With a positive crossover happening between the MACD line and the Signal line
3) The STOCH is in the overbought zone with a positive crossover between the %K and %D
Daily Support & Resistance points :
support Resistance
1) 228.28 1) 232.90
2) 225.90 2) 235.14
3) 223.66 3) 237.51
Weekly Support & Resistance points :
support Resistance
1) 222.71 1) 235.17
2) 214.44 2) 239.36
3) 210.25 3) 247.63
Fundamental point of view :
Large credit card giant Visa is moving into the cryptocurrency space with its own version of credit cards, opening up opportunities for certain large-cap growth ETFs.
With a stake in Visa, ETF investors can play VISA move towards the cryptocurrency space with the Invesco Dynamic Large Cap Growth ETF (PWB).
Indicators point to continued Q4 strength in the domestic air travel recovery, and that's good news for Visa.
The 7-day moving average of U.S. COVID-19 cases, a leading indicator for domestic restrictions and travel, continues to decline since mid-September and Transportation Security Administration screenings as a percentage of 2019 levels improved to 85% from 83% in Evercore's prior Global Air Travel Tracker issue.
This is my personal opinion done with technical analysis of the market price and research online from Fundamental Analysts and News for The Fundamental point of view, not financial advice.
If you have any questions please ask and have a great day !!
Thank you for reading.

Bullish Patterns IdentifiedBullish Engulfing followed by Multiple Bullish pin bars on weekly chart. The price has hit support levels thus increasing chances of reversal and rally with upside potential of about 20% untill next cool off.

Visa Inc. (V) bullish scenario:The technical figure Triangle can be found in US company Visa Inc. (V) at daily chart. Visa Inc. is an American multinational financial services corporation. It facilitates electronic funds transfers throughout the world, most commonly through Visa-branded credit cards, debit cards, and prepaid cards. Visa is one of the world's most valuable companies. The Triangle has broken through the resistance line on 16/10/2021, if the price holds above this level you can have a possible bullish price movement with a forecast for the next 19 days towards 240.18 USD. Your stop loss order according to experts should be placed at 218.63 USD if you decide to enter this position.
Risk Disclosure: Trading Foreign Exchange (Forex) and Contracts of Difference (CFD's) carries a high level of risk. By registering and signing up, any client affirms their understanding of their own personal accountability for all transactions performed within their account and recognizes the risks associated with trading on such markets and on such sites. Furthermore, one understands that the company carries zero influence over transactions, markets, and trading signals, therefore, cannot be held liable nor guarantee any profits or losses.

V potentially carries SPYMomentum of V is looking bullish while tech looks to be a bit bearish
- Support level is around $229
+ 200 EMA is around the same level
+ top disjointed channel will act as resistance if there is a bounce

V - STOCKS - 11. OCT. 2021Welcome to our Weekly V2-Trade Setup ( V ) !
-
4 HOUR
Market about to turn.
DAILY
Expecting more bullish price action.
WEEKLY
Buying the turnover!
-
STOCK SETUP
BUY V
ENTRY LEVEL @ 229.37
SL @ 220.54
TP @ Open
Max Risk: 0.5% - 1%!
(Remember to add a few pips to all levels - different Brokers!)
Leave us a comment or like to keep our content for free and alive.
Have a great week everyone!
ALAN

$V (short term(1-3m)) direction still indecisive this is my first time posting on tradingview so im not sure if my format is appealing; but i linked some posts that i saw value in. the first link showed a massive head and shoulders that is slightly slanted and with the mega caps valuation being through the roof, i personly could see this happening. the second link shows a short bearish trend that at the time of posting wasnt confirmed, but as of oct. 3 that candle of that day made a confirmation of a bullish indication (on my chart). the third link takes the bullish indication from oct. 3 and continues that trend to ATH. From my view, this play is more TA correct than the first link because: long term trend is bullish, on the daily it held 200EMA & 200SMA for the last 3 trading days. but fundementaly speaking, if congress doesnt raise the debt ceiling and america defaults, seeing the massive head and shoulders is instantly more probable. but if congress raises debt ceiling before oct. 18 (they probably will) then i will take deep ITM short term leap and hope fro new ATH
NYSE:V

Short on visa could be wrong usually notlet's see how earnings look i see a huge sell off still on visa and retest back to $203-$207 and when you control 92% of online purchases how does visa continue to sell of especially with everything going to online sales etc.... who's selling visa is the main question.

BACK to ATHVisa looks to have broken downtrend and reversed. It retested the 200MA after breakout.
I am long. I expect visa to go back to 250 and then even higher.
DYOR.

$VVisa the largest global electronic payment solutions company, gained a meager 5% – increasing from about $219 at the beginning of 2020 to around $230 currently, underperforming the S&P500, which grew 20% over the same period.
However, the company’s payments volume has seen some recovery over the recent quarters – nominal domestic payments volume and nominal cross-border volume increased 18% and 10% year on year in Q3.
There were two clear reasons for the improvement in payments volume:
First, easing of travel bans and Covid-19 restrictions in several countries, second, the U.S. government’s approval of the $1.9 trillion coronavirus relief package in March.
Visa without question is a strong company.
Visa had a slight pullback as it started to get a little overbought on the daily, now it’s coming out of oversold territory.
A nice clean break of downward channel has been broken and we could be seeing a good old retest of previous resistance to see if it’ll act as support.
Watchlist.
- Factor Four

VISA LONGVisa had a dip of 13% in the last 2 months, which makes it a great opportunity to buy on long term, unless a stock market crash happens in the next 6 months. On a daily timeframe, the stock created a descendent channel, and it was broken, making the 200MA a strong support. Long term potential📈


$V Plan for the week $V Inverse Head and Shoulder setting up nicely get ready for the retest and breakout

$V - Inverse H&S, calls if hold above 231 | puts below 230$V - In Daily formed Inverse H&S, calls if hold above 231 | puts below 230

Broke trend and retestVisa broke its downward trend and retested it. Looks ready to go back to 250. A good idea to load here for a swing.
Seems to be holding this level as support.
I expect october to be better for stocks.
DYOR.

VISA LONG Since the end of 2020, Visa stock has been on a steep climb. Indeed, after rising more than 40% from November 2020 to October 2021, the stock reached its annual highs at $251.77. The stock is now trading at $225.56 just above our pivot point at $215.50 (blue line). In addition, the stock is in an ascending channel and currently near the lower bound. But the 200-period moving average is still at $223.73, which confirms our bullish scenario. We anticipate a continuation of the rise towards $233.00 (first green line) at first and then towards $249.20 (second green line).
Alternative scenario: A clear break of the pivot point at $215.50 (blue line) would lead to a return to $206.72 (red line).

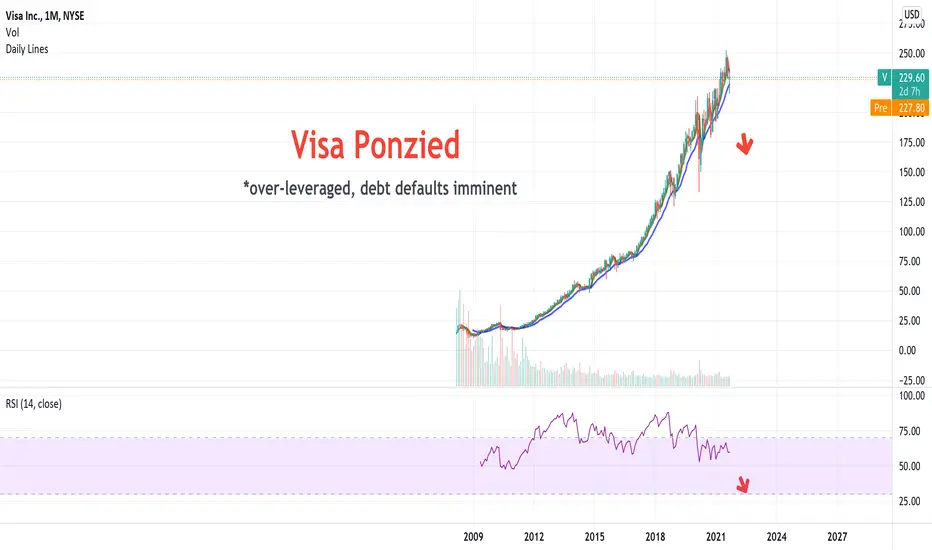
Visa Ponzied - Debt Defaults Imminent - Defi Disaster#oldhead single digit tickers. Ponzi Poggers. An oversaturated Finance, Defi, Crypto, Buy now Pay later, bla bla, Doge Dog.
What is money? #kingdollar #CBDC
*valuation matters
#cannabisreform #jobsandjustice #thegem
RSI Divergence SMALL SPIKE example
Hey, i found this SMALL Divergence then a breakout. When happens right after a key level on the Fib Lines of the GANN. I wish I spotted this trade when it happen. Wanted to post it what happens when the 14 and 30 periods of the RSI -mtf happens.

22sep 2021 trading analysis VDisclaimer:
This information is for educational purposes and is not an investment recommendation or representative of professional expertise. This analysis used herein is for illustration purposes only. This personal opinion should not be considered specific investment advice. I am not responsible for any trades, and individuals are solely responsible for any live trades placed in their own personal accounts.
- - - - - - - - - - - - - - - - - - - - - - - - - - - - - - - - - - -
long possition and follow yelow line
let's see
- - - - - - - - - - - - - - - - - - - - - - - - - - - - - - - - - - -
good luck, and happy profit
see you for next update
#keep learning bakkarianz metode
