45C trade ideas


$CRWD Crowdstrike $177 Breakout target
Earnings Highlights =
CrowdStrike (NASDAQ:CRWD) shares gain 11.3% AH after Q3 beats with 86% Y/Y revenue growth to $232.46M. Subscription revenue was up 87% to $213.5M.
ARR totaled $907M vs. the $853.8M consensus. Net new ARR was $117M.
CrowdStrike added 1,186 net new subscription customers during the quarter.
Customers with four or more modules increased 61% Y/Y, five or more modules increased 44%, and six or more by 22%.
"We continued to drive operating leverage and record unit economics. As a result of our strong execution in the quarter, we reduced GAAP operating loss year-over-year, achieved non-GAAP operating profitability for the third consecutive quarter and generated positive operating and free cash flow for the fifth consecutive quarter," says CFO Burt Podbere.
For Q4, CrowdStrike forecasts revenue of $245.5-250.5M (consensus: $231.4M), adjusted operating income of $18.5-22.1M, and EPS of $0.08-0.09 (consensus: $0.01).
For 2021, CRWD sees revenue of $855-860M, operating income of $46.4-50M, and EPS of $0.21-0.22.
Source Seeking Alpha

Crowdstrike still trying to breakoutCrowdStrike ( CRWD ) made a ~50% retracement off highs after last quarterly earnings reported declining sales acceleration and mediocre guidance. Sales is still up 84% YoY, which is awesome, but has steadily decelerated since Oct 2018 when it was up 149%.
After the retracement, the stock climbed back up to make a new high before falling back once again to the same support area at the 50% retracement .
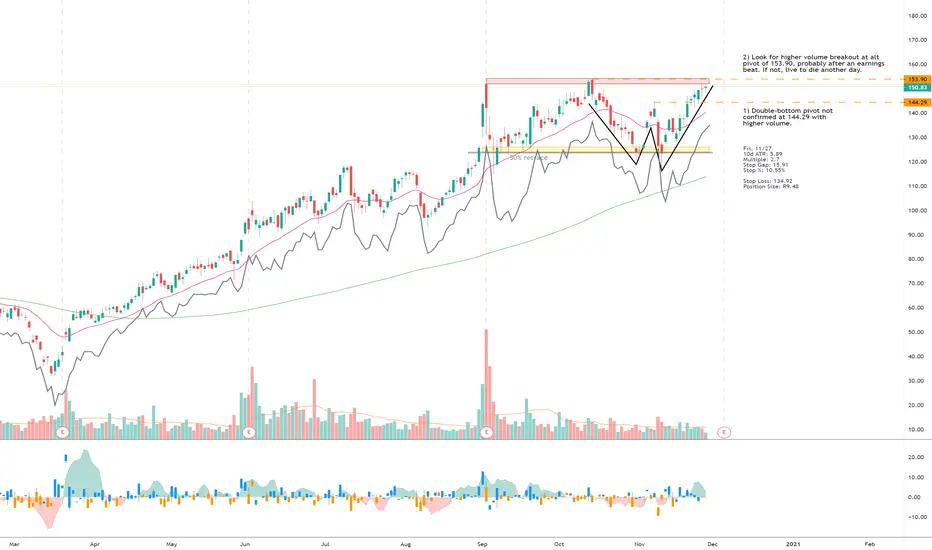
A double-bottom formed, but the pivot (middle high) was not confirmed by higher volume . However, you could look at the previous all-time high as a new pivot and look for volume to confirm. It would likely come after a better-than-expected earnings result (with hopefully an acceleration in sales).
The 10d ATR (x2.7) stop is at 10.55%, but I'd use a tighter technical stop at the previous pivot of 144.29. The tight stop is more likely to fail, but if it falls back to that point its better to cut losses short as something is wrong. But the tighter stop lets you use a position size of R16.03. Adjust R based on your confidence level, how much you are willing to lose when the crowd strikes back (sorry).
Buy Point: 153.90
Stop Loss: 144.29 (6.24%)
Position Size: R16.03

CRWD potential breakout Be disciplined, only buy the breakout.
I may only do day trades on this one this week.
Buy the breakout, watch it closely, take profits when it reverses, repeat.
I wont hold into earnings which is this Friday, if it pans out as a swing trade, I would sell the weekly's on Thursday.
I may not enter this position at all, depends on the weekly call option prices on Monday.

$CRWD #Breakout SetupOther than the angle of attack remark annotated on the chart, CrowdStrike has a lot going for it. The weekly chart looks much cleaner. Earing this coming Wed. could be the catalyst to take the stock over ATHs.


Crowd strike ATH soon CRWD is holding and upward attending strong heading into a pretty big pivot. With tech having an decent earnings season. I think it smashed into ATH range a day or two before ER

Crowdstrike (CRWD)$CRWD pressing up against the 1.618 ext level. Next target is the 2.618 ext level @ $215

Trade Update: Move stop to breakevenIngenuity Trading Model- Swing Trading Algorithm used in all markets- Stocks, Forex, Futures, and Crypto
The model is a Geometric Markov Model :
In probability theory, a Markov model is a stochastic model used to predict randomly changing systems. Markov Models are used in all aspects of life from Google search to daily weather forecast. The randomly changing systems we focus on are the equity, futures, and forex markets. The geometric element of the model is the fractal wave structure you can find on any chart you look at across any market and across all time dimensions.
Our model focuses on the current wave formation (current state)- geometric price formation along with its volume and volatility over a given time period and using that information to predict the future state- future price movement. For more information visit our website


Up trend, testing resistance lines, break out in Late March-Trading between upward trend support line and resistance line set in Oct. and Nov.
-A breakout from range in early Feb to test historic highs trend line.
-Trade between range until a breakout in mid to late-March 2021

CRWD Rebound WaveCRWD has posted a higher low in a correction wave pattern and has now remounted over the moving averages, which signals a continued trend upward to a higher high. Short term target would be 143 range.... and an extended target would be the top of the range around 148.

$CRWDTLDR: Short term bearish (dip buy opportunity) long term bullish .
Short term I see this hitting $114 as it looks like triple descending peak, Should find support at the bottom of the trend line and bounce. ultimately I am bullish as it looks to be bull flagging.
(Not trading advice, for personal reference use with discretion)

ABC BullishPattern valid at LE (Long entry) level with a confirmed uptrend
CRWD is over LE level but pulled back significantly on Friday
Possible T2 195 to 216/long term targets and perhaps focus on T1 for now
Possible stop under C or 118
Look at the last weekly candle. It is long with confirmed support at 118ish
No rising wedges in the yearly chart
Just an observation

I'm going long CRWD into earningsBuy CRWD stock or buy to open CRWD 150 calls (Dec 18) going in Dec 04 Earnings.
Exit strategy:
Sell stock or calls at 150, or approaching 175 if you can stomach it.
Again, around Dec 04 Earnings.


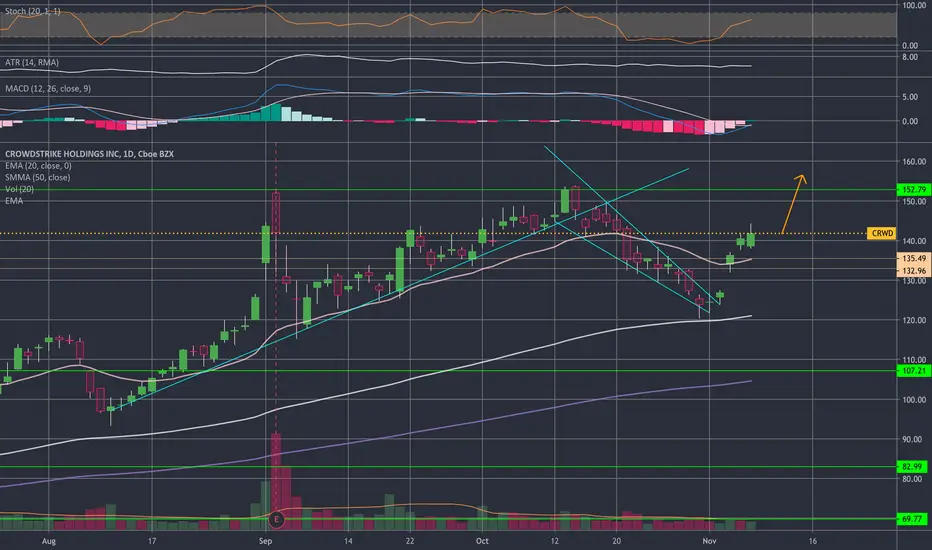
$CRWD - 3rd approach on resistance - will it break? Other indicators are showing supportive signals: ATR, MACD, and Stochastic
Will resistance be broken? Time will tell
CRWD might break out to the upside ! CRWD has broke above MA 21 and is challenging MA 50. Meanwhile, MA21 is going to cross over MA 50 if this momentum could hold for one or two days. A failure to break the neckline of the doulbe top pattern could indicate that price could jump higher !

dip buy is here!id add here with shares and stop loss of 15, if you are doing options wait for the top trendline to break. gl <3

$CRWD 200 MA Magnet Idea$CRWD look good to anyone else? good bounce area if confirms. Please keep the current environment in mind, could keep going lower.
