ABBV Whats next?I LOVE today's candle.
1. Inside candle
2. indecision candle
3. with a nice volume
4. creating higher highs
5. forming a triangle
6. re-testing the trend line
7. re-testing the neck line if the w
8D. Its like compression at 10000%. Just waiting to see what @ABBV is gonna do!!!
4AB trade ideas

Equity Seasonality and Bear Market Sector and Stock Selection Seasonalities are regular and predictable patterns that recur every calendar year. Every industry exhibits unique seasonal trends that are based on fundamental drivers. The best-known seasonal drivers include harvest periods, the timing of interest payments, weather, and investor sentiment. At certain times of the year, tax and balance sheet deadlines, annual or quarterly financial reports, as well as traditional patterns, such as the year-end rally in the stock market all create regular seasonal tendencies. These patterns occur across individual equities, commodities, and indices. Statistical analysis of these seasonal trends and patterns can be an extremely important part of a trading approach. In this piece, we combine this seasonal approach with our approach to sector investing in bear markets to provide examples.
When the S&P 500 hit bear market territory on June 13 2022, many investors were left with the bitter taste of disappointment. But this wasn’t happening for the first time: since 1928, the S&P 500 has experienced 26 bear markets.
“Bears” are part of normal market trends. They are relatively short in duration (especially compared with bull markets), and can provide good investment opportunities. They come into existence when a market falls by at least 20% from recent highs.
In our process, we combine balance sheet analysis, sector selection and seasonality. During bear markets, it’s important to concentrate on good balance sheets in “recession-proof” sectors. Most stocks suffer during a recession, but there are sectors that are much more likely to outperform the broad market.
In my previous Seasonal Insights, I have discussed luxury stocks (these insight pieces are available on our website) that have proven their strength during difficult times. It is an industry that resists crises: luxury customers, due to their financial wealth, recover very quickly.
Stocks that tend to outperform during bear markets can be found in defensive sectors, such as consumer staples, utilities and healthcare. Healthcare is a great example of a haven. One of the stocks to consider from this sector is pharmaceutical giant AbbVie. AbbVie is known as a “low-volatility dividend aristocrat.” This posh expression refers to a group of high-quality S&P 500 stocks recognized for delivering at least 25 straight years of dividend growth.
If you decide to enter this trade you should consider its seasonality. Seasonality will offer you the best entry and exit points for a specific stock during the year. It will also prevent you from investing in a name that is entering a seasonally weak period.
Keep in mind that a seasonal chart depicts the average price pattern of a stock over the course of a calendar year. It is calculated over several years (unlike a standard price chart that simply shows stock prices over a specific time period). The horizontal axis depicts the time of the year, while the vertical axis shows the level of the seasonal pattern (indexed to 100). From the chart above, it is clearly visible that the end of October until the end of December, over the past 9 years, have been favorable months for this health stock.
In this time span of 46 trading days (from October 24 until December 30), shares rose on average by almost 14%. Moreover, since 2013 the pattern returns had a winning strike of 100%, meaning that AbbVie Inc generated gain each year since 2013 during the selected time period.
There are also other stocks that are trending high in this sector, such as Pfizer, Eli Lilly, or even insurances like United Health, Anthem and Centene.
Another consequence of a recession is that many consumers will curb their spending. However, consumers still need to buy staples such as food, household goods and hygiene items. Demand for these tend to hold up better than other areas of the economy.
Large food manufacturers such as Tyson Foods, Kellogg and Mondelez International all fall into this category as do large agribusinesses that focus on the raw materials used in food production, such as Bunge or Archer-Daniels Midland.
During difficult times, consumers also tend to look for cheaper alternatives from discount retailers. Even if people shop less during a downturn, they still need to buy staples, and are more likely to treat themselves to a cheaper item at a discount store. Dollar Tree was the best performer in the S&P 500 during the 2008 financial crisis, and was up significantly that year even as the overall market plummeted.
There are also personal care and household product manufacturers such as Colgate-Palmolive and Procter & Gamble. All these stocks suffered a smaller decline than other areas of the stock market during the 2008 financial crash and most of them bottomed out months before the broad market.
But still be aware of the investment timing. Each stock mentioned here has its strong and weak periods during the year. For instance, Kellogg is worth considering after the August – September period of weakness.
Remember, for every bear market, a bull market follows.
Yours sincerely,
Tea Muratovic
Co-Founder and Managing Partner of Seasonax
Guest Author for CMT Association
seasonax.com
Many of the topics and techniques discussed in this post are part of the CMT Associations Chartered Market Technician’s curriculum.
Shared content and posted charts are intended to be used for informational and educational purposes only. The CMT Association does not offer, and this information shall not be understood or construed as, financial advice or investment recommendations. The information provided is not a substitute for advice from an investment professional. The CMT Association does not accept liability for any financial loss or damage our audience may incur.

ABBV to 140?I would love it @ABBV goes down to $140.~ to re-test that neck line. It might not happen good volume coming in but to me it would be stronger if it re-test that level.

#ABBV long ideaHello dear Traders,
Here is my idea for #ABBV
Daily close above the yellow trigger line (previous month high) to enter trade.
We try to anticipate a 2-2 bullish reversal in the weekly chart - price found support at monthly pivot S2 Line
Targets marked in the chart (black lines)
Invalidation level marked with red line
Please feel free to ask any question in comments. I will try to answer all! Thank you

Stock movement looks familiar.Will the pattern hold?
Also, Botox rival, Revance Therapeutics, got approved. Longer lasting than Botox. Remains to be seen if it can eat into ABBV's market share.

AbbVie Inc, ABBV NYSE 4HNYSE:ABBV
rsi in the oversold territory, which is starting to reverse to the bull side,
flipped bullish on a micro timescale, falling wedge, breaking out to the upside,
first target 140.75, then possible retest before 146.26.
we've been in this long term downtrend channel since April 2022, I expect to break out of it, once
we test 150.36 flip it as support then go for for 175.89 previous April top. fundamentals and news tend
to effect this stock a lot, so with positive momentum and good news. bullish times could be ahead.
Bear scenario is we test 125 before a full reset.
For the current quarter, AbbVie is expected to post earnings of $3.59 per share, indicating a change of +7.8% from the year-ago quarter. The Zacks Consensus Estimate has changed -2.2% over the last 30 days.
The consensus earnings estimate of $13.90 for the current fiscal year indicates a year-over-year change of +9.5%. This estimate has changed +0.2% over the last 30 days.
all this is just my opinion , none of what I say should be taken as financial advice. DYOR
Regards Percy

ABBV ShortBounce back to supply Zone, Zone Confirmation
Trendline break
Earning: 7/29/2022 Est. 3.43
Short 152
Stop 160
Target 137, 122
Risk management is much more important than a good entry point.
I am not a PRO trader.
In my trading plan, the Max Risk of each short term trade should be less than 1% of an account.

abbv stock again bullish trend abbv stock again bullish trend markete makes a lowr low and divergence makes a high and high

ABBV- Bull Flag Pattern What call option is suggested?NYSE:ABBV
ABBV could breakout from a bull flag pattern on the daily chart
It is sitting on the support of a triple bottom, and an 8% upside
to the POC of the volume profile. as well as a 14% upside to
the high 3-4 months ago.
What would be a good option 5-6 months out to capture
the anticipated uptrend over that time?

$ABBV with a Bullish outlook following its earnings #Stocks The PEAD projected a Bullish outlook for $ABBV after a Negative Under reaction following its earnings release placing the stock in drift D with an expected accuracy of 50%.

ABBV ready to bounce? AbbVie
Short Term
We look to Buy at 138.60 (stop at 133.69)
Preferred trade is to buy on dips. There is scope for mild selling at the open but losses should be limited. We therefore, prefer to fade into the dip with a tight stop in anticipation of a move back higher. Further upside is expected although we prefer to set longs at our bespoke support levels at 139.00, resulting in improved risk/reward.
Our profit targets will be 152.11 and 171.00
Resistance: 146.00 / 155.00 / 172.00
Support: 139.00 / 135.00 / 126.00
Disclaimer – Saxo Bank Group. Please be reminded – you alone are responsible for your trading – both gains and losses. There is a very high degree of risk involved in trading. The technical analysis, like any and all indicators, strategies, columns, articles and other features accessible on/though this site (including those from Signal Centre) are for informational purposes only and should not be construed as investment advice by you. Such technical analysis are believed to be obtained from sources believed to be reliable, but not warrant their respective completeness or accuracy, or warrant any results from the use of the information. Your use of the technical analysis, as would also your use of any and all mentioned indicators, strategies, columns, articles and all other features, is entirely at your own risk and it is your sole responsibility to evaluate the accuracy, completeness and usefulness (including suitability) of the information. You should assess the risk of any trade with your financial adviser and make your own independent decision(s) regarding any tradable products which may be the subject matter of the technical analysis or any of the said indicators, strategies, columns, articles and all other features.
Please also be reminded that if despite the above, any of the said technical analysis (or any of the said indicators, strategies, columns, articles and other features accessible on/through this site) is found to be advisory or a recommendation; and not merely informational in nature, the same is in any event provided with the intention of being for general circulation and availability only. As such it is not intended to and does not form part of any offer or recommendation directed at you specifically, or have any regard to the investment objectives, financial situation or needs of yourself or any other specific person. Before committing to a trade or investment therefore, please seek advice from a financial or other professional adviser regarding the suitability of the product for you and (where available) read the relevant product offer/description documents, including the risk disclosures. If you do not wish to seek such financial advice, please still exercise your mind and consider carefully whether the product is suitable for you because you alone remain responsible for your trading – both gains and losses.

#SuakuFlowsWatchlist - 3/8/22#SuakuFlowsWatchlist
EXP: 5AUG22
$ABBV 143C > 142.84 | 140P < 140.10
EXP: 19AUG22
$SIGA 20C > 19.14 | 15P < 17.14
Yellow = Supply Zone
Blue = Demand Zone
Here's my focus list going into tonight's session 🌊

ABBV - UPDATE!I was away from TradingView for a few days, but I'm back now and continue to look at the market and look for ideas!
Updating ABBV idea:
Well, after the report, we teleported to shoulder level.
And now several scenarios are possible:
1) Shoulder bounce
2) Shoulder breakout
Which one am I more likely to go with?
A shoulder breakout.
But is it worth taking a position right now?
I don't think it's best to be in it from the day of the report.
I'm not in a position, just watching.

my idea is abbv is short selling my idea is short selling abbv harmonics bat pattern his projection is 140 tp high low entry

ABBV - What's going to happen?I think this stock should be added to your Watchlist.
Here we can debate what's coming:
1) Inverse Head and Shoulders
2) Bull Flag breakout.
If we break down the channel - I would likely try a short.
But don't rush to buy the flag - the best thing is to wait for a breakout confirmation!
And what do you expect?

ABBV LONGGood volume push from lows and then sideways action on low volume, looks really good for a breakout above 154
JUL 22 155C can work

$ABBV looking to come up on the right side of its base!Notes:
* Great earnings track record
* Very strong up trend on all time frames
* Pays out dividends
* Coming up on the right side of its base after ~4 months
* Has been in a tight range of ~3.8% for the past 3 weeks
Technicals:
Sector: Healthcare - Drug Manufacturers - General
Relative Strength vs. Sector: 1.91
Relative Strength vs. SP500: 1.54
U/D Ratio: 1.76
Base Depth: 26.75%
Distance from breakout buy point: -13.75%
Volume 8.02% above its 15 day avg.
Trade Idea:
* You can get in now as the price is very close to its 50 day line and has been using it as support for the past 3 weeks
* If you want to be safe you can wait for the breakout from this tight range with a break above 154.07
* This stock usually has local tops when the price closes around 10.96% above its 50 EMA
* Consider selling into strength if the price closes 10.76% to 11.16% (or higher) above its 50 EMA
* The last closing price is 0.11% away from its 50 EMA


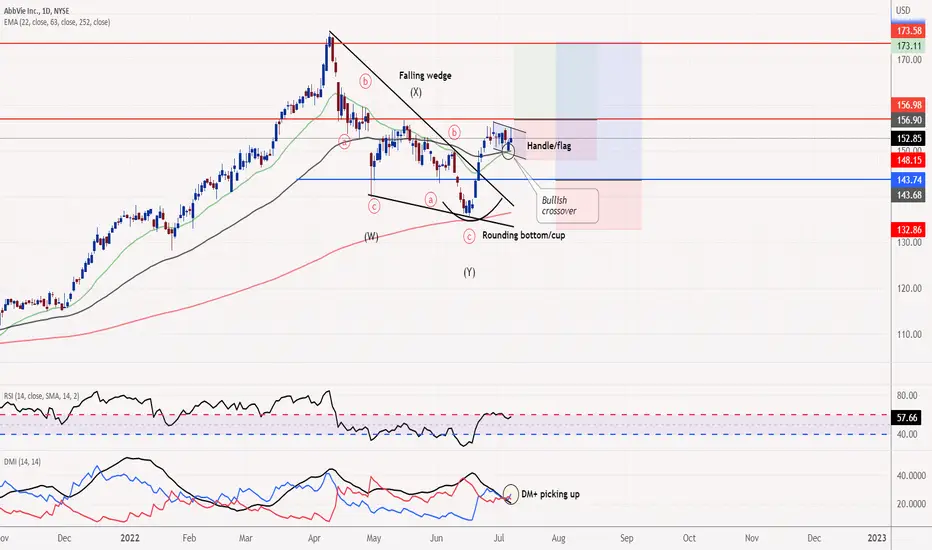
Two strategy approach to ABBV, buy on throwback or a break outABBV has broken out of the falling wedge and with that, it confirmed the terminal end of the correction. With the recent cup and handle formation, we think that a bullish upside may come however, Friday's shooting star is a concern and as such, we will place the buy order at US$156.90 to confirm the breakout trade. Another strategy we have in mind is to wait until prices retrace to their nearest support at US$143.74 to anticipate a rebound.
ABBV - FUNCHARTS - Follow the TrendNote: Funcharts are interesting charts I have found that offer a potentially unique perspective on a stock. Sometimes I’ll throw something out there that you might find controversial or wrong headed. If that’s the case your 2 cents worth is most welcome.
Abbvie (ABBV) listed on the US market sets up nicely as a Trend Following stock. If you are in Tradingview insert the Supertrend Strategy and change the inputs to a 50 period ATR length with a factor of 2 times ATR trailing stop.
The strategy will buy when the daily closing price closes above the ATR trailing stop and go short when the price closes below the ATR trailing stop (shown in blue and red on the chart).
A look at the performance summary for long trades shows 44% winning trend with a win:loss ratio of 2.22 with a profit of over 109% through the period. Whilst buy and hold was the best strategy overall the drawdown was much lower for the trend following strategy and almost as much money was made. Stock like this that trend nicely, whilst allowing you to manage downside risk can be used with a certain amount of leverage as it follows the age old mantra of letting profits run and cutting losses early.
As with all trend following strategies, a low win rate but high win:loss ratio is to be expected.

$ABBV #supertrend #breakout#ABBV Breakout 🚀 in 1h Chart - Target 170$ 🧲
All Entry Criteria have been met:
1. Price above 10, 20 & 50 EMA ✅
2. Consolidation Phase in Uptrend ✅
3. Breakout on above average Volume ✅

potential double top in play 🔔should see a move lower after this rejection from resistance/rejection from overbought RSI zone.
stop loss above resistance and targeting 150.49-143.35-135.71

ABBV Still continuing its breakout from that Trend Line.ABBV - Still going if you like to play the 8/21 EMA cross up using Renko Charts & Ripster EMA Clouds. Also solid continuation once the Green Clouds crossed above the Yellow Clouds and broke the TL up.
