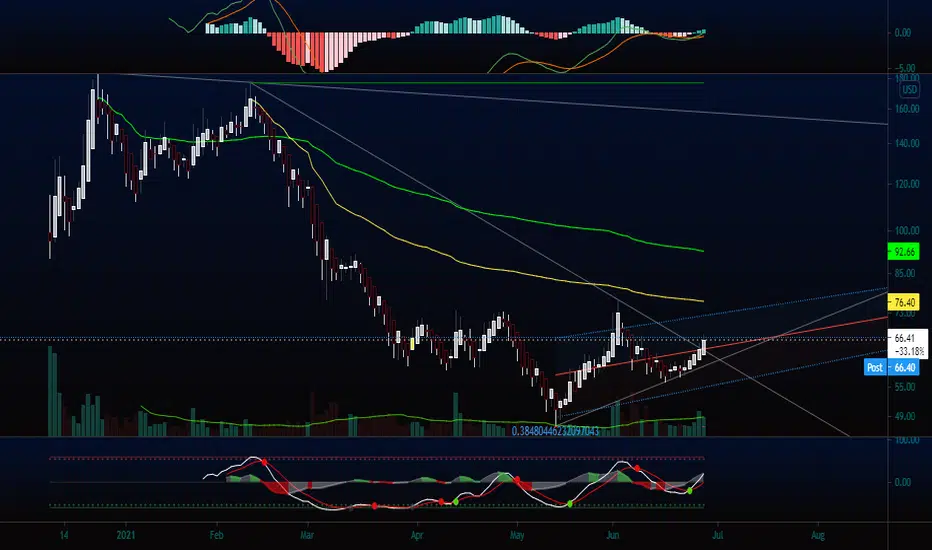
🟢 NEW POSITION $AI Target 86.22 for 46.43% $AI Target 86.22 for 46.43%
Or double position at 31.54
With optional adds at 54.30, and 56.33
—
On the far right of the chart is my Average (Grey) Current Target (Green), and Next Level to add (Red) Percentage to target is from my average.
I start every position with 1% of my account and build from there as needed and as possible.
I am not your financial advisor. Watch my setups first before you jump in… My trade set ups work very well and they are for my personal reference and if you decide to trade them you do so at your own risk. I will gladly answer questions to the best of my knowledge but ultimately the risk is on you. I will update targets as needed.
GL and happy trading.
I finally added my YouTube Training Video to my profile tagline since I’m not allowed to on here. It’s a quick 15 minute training video on how to set up your chart and how to spot opportunities. So check here first but If you have questions just message me.
If you understand options at all I’m trying to learn so shoot me some pointers…
724 trade ideas


C3.AI, INCInverted Head & Shoulder Plus going to break the Ascending Triangle towards. Target on the chart.


AI could break out,but maybe reject dubbeltop.
but overall, good fundamentals. good hold..
safe al
Stone.
AI - Inverted Head and Shoulder Bullish ReversalFollow up on Apr 9 sharing, AI has major upside potential, with the spring testing and confirming the strong support at 58$.
Currently forming an inverted head and shoulder, Price & RSI forming higher lows with strong green candles.
Previous Idea :


AI making bullish inverse H&SAI has completed left shoulder and head already and trading around the parallel support channel. If it is able to hold this level, I am hoping this to complete the right head and also give a breakout.
SL below parallel support channel


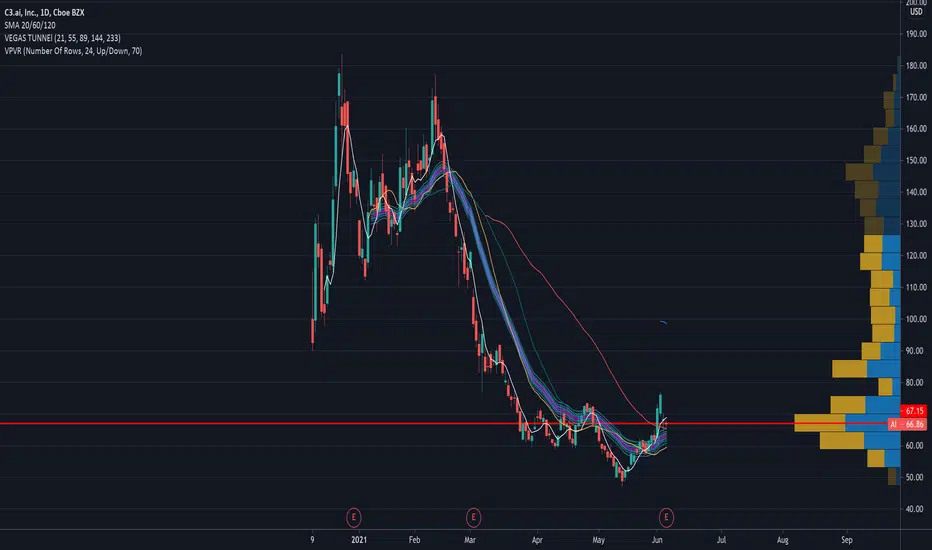
Inverse H&S Shoulder Pattern Based upon the volume profile, AI's stock has been in basing stage since March. An Inverse H&S has been forming since late March and the right shoulder is starting to form. According to standard technical analysis, it is only confirmed upon a break above the neckline however, the neckline is 13 points away.
I would much rather accumulate AI here considering if the pattern plays out my risk:reward is 1:5. Let me know what you think.
If you like this idea, be sure to hit the like button or follow me.

$AI wave 3 setupI said I wasn't going to take anymore plays, but this one is literally gold.
Haven't seen a setup this clean in months!
I believe that AI has finished Wave 2, and is about to start a Wave 3 impulse.
Wave 3 target = $124
Wave 5 target = unknown (don't wanna look too far into the future)

AI - Cup & Handle formed wellAI - Cup & handle formed with falling wedge , watch for break out of the wedge for long calls
Watch fib levels for target prices

6/5 AI(1) AI has huge volumes within current range, while less above it
(2) if AI could consolidate good at current level, I believe there would be a strong run afterwards

AI Bullish Ascending TriangleAI looks to have formed an ascending triangle, it has also crossed through the 50 EMA (which can act as an area of support later), and has bullish MACD momentum as well on the daily chart.
Over the last month the stock has formed higher-lows, it looks to retest an area it failed to break, the $70 resistance level that has held for the past few months.
In order for this analysis to be valid the stock must break through the ascending triangle pattern and see a push upward.


I am holding AI until summer.Then I might have earned my losses back. I did not cut losses in time. But as you can see from my chart - I notice a divergence in volume and price action and I think we will see an upward move soon.
