$AFRM - Reversion to Trendline SupportHigh chance $AFRM falls down to the trendline support over the coming days, maybe even lower as it looks to fill the gap.
Take note of the volume shelf underneath! Once the bleeding stops I'm willing to bet we stop around 65 or 70 allowing us to load a long position into earnings!
78P trade ideas

Bulls will get paid later?AFRM nasty action if you are long side. What i am seeing is continued blood potentially for AFRM. Due to low RSI we can see a pump to retest 87.46 area a break above it sets a neutral sentiment. A rejection at that level will bleed us back to the support zone thats building at the 80.00 level. A break there will send us to last tested support which would be 67.82

AFRM: Gann Fans, AFRM is currently Trading below its 50/20 MA and its 12/26 EMA
the 12 EMA just crossed under the 26
Note the gap fill attempt
Using the Gann, it looks like support can be assumed along the 3/1 upangle and the 2/1 upangle to act as resistance if AFRM is to turn around
By using the 3/1 upangle AFRM may attempt that turnaround.
Assume the 3/1 downangle as resistance for the next 4-6 weeks as well unless broken by the 3/1 upangle
In my opinion, AFRM is finding a bottom soon
If AFRM decides to fill the gap in the next few weeks, I would look to the 8/1 to be support and this would indicate more bearish price action. ( Lower Lows would be set).
Neutral now, will update as time progresses on this one.
I would suggest keeping an eye on the options chain as well, big rolling down of calls and some big BTO purchases came in today as well.
Ticker Side Stirke C/P Date Spread Spot Size Prem OI Volume
AFRM BUY 95 call 2022-02-18 $7.15 - $7.40 $7.65 15,200 $11.6M 381 16.1K Floor
AFRM BUY 105 call 2022-05-20 $7.60 - $8.20 $8.25 13,950 $11.5M 642 15K Floor

$AFRM is looking strong hereAFRM is a strong support position in the high 90s to 100s, with the recent probes into the BNPL sector considered old news, I see AFRM with some tailwinds and going upwards.

AFRMPushing off from a weekly support and forming an ascending triangle on hourly. Expected a move to the upside.

$AFRM super bullish!!!If you came for some sort of bearish analysis on $AFRM, then you're in the wrong place.
Every indicator, signal, chart, and analysis that I could possibly do tells me this thing will run within the next month or less.
1. FLOW SUPER BULLISH
2. Insider buying... plus hedgies buying
3. Analysis wise, it's breaking out of the downtrend support line and is currently in the bounce after the retest phase... this is where you enter.
4. The bottom indicator that has a yellow circle around it shows me if the whales are still in/buying and what the current sentiment is around the stock. For $AFRM, it is as high as ever and people are just loading up on this name.
WHAT TO WATCH:
$AFRM 01/07/22 105c
$AFRM 02/18/22 110c
$AFRM shares

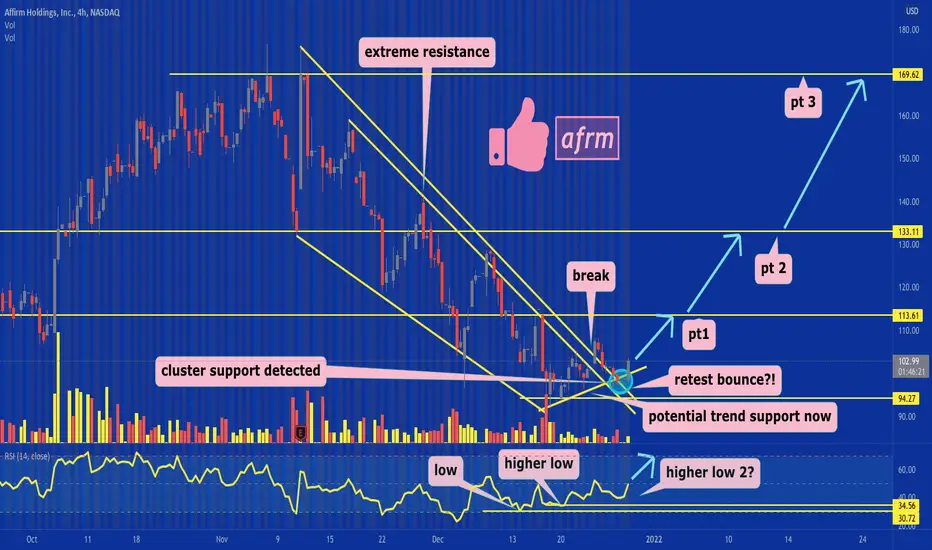
afrm update! the bottom looks like its in to me 🚀afrm breaking the extreme downtrend resistance I mentioned in my previous analysis, after the break it did a retest bounce, also seeing continuation of higher lows on the RSI.
all these signs show us bulls are gaining control, finally! my price targets for early-mid 2022 are 113.61-133.11-169.62
like and follow for more 💘
Looking for opinionsAFRM in my opinion should go down however options market is not pricing as if it expects a move down
i the calls at 100 110 all the way to 150 a good chunk of these options expire within the next three months
green channel was broken downwards this morning and the downwards channel was also escaped and is now acting as a downwards trend support
option levels on chart in red line

$AFRM - Retest At SupplyAfter having a wonderful breakout of it's falling wedge, $AFRM has come back to retest the supply zone.
This provides us with an awesome long opportunity. PTs : 113, 128.

$AFRM #AFRM pattern break out STOP LOSS BELOW 100
TARGET 125
RR: 5:1
After hitting a high of 180 in November, AFRM has reclaimed the psychological level of 100
interested to see how this one plays out


$AFRM - Falling Wedge Breakout$AFRM had a wonderful falling wedge breakout alongside a reclamation of a former support turned resistance.
I'm expecting this ticker to run over the coming days and weeks. PTs : 113, 128.

ABC BullishPossible stop below C.
This is NOT to long entry level.
There is a gap below price that is partially filled.
No recommendation

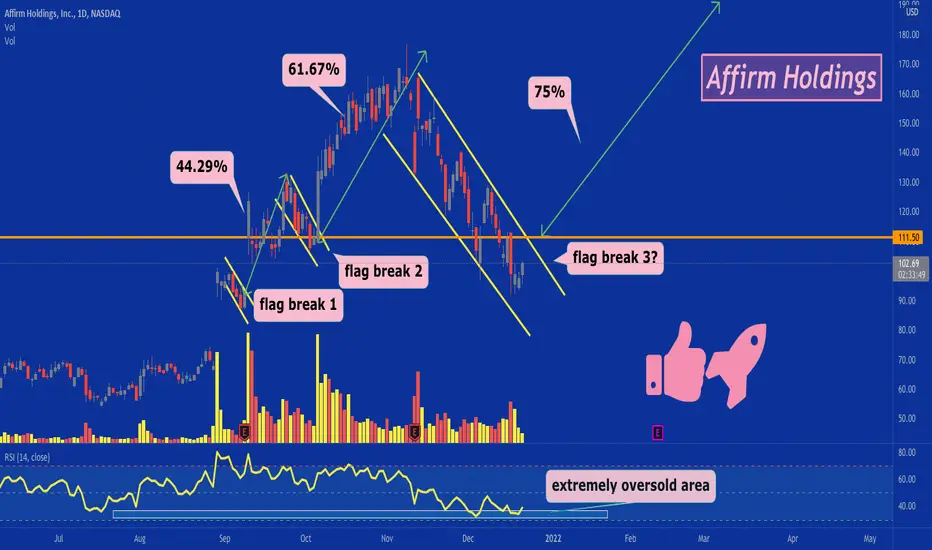
AFRM has a lot of potential! 🚀afrm has broken 3 downtrend flags lately, each has taken longer to break but was also followed by a bigger breakout each time.
first flag breakout did 92.29-133.17 for a 44.29% return.
second flag breakout did 109.20 to 176.65 for a 61.76% return.
this 3rd flag breakout has potential to do 112-210 for 75% gain.
this is only if history continues to repeat itself, considering all the call flow coming through today, its very possible in my opinion. It may take a while though!
goodluck, like and follow for more 💘
AFRM - Inside Day Break out or DownAFRM has broken down a lot since its high and is sitting at an inside day.
I will be taking weekly 90P under 92.34 and 105C over 102.39 (I generally take calls 2 weeks out)
My rule is to wait at least 15-30 minutes into the day for the market to pick a direction especially if we gap up or down i wait for a retest.

AFRM set up for a RIP upwards per bullish wedgeWas curious and saw a nice bullish wedge pattern. Totally oversold, and was at almost 2x the price a month or so ago

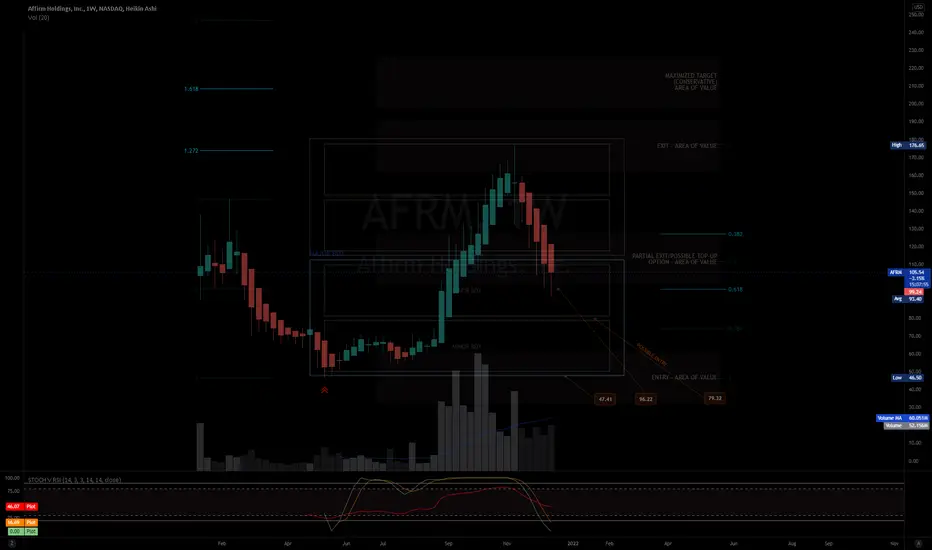
MY MINIMALIST CHART ANALYSIS AFFIRM HOLDINGS INC.$AFRM
12.17.21
1351H +8 SINGAPORE
Disclaimer:
The findings of the following analysis are the sole opinions of the publisher of this idea and should not be taken as a piece of investment advice.
ALERT:
LOOKING FOR BEST ENTRY
We are now looking at a NEW ENTRY POINT in which the market has contracted significantly.
VITAL SIGNS: RSI, STOCH, and VOLUME are all looking good.
The Market had amazingly moved along the TOPS and BOTTOMS of our BOXES, signifying TURNING POINTS of PRICE ACTION, and verified by major FIB levels.
Hoping that this MINIMALIST BOX CHART ANALYSIS will efficiently help you with your DYOR as we climb a NEW SWING CYCLE.
Happy Trading Everyone!
INSTRUCTIONS: HOW TO USE THIS MINIMALIST CHART
"FOLLOW THE WHITE RABBIT!"
Just Follow the TOPS and BOTTOMS of the BOXES as a GUIDE where the MARKET will take you.
Created on a MONTHLY, WEEKLY & DAILY Analysis of a MARKET'S CHARACTER.
It is designed for SWING TRADES at the LOWEST or START of a SWING CYCLE.
TARGET ZONE IDENTIFICATION
The LARGE BOXES (Tops and Bottoms) are MAJOR turning points that will occur sometime in the future. While the SMALL BOXES (Tops and Bottoms) are MINOR turning points.
These can be entries to a BUY/ SELL POSITION, EXIT/PARTIAL EXIT/TOP-UP AREAS, as well as Support and resistance levels
Also includes MAXIMUM TARGET EXIT AREA OF VALUE - CONSERVATIVE (If price action conditions are right at that given moment.)
At times I include WAY BEYOND PARABOLIC Price TARGETS depending on The Character of the Market (CRYPTOS ONLY).
DYOR for your Volume, Chart Patterns, Candlestick Math, FIB COILS ( ABC ), Price Action, FIB LEVELS, Market Dynamics, especially institutional and retailer trading psychology.
NOTE: That PRICE TARGETS for ENTRY and EXITS are DYNAMIC and can CHANGE from time to time, depending on the dynamics of the market.
Wishing you all The Best Trades and Thank you all for your Appreciation and Support of My Work.
Much thanks to My 3 Mentors. They are so much of a Blessing that I also wish to share my knowledge.
Vive Le Autist!
Vive Le Diamond Hands!
$AFRM - I'm not sure butI want to buy this stock but will wait for a lower price level. Also concerned as to the catalyst that could push it lower (i.e., lower price due to: broader market weakness, or company specific news, or credit concerns for BNPL?)


$AFRM starting analysis...Now that BNPL (Buy Now Pay Later) is souring, higher defaults, target demo less likely to be able to pay back, that puts the entire business model of Affirm at risk. Not to mention that there is almost nothing proprietary about the theory of buy now pay later (credit cards). So If we wanted to take a flier that this company is overvalued by several billion, I could get there. Going to watch post FOMC and see if there is a long term put lotto that I could hop on and ride for a month.

AFRM$AFRM bounced nice today off trendline support followed by feb 2022 110$ & 120$ call sweeps. Looks interesting if market turns bullish.

AFRM TECHNICAL ANALYSISafrm is in an overall downtrend at the moment.
huge gap on the daily chart.
feel free to give and/or suggest advice on anything.
