$ADBE deteriorating MOAT ; Still Expensive; PT < $350- NASDAQ:ADBE is one of the blue chip company of the last decade.
- However, Chicken has come to roost.
- Core products of NASDAQ:ADBE like acrobat are useless. One can use ChatGPT or any AI tool to parse and get the information. Google Doc for creating a PDF
- Adobe designer tool might still be used but AI tools are taking over which provides done for you. Apart from that Canva & Figma are way better and easier to use NASDAQ:ADBE
- NASDAQ:ADBE products are hard to use and have huge learning curve. On top of that, NASDAQ:ADBE engages in shady subscription practices where it doesn't let user cancel subscription and ask people to go through customer support potentially delaying cancellation to bill users.
- NASDAQ:ADBE despite having huge datasets of images isn't able to launch a good AI model. Firefly by Adobe is Joke and not good enough.
Fundamentally, it is still trading at a premium.
Year | 2025 | 2026 | 2027 | 2028
EPS | 20.39 | 23.01 | 25.56 | 27.02
EPS % growth | 11.61% | 12.82% | 11.11% | 5.72%
Base Case ( Lenient ):
Ideally, for a blue chip company with a MOAT growing EPS at 11-15% ; Failr forward P/E should be 20. For them, who are willing to pay forward p/e of 20
Year | 2025 | 2026 | 2027 | 2028
Stock price (F. p/e = 20) | 407 | 460 | 500 | 540
Base Case ( conservative ):
However, I believe NASDAQ:ADBE MOAT has been severely challenged and should doesn't command a premium multiple. Therefore, according to me, fair forward p/e should be 15
Year | 2025 | 2026 | 2027 | 2028
Stock price (F. p/e=15) | 305 | 345 | 383 | 405
Extreme Bear Case :
If we account for recession, We could see further compression in forward p/e ~ 10. Extreme bear case, where they miss EPS or revenue or both and guide lower.
Year | 2025 | 2026 | 2027 | 2028
Stock price (F. p/e=10) | 200 | 230 | 255 | 270
Bull Case ( F. p/e = 25 )
Year | 2025 | 2026 | 2027 | 2028
Stock price (F. p/e=25) | 509 | 575 | 639 | 675
ADB trade ideas

ADOBE buy BiasWith the current bearish move on the NASDAQ - we can expect Adobe to move towards that weekly/daily Demand zone and fill a Long position to the upside.
Vaulation and seasonality align with stocks and indices - we should find a bottom to this drop on all indices Mid-End of April 2025.
Trade safe!

Adobe Long: clean completion of wave structureFrom the chart and waves drawn, I expect Adobe to have completed its correction. The long position drawn here will be considered a conservative target.

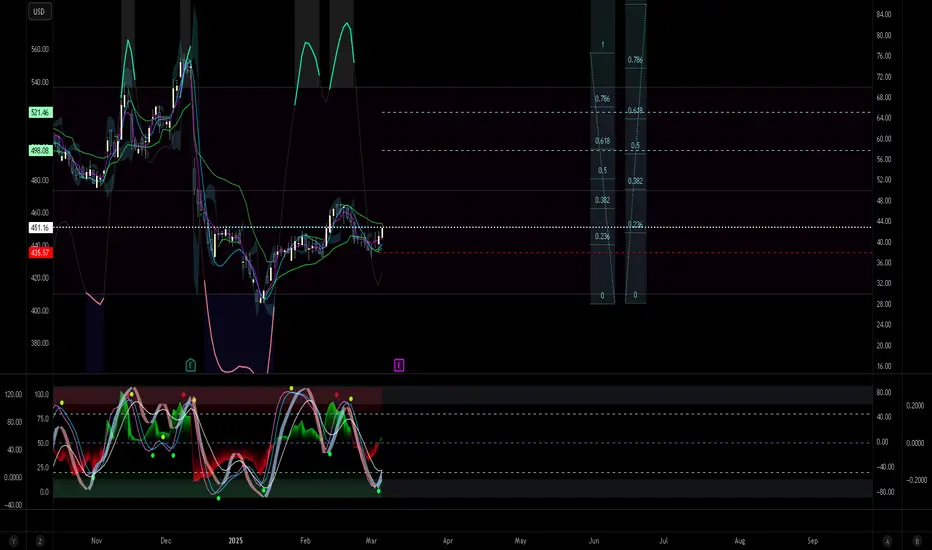
ADBE - Adobe at the decision levelIf ADBE is able to jump above the Centerline, it probably will retest it, and then take off to the upside.
If ADBE is not able to crack the CL to the upside, then it's new projection is to the downside.
The natural target is the L-MLH.
But let's not forget the 1/4 lines!
These often act as good support. Specially with a catalyst like good News around the same time, it could bounce from there. So, that's why one of my PTG is always at these 1/4 line levels.

ADBE watch $388: Earnings Dump hit major support zone for a buy?ADBE earnings disappointed, dropping price to a major support zone.
$ 387.21 - 387.97 is the exact zone of interest that bulls need to hold.
Ideally this is a bottom at which to consolidate and then move North.
============================================================
.

Adobe (ADBE) Shares Plunge, Holding Near 22-Month LowsAdobe (ADBE) Shares Plunge, Holding Near 22-Month Lows
Last week, Adobe Inc. (ADBE) reported its quarterly financial results:
→ Earnings per share: Actual = $5.08, Expected = $4.97
→ Gross revenue: Actual = $5.71 billion, Expected = $5.66 billion
Additionally, according to CNBC, the design software giant announced plans to double its AI revenue by the end of the financial year. However, despite these positive figures, Adobe Inc. (ADBE) shares plummeted by approximately 13%, returning to price levels last seen in May 2023.
This decline may reflect investor concerns over Adobe’s AI monetisation strategy and the potential loss of its competitive edge in generative AI.
Technical Analysis of Adobe Inc. (ADBE) Shares
Price movements have established key points (marked with circles) forming a downward channel, which has remained relevant for over a year:
→ The price has fallen to the lower boundary, which previously acted as support in June 2024.
→ It remains below the psychological level of $400 but has not dropped significantly further.
→ The price has not fallen below the 13 January low, recorded after the earnings report.
These factors suggest that demand is preventing further declines in ADBE shares. If positive catalysts emerge, buyers may attempt to push the price back above the $400 level, potentially opening the path towards the channel’s median.
This article represents the opinion of the Companies operating under the FXOpen brand only. It is not to be construed as an offer, solicitation, or recommendation with respect to products and services provided by the Companies operating under the FXOpen brand, nor is it to be considered financial advice.

Adobe is About to POP April 11, 2025 - No Guarantees...Adobe has completed a 1st wave in a series of waves (3 up ), and then it has completed also a reactive, or is about to complete the reactive, and following time frames it indicates that April 11, 2025, we should start seeing the big bounce to exceed the $600 range. These moves are never a guarantee, however, I think that this prediction is quite plausible.
Good luck and be prepared and ready and don't be short Adobe.

ADBE to $465 - Chance for a BounceNASDAQ:ADBE ADBE, as well as other tech stocks, was beaten hard over the last couple of months. The earnings recently did not provide any relief for the chart either, although the figures were not particularly bad. In particular, the possible prospect of finally being able to expand and monetize Adobe's own AI “Firefly” continues to offer good opportunities.
With a PE of now under 20, Adobe has become quite favorable as a company that continues to grow well in the SaaS sector. It has also reached several technical support zones. We are at the lower edge of a very large bull flag that has been in place since the beginning of 2024. Horizontal support at $385 is also supportive. We have 3 large daily gaps in the chart above us and a bullish wedge within the flag. This is a good place to start buying for a possible bounce towards $465.
However, one must bear in mind that the overall market remains bearish. Purchases should therefore be closely hedged and not be too large. However, it would be wrong not to use this opportunity to enter the market.
Target Zones
$465.00
Support Zones
$385.00
$360.00

ADBE Bearish Price Target - $380ADBE has broken below the 200W and 50M EMAs. Further downside can be expected at this point with a potential bottom being at the 0.618 fib level, which is also around the 100M EMA.
A short entry would present itself should price recover to fill the gap around $493-$517
PT: $370-$380
Should price not reach the target, a bottom can be confirmed if the 5D, 10D, and 20D EMAs flip bullish

Adobe Wave Analysis – 13 March 2025
- Adobe broke round support level 400.00
- Likely to fall to support level 360.00
Adobe recently broke with the sharp downward gap the round support level 400.00, which stopped wave 5 of the previous impulse wave (1) at the start of January.
The breakout of the support level 400.00 accelerated the active impulse wave 3 of the sharp downward impulse wave (3) from the middle of February.
Given the clear daily downtrend, Adobe can be expected to fall to the next support level 360.00 – which is the target price for the completion of the active impulse wave 3.

Stock Of The Day / 03.13.25 / ADBE03.13.2025 / NASDAQ:ADBE #ADBE
Fundamentals. Positive earnings report, but forecasts are slightly lower than expected.
Technical analysis.
Daily chart: Downtrend. Yearly minimum is ahead.
Premarket: Gap Down on increased volume.
Trading session: The pullback after the initial impulse from the opening was stopped at 393.80. The next few attempts to return and hold above 393.80 were also unsuccessful. At the same time, the price formed a tightening to the level from below. We are considering a short trade to continue the downward movement.
Trading scenario: Pullback along the trend (false tightening) to level 393.80
Entry: 391.17 when the structure of the tightening to the level is broken
Stop: 394.81 we hide it above the candlestick of the last pullback
Exit: We observe a pullback-free movement without a clear trend structure after entering the trade. It is optimal to fix such movements in parts upon reaching certain Risk/Rewards targets (1/3, 1/4, etc.) with subsequent stop tightening.
Risk Rewards: 1/3
P.S. In order to understand the idea of the Stock Of The Day analysis, please read the following information .

Breaking: Adobe Inc. (ADBE) Down 10% Amidst Disappointed OutlookAdobe Inc. shares (NASDAQ: NASDAQ:ADBE ) tanked 9% in Thursday premarket trading amidst a disappointed outlook as shares faces downgrade.
Adobe (ADBE) reported record quarterly revenue above analysts’ expectations, though its outlook disappointed. The Creative Cloud developer’s revenue climbed 10% year-over-year to a record $5.71 billion, above the analyst consensus from Visible Alpha. Adjusted earnings of $2.22 billion, or $5.08 per share, rose from $2.05 billion, or $4.48 per share, a year earlier and topped estimates.
Adobe’s Digital Media arm, which includes Creative Cloud subscriptions, saw revenue of $4.23 billion, up 11% year-over-year and exceeding analysts' projections.
CEO Shantanu Narayen said Adobe is "well-positioned to capitalize on the acceleration of the creative economy driven by AI." The results come ahead of the company's Adobe Summit event next week, with analysts saying they'll be watching for updates on generative AI metrics.
Looking ahead, Adobe maintained its full-year revenue outlook of $23.3 billion to $23.55 billion, and adjusted earnings per share of $20.20 to $20.50, both below analyst consensus projections at the midpoint.
Technical Outlook
as of the time of writing, shares of Adobe Inc. (NASDAQ: NASDAQ:ADBE ) are down 10.67% trading within oversold levels with the RSI at 26. This disappointed outlook led to a gap down pattern on the chart which is a very strong bearish pattern, however, it gets filled up overtime. NASDAQ:ADBE has already broken the 1-month low base and approached the support point a break below that level could be canning for ADBE shares.

Higher Highs, Higher Lows on Adobe. ADBEAnd on top of that a few more technical signals acting in unison to suggest a bullish picture. Simultaneous or near simultaneous crosses on VZO, Stoch/RSI. There is a cross of zero line BB%PT. Last candle crossed vWAP and sits on both vWAP and VZO. Fibonacci clusters offer some static profit goals. In practice these are never used and I just throw them in there to keep track of how my ideas go in terms of reaching goals.

LONG ADBETight Stop, Chart play, and they are doing well adopting AI
IHS, entered now on the retest, tight stop below

Bear Flag in Adobe?Adobe trended lower most of 2024, and now some traders may expect another push to the downside.
The first pattern on today’s chart is the series of higher lows since mid-January. The software company recently slid below that line, which may be viewed as a bear flag breakdown.
Second, bearish gaps after the last two earnings reports could reflect weak sentiment.
Third, ADBE has been unable to get above its falling 50-day simple moving average (SMA). That may indicate a negative intermediate-term trend.
Also notice how the 50-day SMA is under the 100-day SMA and both are below the 200-day SMA. That configuration, with faster SMAs below slower ones, may indicate a negative long-term trend.
Next, the 8-day exponential moving average (EMA) just crossed below the 21-day EMA. MACD is falling as well. Those patterns may be consistent with bearishness in the short term.
TradeStation has, for decades, advanced the trading industry, providing access to stocks, options and futures. If you're born to trade, we could be for you. See our Overview for more.
Past performance, whether actual or indicated by historical tests of strategies, is no guarantee of future performance or success. There is a possibility that you may sustain a loss equal to or greater than your entire investment regardless of which asset class you trade (equities, options or futures); therefore, you should not invest or risk money that you cannot afford to lose. Online trading is not suitable for all investors. View the document titled Characteristics and Risks of Standardized Options at www.TradeStation.com . Before trading any asset class, customers must read the relevant risk disclosure statements on www.TradeStation.com . System access and trade placement and execution may be delayed or fail due to market volatility and volume, quote delays, system and software errors, Internet traffic, outages and other factors.
Securities and futures trading is offered to self-directed customers by TradeStation Securities, Inc., a broker-dealer registered with the Securities and Exchange Commission and a futures commission merchant licensed with the Commodity Futures Trading Commission). TradeStation Securities is a member of the Financial Industry Regulatory Authority, the National Futures Association, and a number of exchanges.
TradeStation Securities, Inc. and TradeStation Technologies, Inc. are each wholly owned subsidiaries of TradeStation Group, Inc., both operating, and providing products and services, under the TradeStation brand and trademark. When applying for, or purchasing, accounts, subscriptions, products and services, it is important that you know which company you will be dealing with. Visit www.TradeStation.com for further important information explaining what this means.

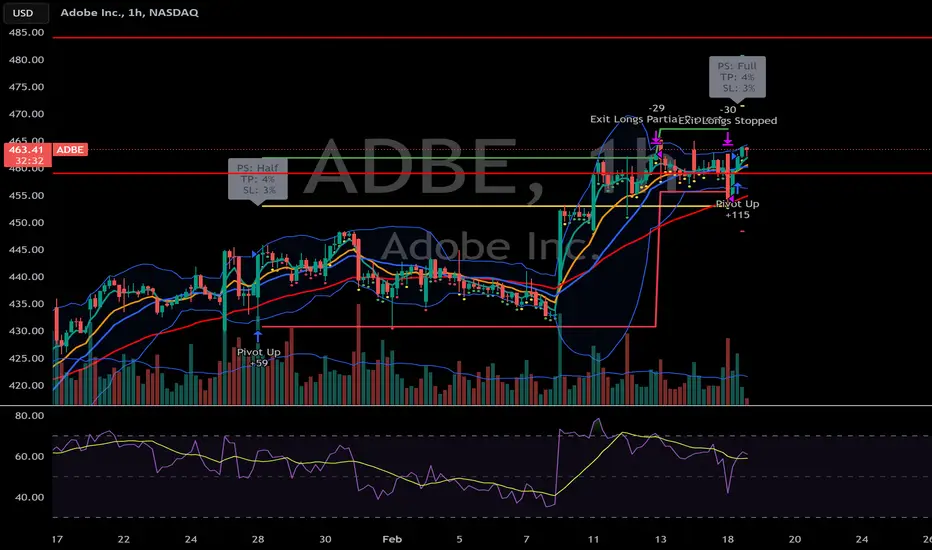
Going Long with ADBE!ADBE after hitting take-profit, sold off during first hour of day and got stopped, only to reverse. Typically when trades start to win, they continue doing so, which is why I went long when the signal fired earlier.
The King Trading Momentum Strategy combines the 5 EMA crossing above the 13 EMA, RSI strength, favorable momentum as measured by ADX plus evaluating recent volume changes and even something that measures breakout momentum called Beta for this one! ARKK and over 100 equities are built into this script with optimal backtest take profits and stop losses and can be toggled on by simply checking a box (default they are turned off).
Adobe AB=CD or ABC Pattern & IHSDaily Technicals:
AB=CD or ABC pattern with an Inverted Head and Shoulder Pattern at the end n@ weekly support (yellow area):
Daily Chart:
Weekly Chart:

Breakout for Adobe. ADBEA very favorable picture for long takers. MIDAS break, confluent vWAP, US lines, crosses for VZO and Stoch lines. Plus, importantly there is a break in a minor resistance at 18.05 (blue dotted line), leaving potentially much more room to move up.

Bullish behaviour on ADBE stockIt looks like, after half a year of retracement, Adobe Inc. stock (Ticker NASDAQ: ADBE) is now setting up for longs again.
On the gap-down daily bar following the December 11th 2024 earnings report, professionals bought. Then, over December and January 2025, more buying can be seen. It has to be noted that recent professional activity took place around the previous level of support ($433.97) which adds to the strength. By January 10th supply has been absorbed, in February the price pushed above the support level and has been tested with relatively low volume creating conditions for the move up.
Today's bar is a positive reaction to the recent testing and might be the beginning of the rally towards $566.79 - $576.30 with minor resistances around $482.66 - $489.52 and $541.74 on the way.
At the same time, as we've seen a high volume around the support level (January 27th, 28th and 31st bars), there is still the possibility of its re-testing and the beginning of the rally from there.

ADBE: A Top Buy for 2025**ADBE: A Top Buy for 2025** 🚀📈
ADBE is setting up for a strong year ahead. Solid fundamentals, technicals aligning, and market conditions could drive a major move. This could be one of the best opportunities of 2025—watching key levels closely!
#ADBE #Investing #Trading #StockMarket

Longggg Term Best Buy #adobeMay be not towards the end of 2025, but for more long term
Fundamental Reasons:
A diversified Tech Business which operates as a technology company worldwide. It operates through three segments: Digital Media, Digital Experience, and Publishing and Advertising.
Its CEO, Shantanu has been recognized by several publications as one of the world’s leading executives, including Barron’s World’s Best CEOs and Fortune Businessperson of the Year lists, and named a Top CEO by Glassdoor based on employee feedback. He is a recipient of India’s civilian honor Padma Shri and the Economic Times Global Indian of the Year award.
10 years revenue CAGR is 6.5 %
The largest Market Cap in its Sector > 192 B USD
Technical Reason:
On Monthly chart it took 4 years to make a Head & Shoulder pattern.
The best monthly closing on 31st Jan 2025 , the doji which is signalling for long term bullish reversal at the end of its right shoulder on montly chart.
This week it enters into its strong resistance Level above 440 - 446
Come to Daily chart, a bullish Harami formed on 29th January .
If this level remains till tomorrow, 31st Jan 2025 , then we have a strong bullish reversal.
1st Long Term Target 700
2nd Long Term Target 800
Best Of luck to me you all!!!

LONG ADBEUltra Long
Beautiful Inverse head and shoulders, easy R/R!
Great product, best ai in the space for this and it has the institutional support!
