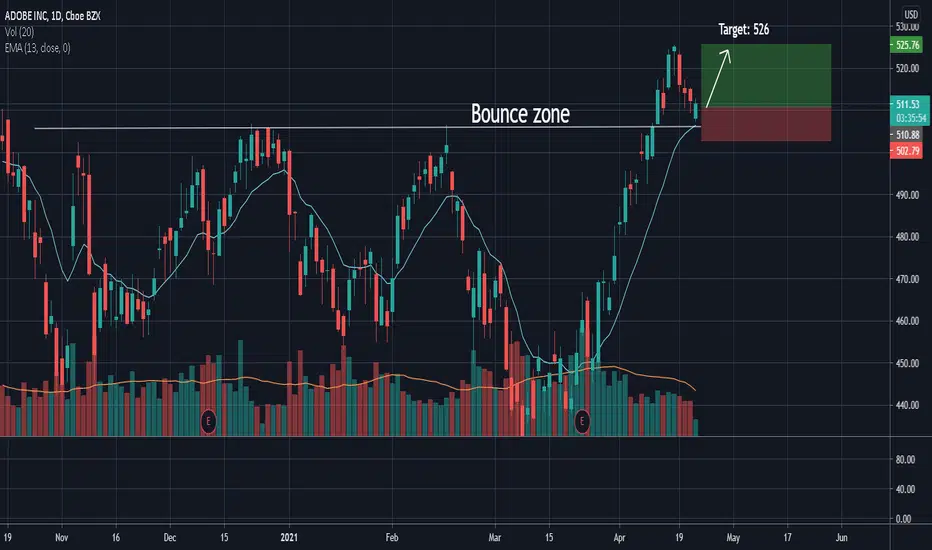
Adobe (ADBE) Likely To Rally And Test All Time HighsThe weekly time frame shows a clear bounce off of previous trendline resistance-turned-support. A test of $525 is likely.
ADB trade ideas


Indecision in Adobe priceNASDAQ:ADBE
Multiple contrasting EMAs crosses suggest indecision and uncertainty in this market. Mixed.
Price is struggling to break through the highs but is finding buyer support at the lows of the current consolidation/range. Mixed.
RSI unclear. Mixed.
A safer approach to join the uptrend is to wait for an entry at 375.

You can use Adobe to make $DOGE memes.If a car is a meme, and the gas is $DOGE, then the highway is Adobe.
Create memes of meme coins, but first, load up on some $ADBE. You should invest in the tools you use.
The bars pattern here is from $FTNT... they're all in the same tech basket. $FTNT is leading, $ADBE $CRM and others are following.

ADOBE waiting to be unleashed!Adobe has been trading sideways for almost 9 months now, bouncing off the Strong Support level and not breaking out of the Strong Resistance level for long.
It could possibly dip to the $455 Strong Support line again and bounce up and out of the resistance around the time of next earnings report. I am taking my position now because I think this could shoot up at any moment. Will buy any dips along the way.
Could see all time highs, I might take SOME profits around $520.
Current RSI: 40
Average Price Target (Analysts): $570
Current PE Ratio: 41.5
Net Profit Margins: INSANE 40%
Total Assets: $24.9 Billion
Total Debt: $4.7 Billion
This is not financial advice, just my own personal investment plan.


$ADBE bullish flag patternADBE has been treating us with a nice bullish flag above the ascending channel that has been going on since 2018. Last month the flag was broken upward, signaling a continous uptrend if fundementals allow for it.
Before adobe is ready to conquer new ground, it is looking for support. Without it, it has bounced back into the channel from a small resistance around 520.
Places where support can be found: Weak support at 473, strong Support at 458. I believe it will not fall below 458, if it does we will go back into the channel and fall further down.
Facing resistance around 536 (previous ATH) and 613 (fib),
BUT if ADBE is able to break them, we could well be able to see a continuation of the strong uptrend before the flag and reach for a target around 667.

Adobe channel BreakoutLooking at 587 to 595 as the target!
My previous channels weren't correct, but seems like we have a proper breakout.

$ADBE 8 Month Consolidation Break-Out Watch ListWhile the swings have been large (high volatility) $ADBE has been consolidating for just over 8 months. Adobe reported earnings on March 23 and beat expectations. As you know, it's been a tough market. However, if/when the market firms up $ADBE could very well be a runner. I have an alert set on the short downtrend line. If it can break that with some volume, I'll be looking to open a position. ALL TBD. Ideas not investing / trading advice.
From earningswhispers.com:
Adobe Systems Beats
Adobe Systems (ADBE) reported 1st Quarter February 2021 earnings of $3.12 per share on revenue of $3.9 billion. The consensus earnings estimate was $2.79 per share on revenue of $3.8 billion. The Earnings Whisper number was $2.85 per share. Revenue grew 26.3% on a year-over-year basis.
The company said it expects second quarter non-GAAP earnings of approximately $2.81 per share on revenue of approximately $3.72 billion. The current consensus earnings estimate is $2.70 per share on revenue of $3.70 billion for the quarter ending May 31, 2021. The company also said it now expects fiscal 2021 earnings of approximately $11.85 per share on revenue of approximately $15.45 billion. The company's previous guidance was earnings of approximately $11.20 per share on revenue of approximately $15.15 billion and the current consensus earnings estimate is $11.26 per share on revenue of $15.20 billion for the year ending November 30, 2021.
Adobe Systems Inc offers a line of software and services used by creative professionals, marketers, developers, enterprises and consumers for creating, managing, delivering, measuring, optimizing and engaging with compelling operating systems.


ADBE Long William Alligator : the stock is currently in a bullish position because the candlesticks start being above the Teeth, Lips and Jaw and the lines are “eating with an open mouth” this indicates that the price is increasing.
RSI : the line is under 70, so the stock is not overbought.
Candlestick patterns : there is a bearish engulfing which is a bearish confirmation.
Overall : it can be interesting to take a buy position on this stock because the indicators indicate that the price is increasing. Entry price is higher than the current price for assurance and stop loss is set at -5%.

LONG Breakout ADOBE After Q1 after consolidationWhen discarding covid19 effect, only once since September 2012 has SMA200 been above SMA50.
Right now there is a balancing act going on.
Yet over this week the price has broken out from the previous 3 tops and had strong support in 420-430 after Q1 postings.
Since then there has been a strong RSI14 development and is showing a strong yet not "overbought" tendency.
I have entered long in 515.23 today, as the spike in price over the last 3 days will ensure that SMA50 will stay above SMA200.


ADBE - Started to reverse ... unless 420 is brokenADBE - Made a WXY correction after all it seems... it looks like it's over now so I'm looking to buy.
As price is at the brown VWAP from the high, we could see a bit of pullback but it needs to hold above 437 if it is to continue higher or else we could see price go a bit lower short term.

ADBE Pop UpADBE ran down to the 507 support line, and popped up from there. Looking for a quick retest of the previous 525 high. A crack beneath 502 would trigger an exit.
ADBE - Essential TechNot investment advice. ADBE provides essential tech for all businesses. Strong track record of growth, and good overall company.
Its my view that large cap growth (us tech) can continue to climb higher, generally. However, there will be a focus for investors on high quality earnings which ADBE provides.
This is a longer term trade where you should feel comfortable averaging down over time if there is a less than desirable entry.

Adobe: Weekly Bull BreakAs I already analyzed in the video on Monday (see attached), Adobe just broke the prolonged Weekly Bull Flag since basically August 2020. We broke & closed above the resistance yesterday on the Daily. If the bulls don't fake out & see follow through this week, Adobe can now easily go towards $600 in the coming weeks & months.
Some fundamentals : Adobe has seen quite some upside since they changed from the one-off to the monthly subscription models, since a lot more professionals could now afford it. This obviously got a lot more usage throughout the Covid period, as people were working from the home office.
Given that it still underperformed the S&P500 and went on a sideways consolidation after it rose 90% until the summer, which we have to recognize.
I'm a Photoshop & Premiere Pro user myself, and can see the value of the neat integration in the cloud.
After all: If you're not gonna own the companies you're using yourself, then what? ;)
In this case the fundamentals are now getting confirmed by the technicals.
Happy trading & investing!

ADOBE possible FLAG formation !The technology sector is preparing to make a new high.
Many stocks are after a consolidation period since September.
We can clearly see that ADBE testing its highest high , so watch it.
As always, diversify.
If the flag pattern will follow through a big move is about to happen, one that worth risking on a trade.
Previous pulse waves were relatively smooth.
Side note: if you are familiar with Wyckoff theory, SPRING just happened in March... which is also a possible positive sign for a shoot up :)

ADBE Bullish Flag continuation pattern ADBE is flagging after its huge run off lows last year. All moving averages are curling up and If we can clear this 505 level of resistance then a new ATH should follow.


I like the companyComing off a run with a reversal pin bar to touch that support and confirm the break, consolidate and then continue
Looks good at 495

ADBE near the resistance level of the Wyckoff PatternFor new entries: $ADBE (Adobe Systems Inc) is near the resistance level of the Wyckoff pattern. Look for a breakout with volume to confirm the breakout.
For ones holding a position and want to secure the profit of last rally, you can close the position and reopen with the pattern confirmation.

Massive Structure on ADBEToday we will take a look at the current situation on ADBE.
Key concepts:
a) Flag Pattern: This type of formation is considered a continuation pattern, meaning that after the breakout, we tend to observe a movement in the same direction as the previous impulse
b)Ascending Structure: using two trendlines, we can understand the upper and lower bands of any trend; when we have a breakout on any of the directions, we can use that to forecast possible movements on the breakout direction
c)Fibo Extensions: We use them to forecast possible targets on a new impulse
Final Conclusion: We have an activation level on the green line and an invalidation level on the red line; the final target is the 2nd fibo extension, and we will use the first one as a risk-free level.
Thanks for reading!
