ADM's Financial Woes UnearthedArcher Daniels Midland ( NYSE:ADM ) Faces Investor Skepticism and Downgraded Ratings Following Accounting Investigation"
In a shocking turn of events, Archer Daniels Midland ( NYSE:ADM ), one of the major players in the international grain trading and processing industry, has placed its Chief Financial Officer (CFO), Vikram Luthar, on administrative leave amid an investigation into accounting practices within its nutrition business. The move has sent ripples through the financial world, causing a double-digit drop in NYSE:ADM 's shares and prompting a delay in the release of its fourth-quarter earnings.
The investigation was initiated following a request for documents from the U.S. Securities and Exchange Commission (SEC), raising concerns about the company's financial governance and prompting immediate action from NYSE:ADM 's board. Luthar, who assumed the role of CFO in 2022, has been replaced on an interim basis by Ismael Roig.
NYSE:ADM , which competes with industry giants like Bunge and Louis Dreyfus, saw its shares plummet more than 10% in pre-market trading, reflecting investor unease about the potential impact on the company's financial health and growth prospects. Goldman Sachs promptly downgraded the stock to "neutral" from "buy," citing uncertainties surrounding the investigation and its potential consequences.
The nutrition business, where the accounting irregularities are under scrutiny, has been a significant focus for NYSE:ADM in recent years. With multi-billion-dollar investments in European ingredients manufacturer Wild Flavors and French animal feed maker Neovia, NYSE:ADM sought to capitalize on the growing demand for nutritional products. However, recent struggles in the nutrition business, particularly in the face of waning interest in plant-based proteins, have added to the company's challenges.
Conclusion
As NYSE:ADM navigates this turbulent period, industry experts and investors are closely monitoring developments. The delay in the release of fourth-quarter earnings adds to the uncertainty, leaving stakeholders with more questions than answers. The board's commitment to working closely with advisors to align processes with financial governance best practices is an assurance, but the road ahead remains uncertain for NYSE:ADM as it works to rebuild investor trust and weather the storm of financial scrutiny.
ADM trade ideas

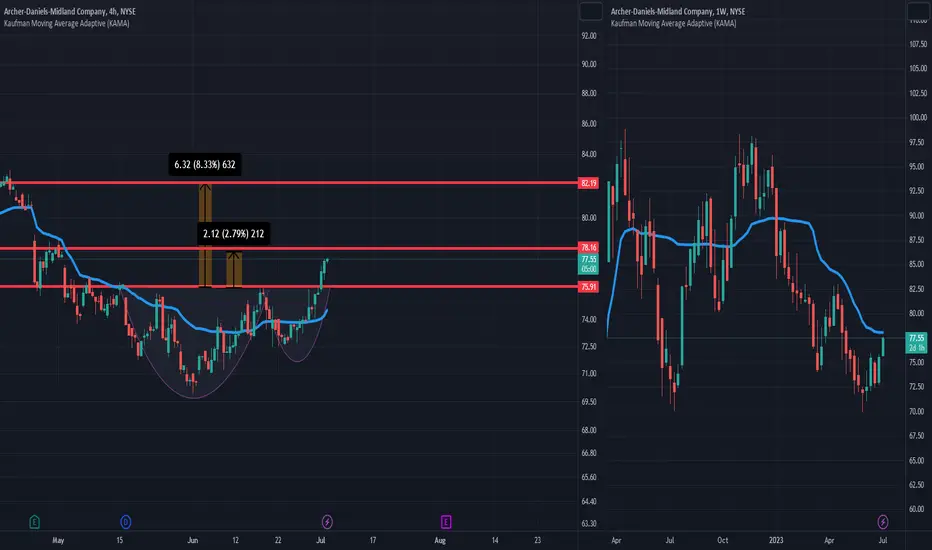
ADM // cup handle formationAlthough there is a cup-handle formation on the chart, the targets are drawn according to Fibonacci. Pay attention to the wedge resistance in the weekly time frame.
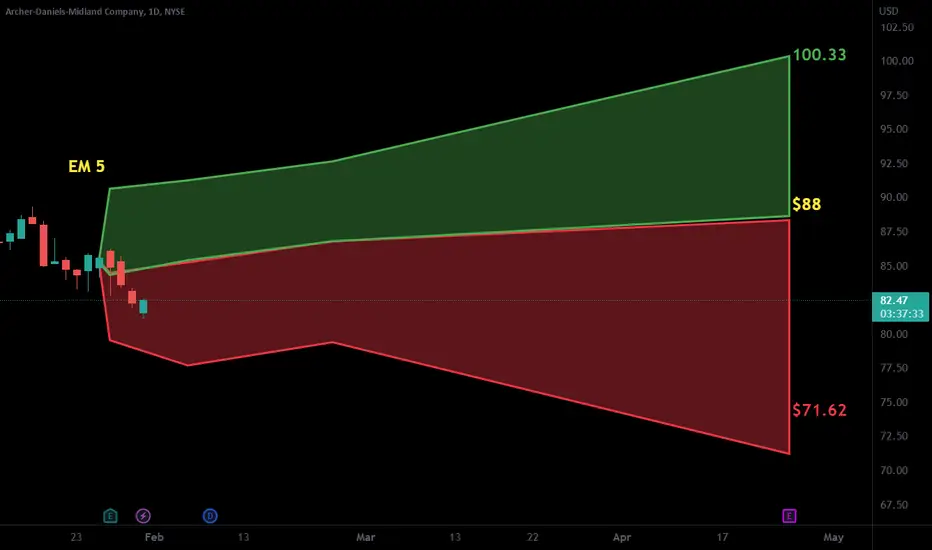
ADM: Piercing Line with Bullish Divergence at Deep Cypher PCZWe have a Piercing Line with Bullish Divergence on the 3 Day near the 200 SMA at the PCZ of a Bullish Deep Cypher that if plays out could take it up to the level of $97 but if we're being realistic probably at least $100.

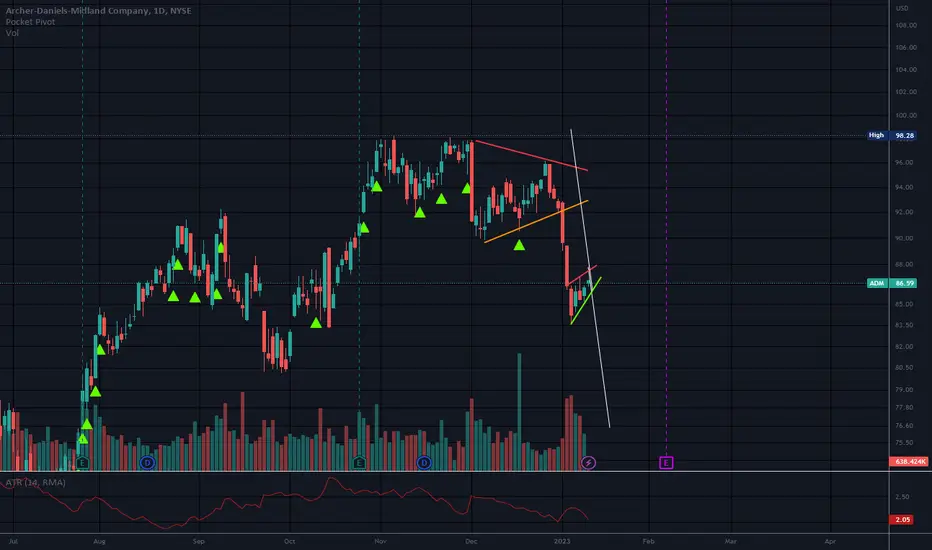
ADM - Similar Double TopsTrend Line up in white shows that the bearish top is in.
The double top will act as the first one did, pushing price down to the up trend line.
The bars pattern tool shows my thoughts for price following this double top.

ADM - Strong Downtrend A strong downtrend is evident on ADM on this hourly chart
I think price will be rejected and continue along this trend line that can be drawn with a low at 68

The company is setting up for a correctionHello,
Archer-Daniels-Midland Co. engages in the production of oilseeds, corn, wheat, cocoa, and other agricultural commodities. It operates through the following segments: Ag Services and Oilseeds, Carbohydrate Solutions, Nutrition, and Other.
The company has indicated that in March will permanently close its flour mill in New Braunfels, Texas, following a review of its milling business.
The company stock shows we expect a consolidation of the price around the current area for the next few years. This are areas where we can actively seek buying opportunities from the bottom.
More details about the company on their website.
Good luck!

$ADM with a Bullish outlook following its earnings #Stocks The PEAD projected a Bullish outlook for $ADM after a POsitive over reaction following its earnings release placing the stock in drift B with an expected accuracy of 90%.
PennantThe pole is Down.
Pennants and Flags are neutral until broken with a trend in that direction.
No recommendation.
Double Top, Daily Chart, Short Idea I can't help but clearly see the large double top formation, and when this happens my gut tells me not to ignore it since they tend to have a very high rate of success playing out correctly, double tops (M) and double bottoms (W). Double Tops = downtrend upcoming and Double Bottom = uptrend upcoming
It looks as if shorting to the target of $41 would be a good idea. Getting put options. Let me know what you think.

🟩 $ADM - Buying todayI like $ADM
It is in Stage 2 Uptrend.
A low cheat setup.
It has great fundamentals.
Volume is very quiet/

ADM StrategyClear signs of a inverse head and shoulders pattern. Low angle neckline feature, signals a weaker bullish trend. Additional patterns of 2 bars of indecision putting a halt on the previous bullish push, followed by a "Dark Cloud Cover" candlestick pattern. if ADM closes in red for the following day, we would expect a bearish trend to support. On either event, good gains could be made for a long or short position.

ADM - sell?Two last moves in three waves both, likely a flat - will get a sharp decline to test the last low.
Trade safe

ADM Long Term Bullish Potential TopMirror projection on monthly chart. "Mid"-point = 69. Lowest range = Black Monday. Level 69 significance could also be identified by fibonacci extension: low of 2000 to 2008 peak.
Related market: BG

$ADM with a Bullish outlook following its earnings #Stocks The PEAD projected a Bullish outlook for $ADM after a Positive Under reaction following its earnings release placing the stock in drift A with an expected accuracy of 40%.

ADM Equality Mirror TargetProjection based on Fibonacci analysis. This chart shows equality relationship. 84 is likely a key level because of gaps. You could try the 2020 pivot low for the lower box and you will find a confluence with 38% subdivision.
This suggests a continued rise in wheat price and other ag.

Archer Daniels Could Be Fighting HigherThe S&P 500 and Nasdaq-100 have made new multiyear lows this week. That helps draw attention to the price action in today’s stock, which has been fighting higher all year: Archer Daniels Midland.
The grain processor bottomed in mid-July, followed by a higher low in late September. It also managed to hold its 200-day simple moving average (SMA). (Did you know only 15 percent of the S&P 500’s members were above their 200-day SMAs yesterday, according to TradeStation data?)
It then jumped to begin October and managed to hold the higher level despite the broader market rolling over. That is a potential sign of relative strength.
The current price zone also establishes ADM back above it 50-day SMA, which could suggest the bulls are taking charge.
Finally, this chart includes our 2 MA Ratio custom script. It has the default settings of the 8- and 21-day exponential moving averages (EMAs). Notice how the indicator just turned green, signifying the faster EMA has crossed above the slower EMA.
TradeStation has, for decades, advanced the trading industry, providing access to stocks, options, futures and cryptocurrencies. See our Overview for more.
Important Information
TradeStation Securities, Inc., TradeStation Crypto, Inc., and TradeStation Technologies, Inc. are each wholly owned subsidiaries of TradeStation Group, Inc., all operating, and providing products and services, under the TradeStation brand and trademark. You Can Trade, Inc. is also a wholly owned subsidiary of TradeStation Group, Inc., operating under its own brand and trademarks. TradeStation Crypto, Inc. offers to self-directed investors and traders cryptocurrency brokerage services. It is neither licensed with the SEC or the CFTC nor is it a Member of NFA. When applying for, or purchasing, accounts, subscriptions, products, and services, it is important that you know which company you will be dealing with. Please click here for further important information explaining what this means.
This content is for informational and educational purposes only. This is not a recommendation regarding any investment or investment strategy. Any opinions expressed herein are those of the author and do not represent the views or opinions of TradeStation or any of its affiliates.
Investing involves risks. Past performance, whether actual or indicated by historical tests of strategies, is no guarantee of future performance or success. There is a possibility that you may sustain a loss equal to or greater than your entire investment regardless of which asset class you trade (equities, options, futures, or digital assets); therefore, you should not invest or risk money that you cannot afford to lose. Before trading any asset class, first read the relevant risk disclosure statements on the Important Documents page, found here: www.tradestation.com .

ADM: upside momentum to remain?A price action above 84.00 supports a bullish trend direction.
Crossing below this level will negate the bullish trend.
Consolidation price range from 86.00 to 88.00.
Crossing above 88.00 might assist the bullish trend to target 92.00.
Crossing below 86.00 will be the first sign of pending weakness.
Remains above its 200-day simple moving average.

Can $ADM hold support and move higher from here?Notes:
* Very strong up trend on all time frames
* Good earnings in the recent quarters
* Basing for the past ~6 months
* Coming up on the right side of its base
* Recently broke back above a key level around ~$87.2 and has been holding this level as support with higher than average volume
* Printed an inside day with higher than average volume
* Bouncing off of its 20EMA
Technicals:
Sector: Consumer Defensive - Farm Products
Relative Strength vs. Sector: 2.78
Relative Strength vs. SP500: 1.55
U/D Ratio: 1.81
Base Depth: 37.27%
Distance from breakout buy point: -10.61%
Volume 22.31% above its 15 day avg.
Trade Idea:
* You can enter now as the price is bouncing off of its 20EMA and a key support level around $87.2
* If you want a better entry you can look to enter around $87.2 or if it pulls back closer to the 20EMA
* This stock usually has local tops when the price closes around 12.92% above its 50 EMA
* Consider selling into strength if the price closes 12.72% to 13.12% (or higher) above its 50 EMA
* The last closing price is 4.89% away from its 50 EMA

Looking For correctionHello
We are at the top for this company stock. Looking for a correction to start coming in.
More details about the company can be found on the investor relations of the company website.
Good luck.

ADM and WTZ2+AO in the ZoneADM is likely WTZ2 pattern perfectly while AO in the Zone signal is applied for competitive entry. I expect a few TP, the 1st one is at the end of B and the previous high could be the 2nd. However, the entry size is as significant as the entry price. Calculate your risks well before trading. Good Luck!

ADM and WTZ2 in DowntrendADM is likely moving in downtrend. I apply my favorite setup (WTZ2) for entering the order. For the trade setup, risks reward ratio is also competitive for me. Enjoy your trading!

ADM - Complete Ascending ScallopA complete chart pattern formation
Following the completion of this a large bullish rise is to be expected
Which is already being seen on this log chart

ADM High-risk Initial LongADM High-risk Initial Long. SL and TP on the chart. 10-20x leverage. Move SL on TP.
