ADM break out this weekThis chart looks ready to move. Give it a day or two consolidation looks really great. Follow me for more breakouts. investoratlas.org for our newsletter.
ADM trade ideas

ADM - Elliottwave analysis 5th wave up after triangle break outADM - It is in strong up trend and impulse cycle from the major low on 4 hr time frame. The price just broken up the triangle 4th wave and moving higher in 5th wave up. So stay bullish with invalidation level below 49.30 for the target above 55.80. The trade is having high RR ratio with good entry. If price drops below 49.30 then it will extend the y of 4th wave down in wxy correction down and might go down below 45.50 or lower level.
Give thumbs up if you really like the trade idea.


ADM Bullish SwingADM shows promising upward movement, with a bounce off support - and MacD soon to cross.
ADM is a consistently profitable food processing company, and part of the S&P 500.

ADMTook the breakout this morning and paying for it by going outside my process. Stopping out this loser.


ADM : Is ADM gaining the power to move up again ?Is ADM gaining the power to move up again ?
TP = 46.53
Please don't forget to FOLLOW , LIKE and COMMENT ...
If you like my analysis:)
Thank you and Good Luck!


ADM - Tested top twice, a possibility of a breakthroughADM has tested the 44.99 mark two times and fell back. It is trading in a triangle formation. This is a set up I love for long options trades.
The price is supported by the following:
1) The moving average
2) RSI is in the 60% area. I am okay with it as long as it stays over 50%. I would start to worry if I was in the trade and it drops.
3) The MACD shows stability. Still some buying power.
It had just now tested the top a 2nd time (to form a double top) I would personally wait to see if it goes back to the support at the bottom of the channel and then reverses for better confirmation and a more favourable options contract.

ARCHER-DANIELS-MIDLAND CO PlanHey my frends, ARCHER-DANIELS-MIDLAND CO is in a bullish configuration, large bullish force less purchase volume. We go in the direction of the last previous higher with the volume, great potential to get the 2nd higher at the limit of the fibonacci, if the buyers push their price with the force in presence.
Please LIKE & FOLLOW, thank you!


NYSE Stock picks (ADM)NYSE:ADM
ADM NYSE
Price has formed a nice inverted head and shoulders and was able to break it retest the neck lined and push higher.
Currently, buyers are looking to breach the 45.00 area which is the bump on the road to the target price of 48.00

Bull flag- Hammer candlestick pattern
- Above the resistance
- Also positive earnings
Looking for longs if this continues

ADM long ideaChart of ADM looks great. Price moving higher above the supporting moving averages. Earnings are already in an positive.

ADM approaching resistance, potential drop! ADM is approaching our first resistance at 147.15 (61.8% fibonacci retracement, 61.8%, 100% fibonacci extension) where a strong drop might occur below this level to our first support at 43.26 1(50% fiboancci retracement).
Stochastic is also approaching resistance.

ADM approaching resistance, potential drop! ADM is also approaching our first resistance where we might see a drop below this level to our first support level. Stochastic is also seeing a drop below this level.

ADM appraoching resistance, potential drop! ADM is approaching our first resistance at 47.15 (horizontal overlap resistance, 61.8% fibonacci extension, 61.8% fibonacci retracement) where a strong drop might occur pushing price down to our first support at 43.26 (horizontal overlap support,50% fibonacci extension).
Stochastic (89,5,3) is also approaching resistance where we might see a corresponding drop below this level.


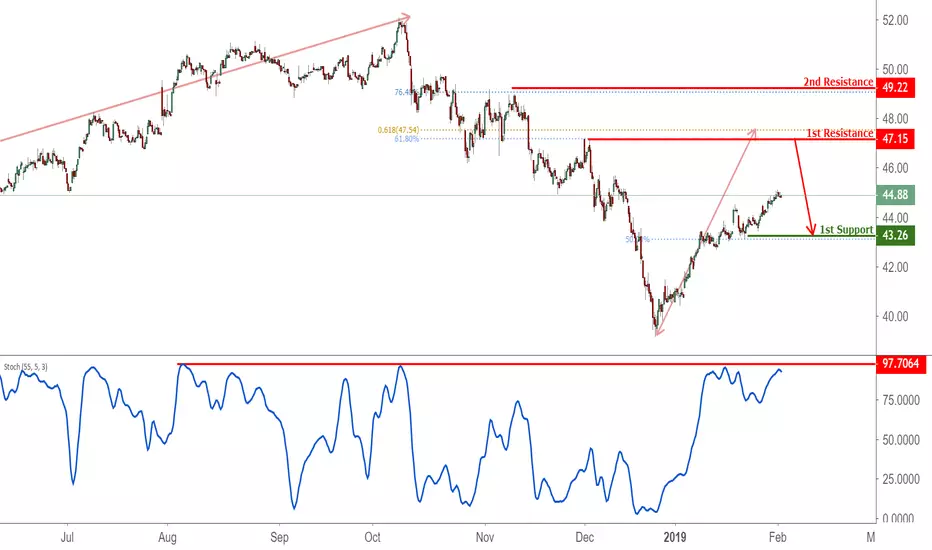
SHORT ADM Approaching Resistance, Potential Drop!ADM is approaching our first resistance at 47.15 (horizontal swing high resistance, 61.8% Fibonacci extension , 61.8% Fibonacci retracement ) where a strong drop might occur below this level pushing price down to our major support at 43.26 (50% Fibonacci retracement ).
Stochastic (55,5,3) is also approaching resistance where we might see a drop below this level.


ADM Approaching Support, Potential Bounce!ADM approaching support at 43.44 (100% Fibonacci extension, 61.8% Fibonacci retracement, horizontal swing low support) where it could potentially rise to its resistance at 46.75 (38.2% Fibonacci retracement, horizontal overlap resistance).
Stochastic (55, 5, 3) is approaching its support at 4.03% where a corresponding bounce could occur.
