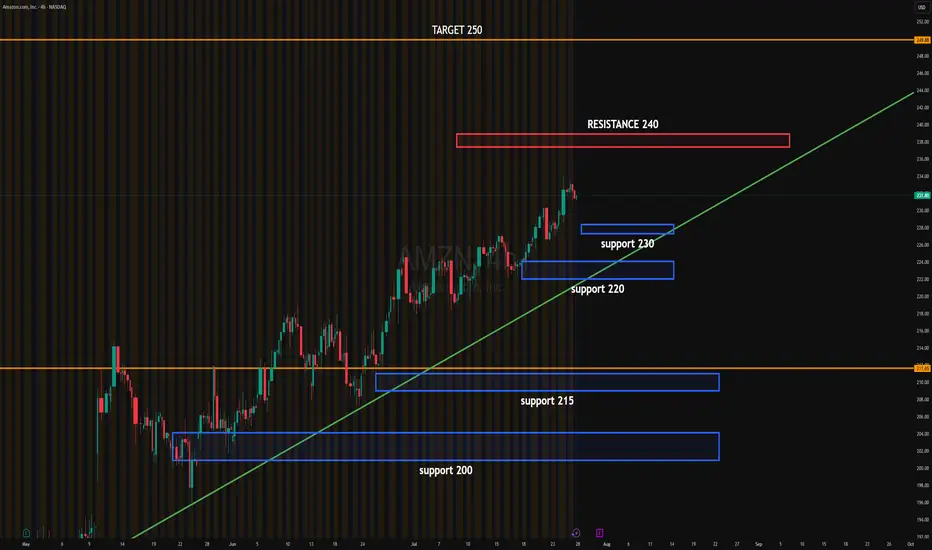
How to navigate the Amazonian Squeeze. AMZNHello I am the Cafe Trader.
This week has been a deep dive on the MAG 7 and today AMZN is up next.
We are going to look at long term and short term opportunities.
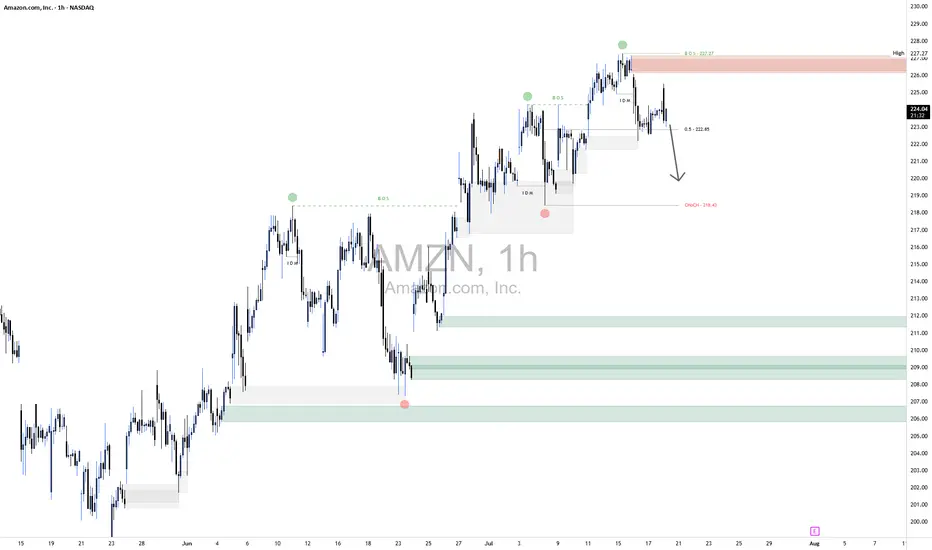
We are near the All Time Highs, with one final Seller to get through before making the break.
Today we tested to see if those sellers are there still (and indeed they are). Today was a key reaction, I'm going to give you the keys to profit.
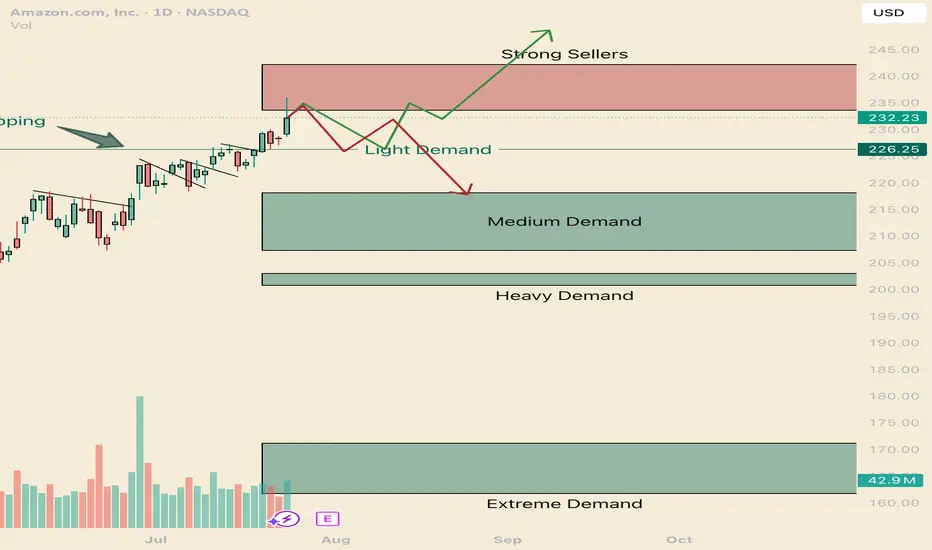
Long Term
It's important to consider how aggressive you would like to be with pricing. This list of prices should align with your conviction with Amazon.
Aggressive: $226 is where the current aggressive players are sitting. They are going to look to buy again at this level, although they should be the weakest of the buyers.
Fair sentiment: 203-210 is where stronger buyers are sitting. I think this price is still realistic to get to.
Conservative: 161 - 171 Is a great price, buyers have shown to buy this with extreme demand. Amazon at this price is a fantastic purchase, if you are holding from here or lower, congradulations.
Short term
Testing the supply and rejecting tells us that sellers are still really active in this zone. We will see how tomorrow closes, if we do not close in the supply zone, there is a good chance that net week will have some bearish winds and a great chance of testing the light demand at 226. this brings us to the two trading ideas.
1 Green line
I think we will test those sellers by next week. and i think its very possible that we break trend and touch the light demand line. If its a slow drag down to the light demand, Shorts will have to cover as soon as any real demand shows up (Light Demand Line).
Entry 226.50
Stop 221.50
Partial TP 233, or you can hold for a test of the highs (242 would suffice)
2 Red Line
If we get a Hot reaction from the supply zone, or if we close below 233.50 tomorrow, Look for a retest and short entry off the supply zone. If the reaction starts to be slow (more than 5 days of red bars) it's likely this will turn into the green scenario.
Entry 233.5
Stop 237
Partial TP 226.5
Full TP 218
That's all for AMZN Follow for more!
Also comment if you would like me to chart a stock you are considering.
@thecafetrader
AMZ trade ideas
Amazon (AMZN) Shares Rise Ahead of Earnings ReportAmazon (AMZN) Shares Rise Ahead of Earnings Report
Today, 31 July, Amazon is set to release its quarterly earnings after the close of the regular trading session. Available data show that Amazon (AMZN) shares are exhibiting bullish momentum, reflecting positive market expectations:
→ In July, AMZN shares have outperformed the S&P 500 index (US SPX 500 mini on FXOpen);
→ Yesterday, following the end of the regular session, AMZN shares surged by approximately 3% in after-hours trading.
The rise in AMZN comes amid strong earnings reports from other tech giants, such as Microsoft (MSFT) and Meta Platforms (META). For example, MSFT shares rose by more than 8% in post-market trading. Their success has likely fuelled optimism that Amazon’s upcoming report will also impress.
All of this has brought noticeable changes to the technical outlook for the AMZN stock price.
Technical Analysis of the Amazon (AMZN) Chart
Following the release of the previous earnings report, price movements have formed an upward channel, as indicated by the Regression Trend tool. However, in recent days, a series of bearish signals emerged:
→ On Thursday, AMZN broke above the $230 level (marked by an upward arrow), but the session closed well below the highs – a sign of selling pressure;
→ Friday and Monday’s sessions produced candles with small bodies, indicating market indecision;
→ On Tuesday, bears took the lead (marked by a downward arrow), with a relatively long candle closing near the session low.
Thus, the chart gave reason to assume that optimistic sentiments were waning. However, today’s session is likely to open near the $237.30 level, effectively negating the bearish interpretation of the previous five candles and shifting momentum back in favour of the bulls.
In this context:
→ Support could be provided by the $230 level as well as the median of the Regression Trend channel;
→ Key resistance could be found at the previous high of $242.23 and the psychological level of $250.
Whether AMZN can surge to a new all-time high will largely depend on the company’s performance in AI – a theme that remains highly relevant in 2025.
This article represents the opinion of the Companies operating under the FXOpen brand only. It is not to be construed as an offer, solicitation, or recommendation with respect to products and services provided by the Companies operating under the FXOpen brand, nor is it to be considered financial advice.
Real Sellers Vs Passive Sellers AMZNHello I am the Cafe Trader.
I was fortunate enough to get an editors pick, and I wanted to expound on how I came to those conclusions.
In this video we talk about passive sellers vs aggressive sellers and how we identify them. Also why it's important to identify these players in the market. This will help give you depth and help you get really good pricing in the markets.
Hope you enjoy the voiceover, Feel free to take a look at the previous article that this was pulled from on my profile.
Please share a boost if you enojoyed, and consider following for more.
Until next time! Happy Trading!!
@thecafetrader

AMZN Earnings Play — July 30 (AMC)
## 🚀 AMZN Earnings Play — July 30 (AMC)
**💵 High Conviction Call Trade | 85% Confidence**
📈 **Amazon (AMZN)** — Cloud + Consumer Power Combo
🧠 Setup driven by earnings momentum, bullish flow, and macro strength.
---
### 🔍 FUNDAMENTALS SNAPSHOT
✅ **Revenue Growth**: +8.6% TTM
✅ **Margins**: Profit 10.1%, Op 11.8%, Gross 49.2%
🎯 **EPS Beat Streak**: 8/8 with avg. surprise of +34.7%
🔮 **Consensus Target**: \$252.03 (+9.4% upside)
📌 AWS + AI + Cost control = 🔥 upside setup
🟢 **Score: 9/10**
---
### 📊 OPTIONS FLOW SIGNAL
💰 **High OI**: \$232.50, \$240, \$247.50 calls
📈 **Call/Put Ratio**: Bullish Skew
🛡️ **Put Hedging** ≠ Bearishness
📉 Expected Move: \~5%
⚖️ **Gamma Bias**: Bullish above \$240
🟢 **Score: 8/10**
---
### 📉 TECHNICAL SETUP
📍 Price: \$231.01
📈 20D MA: \$226.21 (Support)
📉 RSI: 66.71 (momentum building)
🔒 Resistance: \$242.52 (watch for breakout)
🟢 **Score: 8/10**
---
### 🌐 MACRO TAILWINDS
🧠 AI & Cloud Momentum 🚀
💹 Consumer spending rebound
🔧 Regulatory risk mitigated via diversification
🟢 **Score: 8/10**
---
## 🎯 TRADE IDEA
🟩 **AMZN 08/01 \$247.50 Call**
💸 Entry: \$0.86
🎯 Target: \$2.58 (200%)
🛑 Stop: \$0.43 (50% loss)
⏰ Entry: **July 30 — Pre-close**
📏 Max Risk: \$86
💰 Max Reward: \$258
🧠 IV Crush Defense: Exit 2H post-ER
---
## ⚡️ WHY THIS WORKS
✅ 8-straight beat streak
✅ Fundamentals + Technicals = aligned
✅ Flow + Macro confirm direction
📈 Setup = asymmetrical upside
---
🎯 Tag your earnings sniper crew
📈 #AMZN #EarningsTrade #OptionsFlow #AmazonStock #CloudAI #OptionsStrategy #EarningsPlays #TradingView #SwingTrade #CallOptions #VolatilityTrade #EarningsMomentum

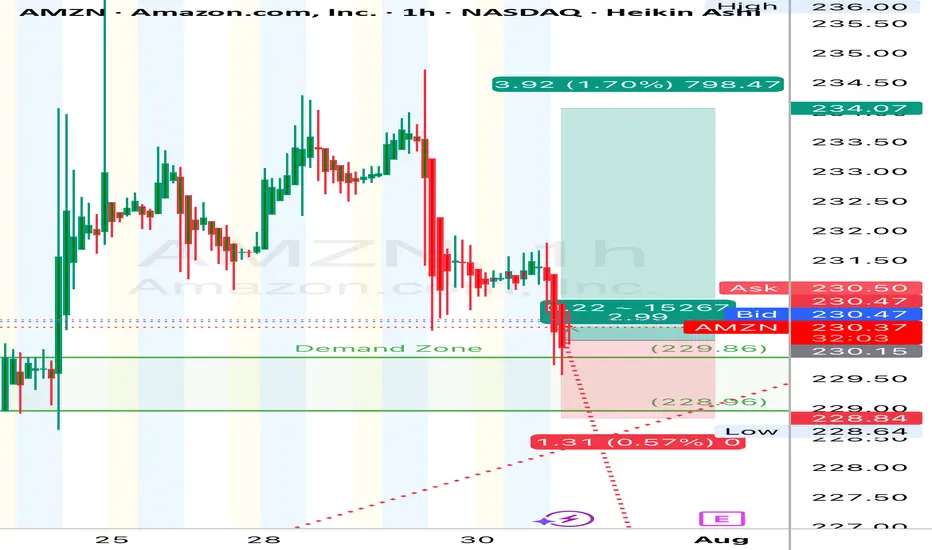
Will $222 Hold or Are We Heading for $215 Flush? July 30AMZN Breakdown in Progress!
🔍 GEX Insights & Options Trading Thoughts (1H Perspective)
Amazon (AMZN) is transitioning from a distribution phase into a potential gamma-driven selloff, and the current GEX setup confirms that bias. The GEX walls are sharply stacked on the downside, while call walls remain heavy above current price—creating strong overhead pressure.
🔸 Gamma Exposure Breakdown:
* Highest Positive GEX (Call Resistance):
* $236 → this is where market makers lean short, and we see strong rejection wicks from this zone.
* 3rd Call Wall: $236
* 2nd Call Wall: $242.5
* GEX Flip Zone / Transition Area: $231–227.5
* Below this = gamma turns negative, increasing downside velocity
* PUT Walls:
* $225 = 3rd PUT Wall (-20.13%)
* $220 = Major PUT Support (-26.16%)
* $215 = 2nd PUT Wall (-22.2%)
The positioning suggests a gamma gravity pull toward $225 → $222, with high risk of flush to $215 if $222 breaks.
🔸 Options Setup Suggestions:
* Bias: Bearish
* Ideal Option Play:
* Aug 2 / Aug 9 $225P or $220P
* Enter on failed retest of $231
* Exit partial at $225, full at $222 or $215
* Avoid chasing puts too late—look for retest rejection near $231–232
If you're conservative, watch for a break and close below $227.5 to confirm further drop before entering.
🧠 1H Intraday Technical Analysis (TA)
Market Structure:
* AMZN broke below the ascending trendline, showing a clean CHoCH (Change of Character) after price rejected $236 twice—clear sign of distribution.
* BOS → CHoCH sequence confirmed, showing the shift from bullish to bearish order flow.
* Price is now trapped below the former support zone ($231.5), which has turned into supply.
Supply & Demand Zones:
* Supply Zone (Resistance): $234.5–236
* Micro Supply (Retest Area): $231.5–232.5
* Demand Zone (Support): $223–222
* Next Key Demand: $215
* If $222 fails, there’s minimal liquidity support until $215
Volume & Confirmation:
* Volume profile shows declining participation on upside pushes, followed by heavy sell volume candles post-CHoCH.
* This supports the idea of institutional distribution above $234.
🧭 Trading Outlook
🔻 Bearish Intraday Play (Favored):
* Entry 1: Retest rejection at $231.5–232
* Entry 2: Breakdown below $227.5
* Target 1: $225
* Target 2: $222.5
* Target 3: $215 (if panic flush triggers)
* Stop Loss: Above $234
🔼 Bullish Reclaim (Less Likely):
* Needs to reclaim $234.5 with strength
* Would target $236, $240
* Not supported by GEX or volume—low probability
🧠 Final Take:
AMZN is now trapped beneath heavy call walls and has shifted structure with a confirmed CHoCH. GEX shows negative gamma territory below $227.5, creating a slippery slope toward $222. The option market is positioning for further downside while intraday structure aligns for a potential flush into lower demand zones. Unless bulls reclaim $234+ with volume, this setup remains bearish biased with favor to PUT side trading.
🛑 This breakdown is for educational purposes only and does not constitute financial advice. Trade at your own risk and always manage your positions carefully.
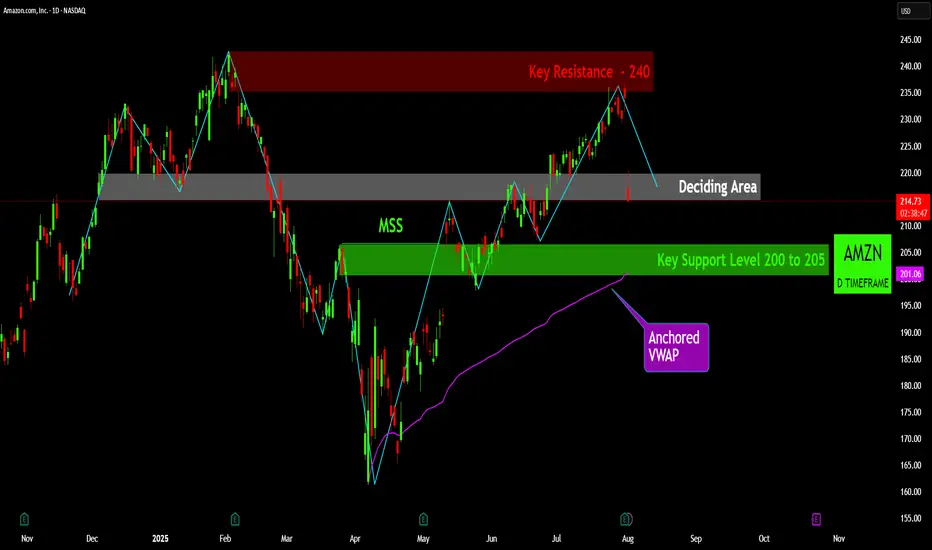
AMZN: The Battle for Direction at a Critical JunctureThe recent price action for Amazon (AMZN) is currently navigating a critical juncture, having pulled back from a significant resistance level and now consolidating within a pivotal "Deciding Area." A detailed review of the key technical levels reveals the following insights:
Key Resistance ($240): A formidable resistance zone is established around the $240 price point. This level represents a major overhead supply area, where prior selling pressure has been strong enough to halt upward price movements on multiple occasions. A decisive breach of this level on strong volume would be a highly bullish development, signaling a potential move to new highs.
Key Support Level ($200 to $205): A robust support zone is identified between $200 and $205. This level has historically served as a strong price floor, absorbing selling pressure and providing a foundation for subsequent rallies. The integrity of the current uptrend is heavily dependent on the price holding above this critical area.
Market Structure Shift (MSS): The formation of a "Market Structure Shift" earlier in the year was a pivotal technical event. This change in market dynamics marked a significant transition, signaling a potential reversal from a prevailing downtrend to the current bullish phase. The subsequent rally from the lows validates this structural change.
Anchored VWAP: The Anchored Volume-Weighted Average Price (VWAP), anchored from the most recent major low, is serving as a dynamic and trend-defining support level. This indicator reflects the average price paid by investors since the start of the current trend. A sustained close below this line would be an early warning sign of weakening momentum.
Deciding Area: The stock is presently trading within a "Deciding Area" situated just below a previous swing high. This zone represents a period of consolidation and indecision as the market digests the recent pullback from resistance. The outcome of this consolidation will likely dictate the short-term directional bias. A break to the upside would suggest a renewed attempt to challenge the $240 resistance, while a breakdown would likely lead to a retest of the primary support level at $200-$205.
Summary of Outlook: The overall technical picture for AMZN indicates that the stock is at a critical inflection point. The health of the underlying uptrend remains intact as long as the price holds above the key support levels and the Anchored VWAP. A definitive move out of the "Deciding Area" will provide the next clear signal for either a renewed push toward resistance or a deeper pullback to test established support.
Disclaimer:
The information provided in this chart is for educational and informational purposes only and should not be considered as investment advice. Trading and investing involve substantial risk and are not suitable for every investor. You should carefully consider your financial situation and consult with a financial advisor before making any investment decisions. The creator of this chart does not guarantee any specific outcome or profit and is not responsible for any losses incurred as a result of using this information. Past performance is not indicative of future results. Use this information at your own risk. This chart has been created for my own improvement in Trading and Investment Analysis. Please do your own analysis before any investments.
Amazon: Extending the Rally...Amazon maintaines its strong upward momentum. As this trend continues, the large blue wave (V) is expected to complete well above the resistance level at $242.52. However, an alternative scenario with a 30% probability remains on the table: in this case, the magenta corrective wave alt.(2) would peak below the $242.52 resistance, and a significant pullback below support at $160.50 would be anticipated afterward. In this scenario, the high of beige wave alt.B would have been set at $242.52, after which the stock would enter the broader downward movement of wave alt.C .
📈 Over 190 precise analyses, clear entry points, and defined Target Zones - that's what we do (for more: look to the right).

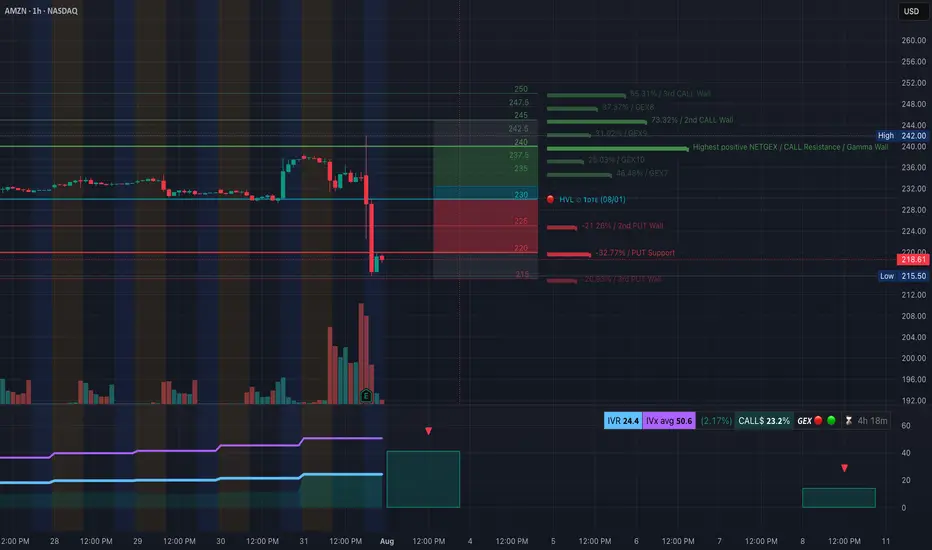
AMZN Earnings Flush — Gamma Flip to the Downside. 8/1AMZN Earnings Flush — Gamma Flip to the Downside, Eyes on $215 Support!
🔍 GEX & Options Flow Insight (1st Image Analysis)
AMZN collapsed post-earnings, breaking through major gamma support levels and flipping into a negative gamma environment. Price is now pressing against a critical $215–218 demand zone, with GEX showing heavy put concentration.
* Call Walls & Resistance:
* 📍 $230.00–$234.00 → Former gamma pivot now acting as strong resistance
* 📍 $237.50 → Prior support zone; now a sell wall
* 📍 $244.00 → Highest Positive NET GEX / Gamma Wall (too far for immediate recovery unless momentum shifts)
* Put Walls & Support Zones:
* 🛡️ $222.18 → 2nd Put Wall resistance-turned-support
* 🚨 $218.00 → Current price — key defense line
* 📉 $215.50 → Hard put wall support — losing this could accelerate selloff toward $210
* Volatility Insight:
* IVR 24.4, IVx Avg 50.6 → Elevated IV post-earnings
* Call flow 23.2% → Bearish options flow bias
* GEX sentiment: 🔴🟡🔴 = Negative gamma = higher volatility risk to downside
✅ Option Trading Suggestion:
Bias: Bearish unless AMZN reclaims $224+
Strategy: Bear put spread
* Entry Idea: Buy 220P / Sell 215P for Aug 2 or Aug 9 expiry
* Invalidation: Strong daily close above $224
* Target: $215 → $210
Why this works: Negative gamma positioning means market makers hedge by selling into weakness, accelerating downside moves. The inability to reclaim $224 confirms the bearish structure.
🧠 Technical Analysis (1H Chart) (2nd Image Analysis)
Market Structure & SMC:
* 🟥 CHoCH confirmed after earnings drop
* ❌ Lost all recent BOS levels in one sharp flush
* Price trapped under former OB resistance at $224–230
Trendline Dynamics:
* Broke out of prior bullish channel to the downside
* New descending channel forming with lower highs
SMC Zones:
* 🟩 Demand Zone: $215.50–$218.00 → Immediate defense
* 🟥 Supply Zone (Purple Box): $224–$230 → Sell wall
🔄 Price Action & Key Levels
* Support:
* ✅ $218.00 → Current defense
* ✅ $215.50 → Last line of gamma support
* 🚨 Below $215.50 → Sell momentum can accelerate to $210
* Resistance:
* 🚩 $224.00 → First reclaim needed for relief rally
* 🚩 $230.00–$234.00 → Heavy resistance
🧭 Scalping / Intraday Trade Setup
🟥 Bearish Setup (Preferred):
* Entry: Failed reclaim of $224
* Target 1: $218.00
* Target 2: $215.50
* Stop: Above $224
🟩 Bullish Reversal Setup:
* Entry: Strong reclaim of $224 with volume
* Target 1: $230.00
* Target 2: $234.00
* Stop: Back under $222
🔁 Summary Thoughts
* AMZN flipped from bullish gamma to negative gamma — puts are now driving price action.
* As long as price stays under $224, rallies are sell opportunities.
* Losing $215.50 risks an accelerated drop to $210 or lower.
* Bears remain in control unless buyers step in aggressively at support.
🚨 Disclaimer:
This analysis is for educational purposes only and does not constitute financial advice. Always do your own research and manage your risk accordingly.
Amazon Has a Mixed Technical Picture Heading Into EarningsNext week will see four of the "Magnificent Seven" stocks report quarterly earnings -- Apple NASDAQ:AAPL , Amazon NASDAQ:AMZN , Microsoft NASDAQ:MSFT and Meta Platforms NASDAQ:META . Let's check out AMZN ahead of its results.
Amazon's Fundamental Analysis
FactSet recently reported analysts' consensus view calls for S&P 500 companies to see 9.3% earnings growth for 2025 as a whole, of 9.3%, up from 9% in 2024.
But very interestingly, FactSet also said that earnings growth across the "Magnificent Seven" is projected at 14.1% year over year for just Q2 alone.
By contrast, analysts project just 3.4% y/y earnings gains for the S&P 500's other "Less Than Magnificent 493." That illustrates the Mag-7's impact on the broader market.
As for Amazon, analysts estimate that the e-commerce giant will see $1.32 in Q2 GAAP earnings per share on roughly $162 billion of revenue.
This would represent 4.8% y/y growth from Q2 2024's $1.26 in GAAP EPS, as well as a 9.5% y/y gain from the approximately $148 billion in revenues that AMZN saw in the same period last year.
This has become the norm for Amazon, as revenue growth has landed between 9% and 11% for each of the past four quarters (and is projected to print within that range for the next four quarters as well).
But significantly, of the 34 sell-side analysts that I can find that track AMZN, 27 have reduced their Q2 earnings estimates for the firm since the current quarter began. (The other seven swam upstream and actually boosted their forecasts.)
Amazon's Technical Analysis
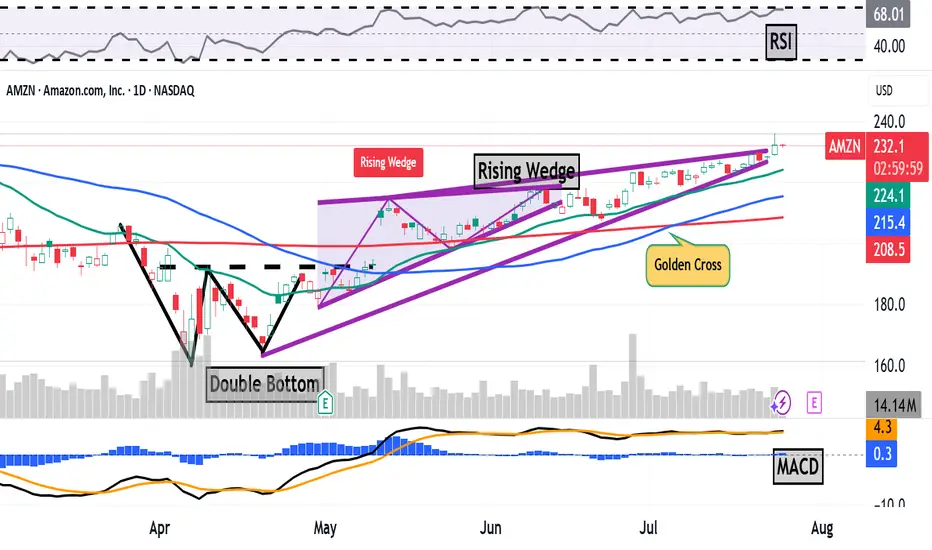
Next, let's look at AMZN's chart going back some six months and running through Tuesday afternoon:
This is an interesting chart, with both positive and negative technical signals.
On the positive side, the stock saw a "double-bottom" pattern of bullish reversal that spanned the month of April, with a $193 pivot (marked "Double Bottom" at the above chart's left).
That produced an upside breakout that appeared to accelerate, with a "golden cross" occurring on July 7 (marked at the chart's right).
A golden cross is generally seen as a bullish technical pattern that occurs when a stock's 50-day Simple Moving Average (or "SMA," denoted with a blue line in the chart) crosses above a rising 200-day SMA (the red line).
There's a catch, though.
While breaking out higher in the chart above, AMZN appeared to develop a "rising-wedge" pattern of bearish reversal, marked with purple diagonal lines in the chart above.
Readers will note that this pattern actually began at the nadir of the double bottom's second bottom in late April. The rising wedge's upper trendline then kicked in on May 13, but the pattern's two lines appear to be closing.
When a wedge closes after two to three touches on each trendline (which we have here), the resultant move can be explosive.
However, it's not necessarily clear which way a stock will move from there -- up or down. A true closing pennant can explode violently in either direction, but as noted above, what we're seeing with Amazon is a pattern of bearish reversal.
This does give me pause about AMZN and makes me more cautious than I might otherwise be about getting involved with the stock ahead of earnings. (I don't currently own any AMZN shares.)
Meanwhile, Amazon's Relative Strength Index (the gray line at the chart's top) looks strong, but nowhere near being technically overbought.
That said, the stock's daily Moving Average Convergence Divergence indicator (or "MACD," marked with black and gold lines and blue bars at the chart's bottom) isn't telling us much at all.
The histogram of Amazon's 9-day Exponential Moving Average (or "EMA," marked with blue bars) is flat-lining right around the zero bound, while the 12-day EMA (black line) is running in line with the 26-day EMA (gold line).
While both lines are running above zero, it matters greatly which one ends up on top. For the short to medium term, the bulls will be rooting for the black line, while the bears will be hoping that the gold line can wind up on top.
(Moomoo Technologies Inc. Markets Commentator Stephen “Sarge” Guilfoyle had no position in AMZN at the time of writing this column.)
This article discusses technical analysis, other approaches, including fundamental analysis, may offer very different views. The examples provided are for illustrative purposes only and are not intended to be reflective of the results you can expect to achieve. Specific security charts used are for illustrative purposes only and are not a recommendation, offer to sell, or a solicitation of an offer to buy any security. Past investment performance does not indicate or guarantee future success. Returns will vary, and all investments carry risks, including loss of principal. This content is also not a research report and is not intended to serve as the basis for any investment decision. The information contained in this article does not purport to be a complete description of the securities, markets, or developments referred to in this material. Moomoo and its affiliates make no representation or warranty as to the article's adequacy, completeness, accuracy or timeliness for any particular purpose of the above content. Furthermore, there is no guarantee that any statements, estimates, price targets, opinions or forecasts provided herein will prove to be correct.
Moomoo is a financial information and trading app offered by Moomoo Technologies Inc. In the U.S., investment products and services on Moomoo are offered by Moomoo Financial Inc., Member FINRA/SIPC.
TradingView is an independent third party not affiliated with Moomoo Financial Inc., Moomoo Technologies Inc., or its affiliates. Moomoo Financial Inc. and its affiliates do not endorse, represent or warrant the completeness and accuracy of the data and information available on the TradingView platform and are not responsible for any services provided by the third-party platform.
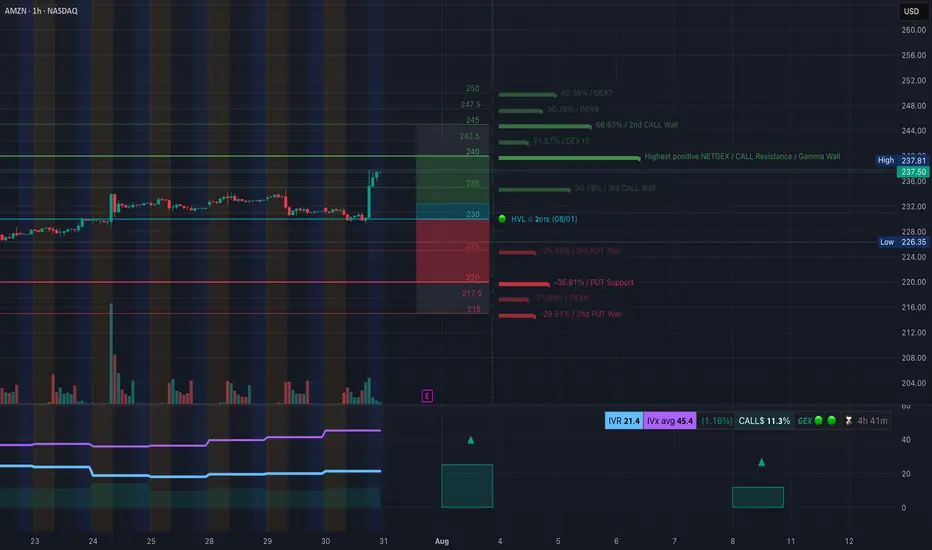
AMZN Launches Out of Trap Zone! What's next on Jul 31AMZN Launches Out of Trap Zone! Will Gamma Push Us to 245+ or Fakeout from Supply?
🔍 GEX & Options Flow Insight (1st Image Analysis)
AMZN broke out aggressively from a coil and is now trading at $237.50, right under the Gamma Wall and 2nd Call Wall. Gamma positioning shows bullish momentum potential, but current price is sitting just beneath the highest resistance zone.
* Call Walls & Resistance:
* ✅ $237.50–240.00 → 2nd Call Wall (66.63%) and Gamma Wall
* 📍 $245–247.5 → GEX8 / GEX7 → Final gamma expansion ceiling
* Put Support Zone:
* 🛡️ $231.01–230.31 → Immediate bounce zone
* 🔻 $225 / 222.18 → 3rd PUT Wall and true gamma defense layer
* Strong PUT flow at ~217.5 → Risk level for breakdown
* Volatility Insight:
* IVR: 21.4, IVx Avg: 45.4 → Normal volatility, not overly juiced
* Call flow only 11.3% = moderate bullish, not euphoric
* GEX status: 🟢🟢🟢 → Full bullish gamma support
✅ Option Trading Suggestion:
Bias: Bullish continuation above 234.00, but cautious at 237.50–240
Strategy: Debit Call Spread (conservative)
* Entry Idea: Buy 235C / Sell 240C (Aug 2 or Aug 9 expiry)
* Invalidation: Rejection below 233.20 or bearish engulfing under 231
* Target: 240 → 245 zone on squeeze
Why this works: Gamma positioning is stacked toward the upside and dealers are likely still short calls. Price just reclaimed the entire prior range — breakout traders are being trapped if this stalls under 238. If bulls stay above 234.72, a move toward 245 is likely.
🧠 Technical Analysis (1H Chart) (2nd Image Analysis)
Market Structure & SMC:
* ✅ CHoCH → BOS → 2nd CHoCH → strong BOS confirmed with today’s breakout
* 🚀 Price ripped out of descending wedge + liquidity trap below 230
* Purple Supply Zone (237.5–240) now in play as potential final resistance
Trendline Analysis:
* Long-term wedge broken to the upside
* Channel upper bound rising into 240–245 zone
SMC Zones:
* 🟩 Demand / OB Zone: 230.00–231.01 → Major flip zone
* 🟥 Supply Zone (Purple Box): 237.50–240.00 → If rejected, will trap late bulls
🔄 Price Action & Key Levels
* Support:
* ✅ 234.00–234.72 → Local structure support
* ✅ 231.01–230.31 → Flip zone and invalidation level
* 🔻 222.18 → 3rd PUT Wall → downside defense
* Resistance:
* 🚩 237.5–240.00 → Gamma Wall and supply resistance
* 🚀 245.00–247.50 → Final GEX extension zone
🧭 Scalping / Intraday Trade Setup
🟩 Bullish Setup:
* Entry: 234.50–235.50 (on retest)
* Target 1: 238.00
* Target 2: 240.00 → 245.00 extension
* Stop: Under 231.00 (invalidation)
🟥 Bearish Pullback Setup:
* Entry: Rejection at 237.50–238.00
* Target 1: 234.00
* Target 2: 231.50
* Stop: Close above 240
🔁 Summary Thoughts
* AMZN printed a clean breakout with volume, reclaiming full structure from CHoCH.
* GEX layout supports bullish continuation with targets toward 245 if 238–240 breaks.
* Price is in the final squeeze zone — gamma momentum + dealer hedging = fuel.
* Caution for late bulls: if AMZN stalls here and breaks under 233, it’ll retrace fast to 230–228.
🚨 Disclaimer:
This analysis is for educational purposes only and does not constitute financial advice. Always do your own research and manage your risk accordingly.
AMZN EARNINGSAMZN price action update:
Price is consolidating below the 240 resistance after a steady climb. Buyers are defending the 230 level, showing signs of absorption just above the ascending trendline.
The 233.50 breakout level could trigger momentum towards the 240 resistance. If breached, institutional targets extend toward 250.
Current consolidation suggests the Market Maker is trapping liquidity below 230 while buying time for a directional move.
Upside target: 250
Downside target: 220 if 230 fails
#AMZN #globaltrade #investment #investing #stockmarket #wealth #realestate #markets #economy #finance #money #forex #trading #price #business #currency #blockchain #crypto #cryptocurrency #airdrop #btc #ethereum #ico #altcoin #cryptonews #Bitcoin #ipo
AMZN - LONG Swing Entry PlanNASDAQ:AMZN - LONG Swing Entry Plan
Entry Zone 1: $220.00 – $217.00
→ Open initial position targeting +8% from entry level.
Entry Zone 2: $212.00 – $209.00
→ If price dips further, average down with a second equal-sized entry.
→ New target becomes +8% from the average of Entry 1 and Entry 2.
Edit Zone : $192.00 – $190.00
→ If reached, enter with double the initial size to lower the overall cost basis.
→ Profit target remains +8% from the new average across all three entries.
Risk Management:
Stop Loss:
Risk is capped at 12% below the average entry price (calculated across all executed positions including the Edit Zone).
Position Sizing Approach:
Entry 1: 1x
Entry 2: 1x
Edit Zone: 2x
→ Total exposure: 4x
→ Weighted average determines final TP and SL calculations.
______________________________________
Legal Disclaimer
The information provided in this content is intended for educational and informational purposes only and does not constitute financial, investment, or legal advice or recommendations of any kind. The provider of this content assumes no legal or financial responsibility for any investment decisions made based on this information. Users are strongly advised to conduct their own due diligence and consult with licensed financial advisors before making any financial or investment decisions.
Sharia Compliance Disclaimer: The provider makes no guarantees that the stocks or financial instruments mentioned herein comply with Islamic (Sharia) principles. It is the user’s responsibility to verify Sharia compliance, and consultation with a qualified Sharia advisor is strongly recommended before making any investment decisions

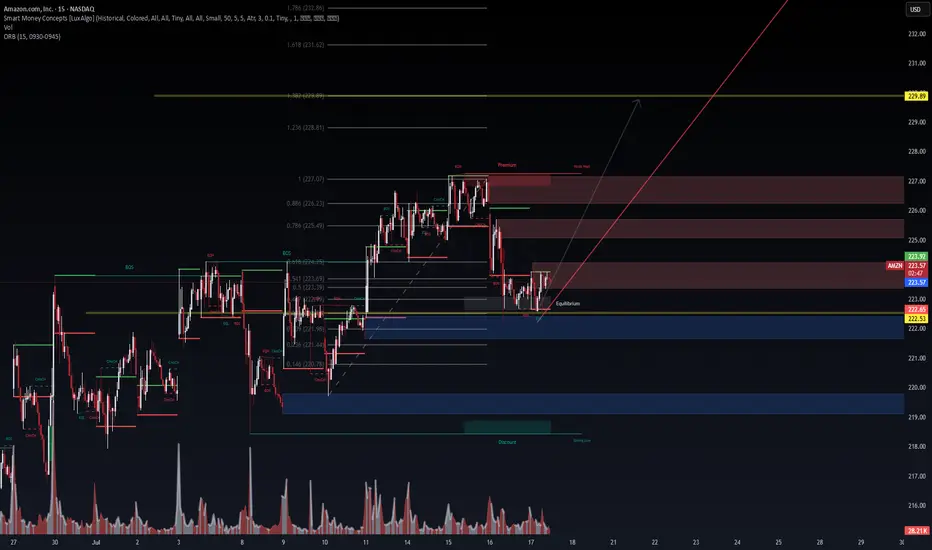
AMZN 15m – Institutional Demand Reclaim in Progress | VolanX Pro📈 AMZN 15m – Institutional Demand Reclaim in Progress | VolanX Protocol Alert
Amazon (AMZN) is staging a potential bullish reversal from a deep discount zone following a strong rejection near the 0.146–0.236 Fibonacci confluence at ~$220.78–221.44. We are now consolidating near the equilibrium zone (223) with signs of early accumulation.
📊 Technical Thesis:
Break of Structure (BOS) at 223.92 sets short-term bullish intent.
Reclaiming the ORB high and equilibrium.
Price rejected from deep demand (blue zone) and now printing EQH + BOS microstructures.
Premium liquidity sits above 227–229, with a magnet at FIB extension 1.618–1.786 = 231.62–232.86.
Volume profile shows declining sell pressure post-demand sweep.
📌 Key Levels:
Support: 222.53 | 221.44 | 220.78 (deep value zone)
Resistance: 226.23 (0.886 FIB) → 229.89 (FIB target zone)
Smart Money Premium: 226.5–229.8
🧠 VolanX Protocol Bias:
This is a long-biased setup, favoring institutional reaccumulation. If AMZN maintains above 223 with volume absorption, we anticipate a liquidity sweep through the premium zone, targeting 229.89.
🎯 Probabilistic Targeting:
60% → Retest 226.23 (EQH magnet zone)
30% → Breakout and reach 229.89 (measured move)
10% → Breakdown below 222.53 invalidates the setup
⚠️ Risk Note (VolanX Standard):
This post reflects strategic technical modeling, not financial advice. Trade your own system. View this as a signal integrity alignment, not a directive.
Amazon Market Robbery Blueprint – Swing/Scalp Long Setup🟨💣 “AMZN Market Heist Blueprint – Bullish Robbery in Progress 🚨💼💸” 💣🟨
By Thief Trader – Rob the Market with Precision
🌍 Hello World! Hi, Hola, Ola, Bonjour, Hallo, Marhaba!
🤑💰 Calling all Money Makers & Market Robbers – get ready to execute the next bullish heist on AMAZON.COM, INC (NASDAQ: AMZN), powered by our signature Thief Trading Style™ – where technical precision meets psychological warfare.
🔥 Plan Summary:
Based on our fundamental & technical intel, we’re eyeing a long entry into AMZN. The target? 💥The High-Risk ATR Police Barricade Zone – a zone flooded with liquidity, overbought conditions, fakeouts, and bear traps. It's where most traders get caught – but we walk in with a blueprint.
🟩 Entry Zone – “The Vault Is Wide Open!” 💼📈
🕰 Entry timeframe: 15min / 30min (preferably after confirmation or rejection wick)
💵 Buy Limit Orders: Place multiple layered entries (DCA-style) near recent swing lows/highs. Wait for breakout confirmation; no blind orders before breakout!
Thief Note: This isn’t spray-and-pray – this is sniper-mode. Scope, place, execute.🎯
🛑 Stop Loss – “SL is the Escape Route!”
📍 SL below recent 4H candle wick swing low (around 219.00 – adjust based on your risk/margin size).
Important: Only place SL after breakout; not before. Risk per order must match your lot strategy.
🎯 Target – “Grab the Bag or Escape Before the Alarms!”
💸 Target Zone: 240.00
🧠 Smart robbers know when to bail early – use a trailing SL to lock gains. Exit before reversal or heavy volume shift.
👀 Scalper Alert – “Only One Way – LONG!”
If you’re a quick thief with a fat bag, hit-and-run with a Long scalp. If you’re running lean, swing with the crew. Watch the PA and news timing. Trailing SL = insurance policy.
📊 Why Bullish? Here’s the Background:
🔍 Macro Drivers
💼 COT Report
🌍 Geo-political Influences
🧠 Sentiment Score
📈 Index Correlation
🔮 Intermarket Signals
💹 Institutional Positioning
All lights flashing green for short-to-midterm bullishness, but keep checking real-time updates.
⚠️ Risk Alert – News Triggers Can Blow Your Cover 🚨
🗞 Avoid trading near major news releases – they cause volatility spikes.
🧲 Always protect gains with trailing stops and don’t over-leverage your ammo.
💖 Support the Robbery – Hit BOOST 🔥
Smash that 💥BOOST💥 button if you ride with the Thief Trading Crew!
Let’s build this into the #1 robbery squad on TradingView.
Make money. Protect profits. Trade like a bandit – with a plan. 💼📈🏆
🔔 Stay Tuned for the Next Robbery Mission 🔔
Another heist plan dropping soon. Until then, rob smart, rob safe, and rob rich.
– Thief Trader™ | Rob The Market. Not Your Wallet.
AMZN: Daily Trend Change with Bullish Continuation Setup
🗓 Published: June 26, 2025
📍 Ticker: NASDAQ:AMZN – Amazon.com Inc.
🕒 Timeframes: Daily & 4H
📊 Technical Bias: Bullish
📈 Trend: Higher Highs & Higher Lows
🧠 Analysis Summary
Amazon has successfully reclaimed a bullish market structure on the daily chart by forming higher highs and higher lows since late April. Price is now retesting a key support zone around $209–$212, which aligns with both horizontal support and the rising trendline.
On the 4H chart, the price is stabilizing near the trendline support, offering a high-probability long entry setup if the current structure holds.
📍 Key Levels
Price Level Description
206.28–206.42 Key support zone (invalidation area)
209.06 Local demand area
212.06 Retest level, potential entry
214.76 Local high / minor resistance
219.92 Intermediate target zone
225.22–225.29 Main bullish target / resistance
✅ Trade Setup
Entry Zone:
🔵 Long between $209.00 – $212.00 on confirmation of support
Take Profit Targets:
TP1: $214.76
TP2: $219.92
TP3: $225.22–225.29
Stop Loss:
🔴 Below $206.00 (break of structure + trendline invalidation)
Risk:Reward Potential: ~1:2.5
🔍 Confluence Factors
Daily trendline acting as dynamic support
Demand zone overlap at $209
Volume spike near base, suggesting buyer interest
Higher low formation + potential breakout of local range
⚠️ Risk Note
Only valid if price holds the $209–$212 demand area. If $206.00 is broken with strong bearish candles, the long setup is invalidated and a reassessment is required.
💬 Do you think AMZN will reclaim $225 by earnings? Let me know your outlook!
🚀 Stay patient, follow price structure, and manage your risk properly.
Rendon1

Amazon Wave Analysis – 21 July 2025
- Amazon broke resistance zone
- Likely to rise to resistance 240.00
Amazon recently broke the resistance zone between the resistance level 227.30 (top of the previous impulse wave i) and the resistance trendline of the daily Rising Wedge from May.
The breakout of this resistance zone accelerated the active impulse wave 5 of the intermediate impulse sequence (C) from April.
Given the strength of the active impulse wave 5, Amazon can be expected to rise further to the next resistance level 240.00 (former multi-month high from February and the target price for the completion of the active impulse wave iii).
AMZN is ready to lift offPrice has successfully retest support zone around 185$.
Expecting trend continuation, targets are on chart.
NFA
DYOR

AMZN dip buyAMZN was one of the names hit the most after today's/this weekly drop. over 8% fall. no need to check the RSI to see how oversold it is lol. I think the market will see a mag 7 stock drop this large as a buying opportunity which made me look at TA. the 4 hr has a red hammer and has a new higher high on the 15m.

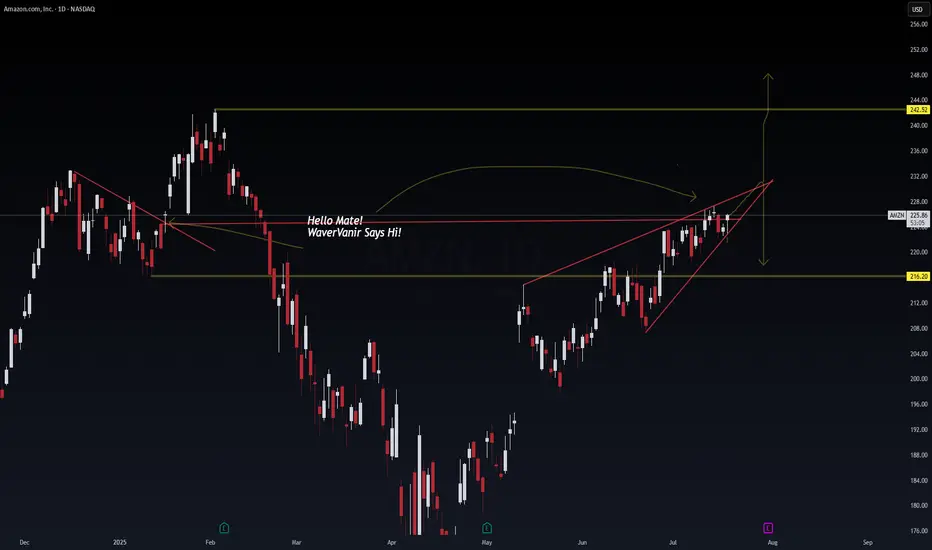
AMZN – Wedge Complete, Decision Imminent📦 AMZN – Wedge Complete, Decision Imminent
Price action has carved out a clean rising wedge into a known inflection zone. The top of this formation aligns with a macro breakdown level from Q1—likely to attract both breakout chasers and smart sellers.
📍 Key Levels:
Bull Break Target: $242.52
Bear Breakdown Target: $216.20
Decision Point: ~$228
This is a textbook volatility pocket. WaverVanir's DSS signals suggest we're nearing exhaustion. Watch for confirmation before positioning.
⚙️ VolanX Protocol – Predictive AI meets Market Structure.
#AMZN #WaverVanir #VolanX #SmartMoney #TradingView #NASDAQ #WedgePattern
(AMZN) | 1H Chart Long
“Buyers defended the zone hard. Tight bull flag breakout setup forming after the demand tap. Looks like this thing wants to take another leg up. Clean R/R if managed tight.”
Price surged impulsively from mid-July lows, followed by a shallow correction—suggestive of a micro **Wave 4**.
* Current bounce off demand zone implies the potential start of **Wave (5)** to retest or break highs.
* **Demand Zone:** \$228.00–\$230.00 —
* **Supply Zone:** \$236.00 —234
🎯 **Trade Setup (Long Bias):**
* **Entry:** \$230.20 (current level near demand bounce)
* **Stop Loss:** \$228.80 (below the demand zone)
* **Take Profit :** \$236.00
* **Risk/Reward:** \~**1:3 RR**
*“The goal of a successful trader is to make the best trades. Money is secondary.” – Alexander Elder*
#### ⚠️ **Disclaimer:**
This is for educational purposes only and not financial advice. Trade at your own risk. Always manage your capital responsibly and use proper risk management.
AMZN HEADING INTO AUG 25'SHORT AMAZON
Amazon is current going to retest all time highs.
I want amazon again for a buy in the $209-218 range.
I don't think see Amazon below $208 again.
Going to fail on retest of ATH right now and cool off, bring rsi down back to 50-60 Zone, before consolidating for a break of the all time highs to close out the year.
Amazon always shines in Q4 with Holidays, so expect a great close to the year, but it's an overbought stock right now. (isn't it always??...lol)

AmznLooks like 250 is incoming on this stock
V-shape recovery happening in real time
Don't put too much Emphasison this rising wedge in terms of bearishness.. just use it as a range to trade... Will most likely trade inside of it until a catalyst comes to push it to breakout to the upside
Looking for 230 this week
I like any Dips down to 222. Range will be tight so keep that in mind if you are swinging short dated
AMZN Short1.Liquidity Landscape
Buy-Side Liquidity Cleared:
Liquidity above the recent swing high was taken — likely triggering breakout traders and stop orders from earlier shorts.
This move appears to be a classic liquidity raid before a reversal.
Sell-Side Liquidity in Focus:
Price is now targeting sell-side liquidity resting below recent higher lows (e.g., below ~222 and especially near 218.50).
This aligns with the direction of your arrow, suggesting price may hunt liquidity pools beneath internal lows.
2. Confirmation via Reaction
The strong rejection from that supply zone confirms no intent to hold price above 227, meaning that was likely a liquidity raid, not a genuine breakout.
Price has already broken below the midpoint (0.5 level at 222.85), adding confidence to the short bias.
3. Liquidity Targets Below
The next likely targets are sell-side liquidity pools resting below:
Around 218.50 (marked zone)
Deeper lows near 211–212, and potentially 208–209, where untouched demand and previous stop clusters lie.