AMZN BUYBUY AMZN at 182.00 to 173.00, riding it back up to 240.00 to 255.00 as Profit Targets, Stop Loss is at 161.00!
If anyone likes mumbo jumbo long useless analysis,
than this is NOT for you.
Also, if you are afraid of risk, failure, and want only a 100% sure thing, than...
run as fast as you can from here and from the markets,
because it is definitely NOT for you.
WARNING: This is just my opinion of the market and its only for journaling purpose. This information and any publication here are NOT meant to be, and do NOT constitute, financial, investment, trading, or other types of advice or recommendations. Trading any market instrument is a risky business, so do your own due diligence, and trade at your own risk. You can loose all of your money and much more.
AMZ trade ideas

AMZN Stuck Between GEX Walls – Breakout or Breakdown Coming? 6/2🧠 GEX Daily Outlook (Options Sentiment Setup)
Amazon ( NASDAQ:AMZN ) closed around $205, sitting almost flat right below the HVL (High Volume Level) and the critical 202.5–208 gamma resistance cluster. This week's setup is tricky — you're right between big put support and call resistance.
GEX Flow Highlights:
* 🟢 87.21% Call Wall @ 212.5 = dealer resistance, hedging likely to cap price short-term.
* 🟥 Strong Put Support @ 195 (–78.52%) — big negative GEX means downside can accelerate if we go there, but also where price could bounce.
* 🧊 IVR at 17.4 = super cold. That makes debit spreads attractive this week.
💡 Options Strategy Ideas (based on GEX):
* Bullish: Break + hold above 208 (GEX wall) → consider Jul 19 215c or 210c/220c debit spread.
* Bearish: Lose 202.5 + see continuation → consider Jul 19 200p or 205p/195p vertical for risk-defined downside.
Key Range to Watch: 202.5 support ↔ 208 resistance
Options are cheap, so early positioning before a breakout/down makes sense.
⏱️ 1-Hour Price Action (Swing & Intraday Outlook)
Zooming in, AMZN’s been in consolidation just below resistance around 205.7, rejecting from that upper CHoCH zone at 211.9. Friday’s price action gave us a minor BOS to the downside, but bulls stepped in from around 202 again.
Here’s what stands out:
* 📍 CHoCH + BOS shows recent structure shift.
* 🟣 SMC supply zone at 211.9 is still untested again — that’s the swing target if 208 breaks.
* 🟩 Demand at 196, backed by both volume and SMC blocks — potential support for deep pullback.
📈 Swing Setup:
* Bullish Swing: Long above 208, targeting 211–215 with stop under 204.
* Bearish Swing: Short if 202.5 breaks with volume → target 198 and then 196.
📉 Intraday Setup:
* Morning fade into 202–203 is playable for quick long scalp to 205.
* Rejection near 205.7–206 again = scalp short back to 202 zone.
Best setups are reaction plays at key zones — don’t chase in the middle.
🎯 Final Take
AMZN is primed — either we clear 208 and gamma flips bullish into 212.5+… or we lose 202.5 and slide into the 195 put-heavy support. IV is cheap, and a breakout move could bring both delta and vega gains on calls. Watch volume around those inflection points for confirmation.
⚠️ Disclaimer:
This analysis is for educational purposes only and not financial advice. Always do your own due diligence and trade responsibly.

Amazon UpdatePrice has re-entered the target box. I mentioned last week that price could still try to target the 1.618 @ $220.01. Judging by the ES, I think it is highly likely that is what is going on. We're still currently trading on hidden bearish divergence which doesn't bode well for a sustained move higher. I think it more likely that we make another slight high towards the 1.618 on neg div setting up the larger move lower for minor C.
The key support price we need to breach that will point us lower is $196. If we can get below that, the momentum will change to the downside. First, we will likely make OMH though. We manage to breach $196 though, and sub $140 comes into view. This will take time. Don't think that it will happen tomorrow or even next week. Minor C will take weeks if not months to complete.

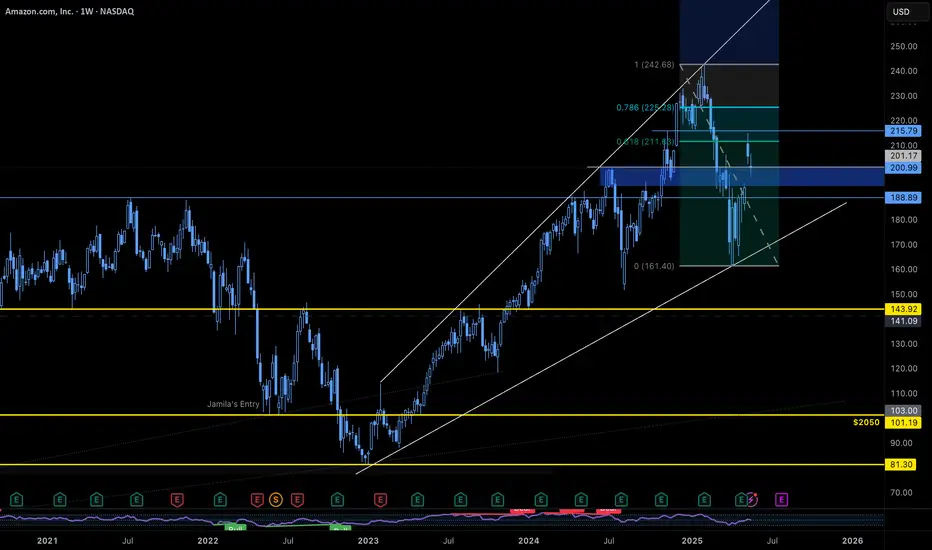
AMAZON eyes $255 on the 3rd such buy signal in 18 months!AMAZON Inc. (AMZN) has been trading within a 18-month Bullish Megaphone pattern whose latest bottom was on the April 07 2025 Low. Since then, the pattern has started its new Bullish Leg, which has been confirmed by the break-out above its 1D MA50 (blue trend-line) and the 1W RSI's above its MA.
The previous two Bullish Legs hit at least their 3.5 Fibonacci extension levels and the 2nd Bullish was +30% more than the 1st. If the stock achieves a +60% gain from its April bottom again, it will be almost exactly on its 3.5 Fib ext.
As a result, we believe that a $255 Target (on the 3.5 Fib), is more than realistic to be achieved by September.
-------------------------------------------------------------------------------
** Please LIKE 👍, FOLLOW ✅, SHARE 🙌 and COMMENT ✍ if you enjoy this idea! Also share your ideas and charts in the comments section below! This is best way to keep it relevant, support us, keep the content here free and allow the idea to reach as many people as possible. **
-------------------------------------------------------------------------------
💸💸💸💸💸💸
👇 👇 👇 👇 👇 👇

AMZN | Long | Strong Earnings Momentum | (May 28, 2025)AMZN | Long | Strong Earnings Momentum + Structural Breakout | (May 28, 2025)
1️⃣ Quick Recap: We're in a long trade on Amazon (AMZN), and the setup is unfolding well. TP1 and TP2 have already been hit after flipping key resistance into support. The trend is intact, and we're now aiming for higher levels as long as the structure holds. 💪📊
2️⃣ Trade Parameters:
Bias: Long
Entry: Previously established
Stop Loss: Moved to Entry (risk-free position)
TP1: ✅ Hit
TP2: ✅ Hit ($201)
TP3: $217
TP4: $241
Partial Exits: Ongoing — looking to scale out at remaining targets
3️⃣ Key Notes:
✅ Amazon continues to show strong growth fundamentals:
– Revenue: $637B
– Net Income: $60B
– Market Cap: $2.18T
– EPS: 6.26
– PE Ratio: ~33
✅ Strong employee growth (+31K, a 2% increase), signaling continued expansion
✅ Financial forecasts suggest solid growth for the next 4 quarters and full-year estimates — with a potential slowdown only beginning Q1 2026
✅ The technical structure flipped resistance into support, confirming a bullish continuation
❌ A deeper macro slowdown or disappointing forward guidance in late 2025/early 2026 could pressure valuations — monitor this closely
4️⃣ Follow-Up: As long as price holds above our entry zone, we’ll keep managing this trade toward $217 and $241. If momentum continues, we may revisit the setup for potential re-entries or compounding opportunities.
Please LIKE 👍, FOLLOW ✅, SHARE 🙌 and COMMENT ✍ if you enjoy this idea! Also share your ideas and charts in the comments section below! This is best way to keep it relevant, support us, keep the content here free and allow the idea to reach as many people as possible.
Disclaimer: This is not a financial advise. Always conduct your own research. This content may include enhancements made using AI.

$AMZN Weekly Setup – Watch the $193 GapHere's what we're seeing on the weekly chart:
Price recently hit the 61.8% fib retracement from the all-time high to the April 2025 low
Sitting on strong support from the July 2024 high
A gap at $193 is just below current levels
If the gap closes and holds, we could see a continuation of the recent move higher — setting up a powerful weekly higher low. This could offer broader momentum in the large-cap tech space.
NASDAQ:AMZN
Steady Support at $200: Is It a Prime Opportunity to Go Long?
Targets:
- T1 = $209.00
- T2 = $215.00
Stop Levels:
- S1 = $198.00
- S2 = $193.00
**Wisdom of Professional Traders:**
This analysis synthesizes insights from thousands of professional traders and market experts, leveraging collective intelligence to identify high-probability trade setups. The wisdom of crowds principle suggests that aggregated market perspectives from experienced professionals often outperform individual forecasts, reducing cognitive biases and highlighting consensus opportunities in AMZN.
**Key Insights:**
Amazon's current price of $200.99 represents a strong psychological and technical support level. The stock has shown resilience despite headwinds in the broader market and competitive pressures in the technology sector. Its focus on integrating advanced AI technologies throughout its operations provides a solid growth narrative going forward. Analysts widely view its cloud computing arm, AWS, as a pillar for consistent revenue generation despite seasonal fluctuations. Additionally, Amazon continues to innovate in retail dynamics, sustaining its relevance in a matured e-commerce market.
However, potential risks to the bullish outlook include heightened regulatory scrutiny from the FTC and evolving antitrust laws, along with increasing competition from peers adapting to AI and cloud innovations. The stock’s ability to break through short-term resistance near its 50-day moving average could signal stronger upward momentum.
**Recent Performance:**
Throughout the past month, AMZN has experienced moderate volatility, dipping below its 50-day moving average while testing its yearly support levels. A brief consolidation showed improved buying interest, indicating that market participants may see the current price as undervalued relative to future prospects. Despite setbacks from heightened inflationary pressure on discretionary spending, Amazon’s diversified revenue stream continues to support overall stability.
**Expert Analysis:**
Many technical analysts are bullish on AMZN's trajectory, particularly with its RSI trending upward from oversold levels, suggesting strong internal momentum for a reversal. Fundamental experts highlight Amazon's robust financial flexibility to reinvest in growth areas and innovation platforms such as logistics automation and AI-enhanced advertisement solutions. Breaking resistance above $202 will likely be pivotal, unlocking upward potential toward the $209-$215 range.
**News Impact:**
Recent headlines around Amazon include ongoing FTC antitrust investigations, which may result in heightened legal risks in the future. However, the company's approach to expanding its AI investments, particularly through AWS, has garnered positive media attention. These developments underscore Amazon's resilience in balancing regulatory challenges with sector-leading innovation, which bodes well for its long-term prospects.
**Trading Recommendation:**
Amazon’s current setup presents an opportunity for long traders willing to absorb near-term risks while capitalizing on the stock’s bullish potential. Buyers should watch for a decisive break above $202 as confirmation for upward momentum. With strong support at $200 and a favorable growth outlook, AMZN is poised to deliver attractive returns over the coming weeks. The recommended stop levels provide a prudent risk management framework to safeguard against unexpected downside risks.

$AMZN Cracks Once AgainIt should be no surprise that after massive gains such as we have seen lately, stocks tend to retrace 60-70% or more back to the origin from whence they came.
This is largely due to the Market Maker "Making a Market" for everyone to play in, but mostly so they don't loose any money.
The Tech space in general and Especially names like NASDAQ:TSLA , NASDAQ:AMZN , and NASDAQ:NVDA are flashing warning signs. A Major pullback event is coming.
Likely the second wave down to our first tariff wave seen earlier in march.
The CCI is rejecting on the High time frame, along with a rather lartge Head and Shoulders Pattern forming.
Some may call it a Double Bottom. Truth be told it's not fat a booty unless it worth slapping, and at these prices, she's all dried up.
Target 119 to close the Weekly box then accumulate with caution.

Amazon should be closely look for resistanceAmzon has importance resistance to be break at 218.25 USD with closed candle above 218.25. if it not close over 218.25 after it test this resistance. it might have a chance for dropped by 10%++. However, if it closed above 218.25 and stay drop for time frame 240 min. this is a chance for long to test 233.58 resistance.

Heikin Ashi VS Regular candlesticks - EducationalNASDAQ:AMZN
Everything is explained in the video.
I hope you will find it very educational and test it. Those who trade stocks will probably switch to Heikin Ashi :)
Thank you!

AMZN - PULLBACK INTO NEXT SWINGGood Morning,
AMZN - Another stock that initiated a pullback. Not to fear, AMZN is trending towards a support. If it does not hold we would experience lower lows. My opinion is that it will hold given the strong bullish momentum. We will see it complete its final wave and then a correction.
ENJOY!

$NVDA $TSLA $META $AMZN – Triangle Squeeze Incoming?📊 Symmetrical triangle formations are building across these tech giants — and volatility is compressing.
🔍 What to watch:
📈 Breakout above upper trendline = bullish momentum
📉 Breakdown below lower trendline = bearish confirmation
📉 RSI on NASDAQ:NVDA is at 73.04 = overbought warning
⚠️ NASDAQ:NVDA earnings drop May 28, could be a trigger for resolution
These coils don’t last forever. Price is building pressure — and one strong candle could break the dam.
Stay sharp, and tighten your stops.
This is where risk management matters most.
👇 Which side are you betting on — breakout or breakdown?

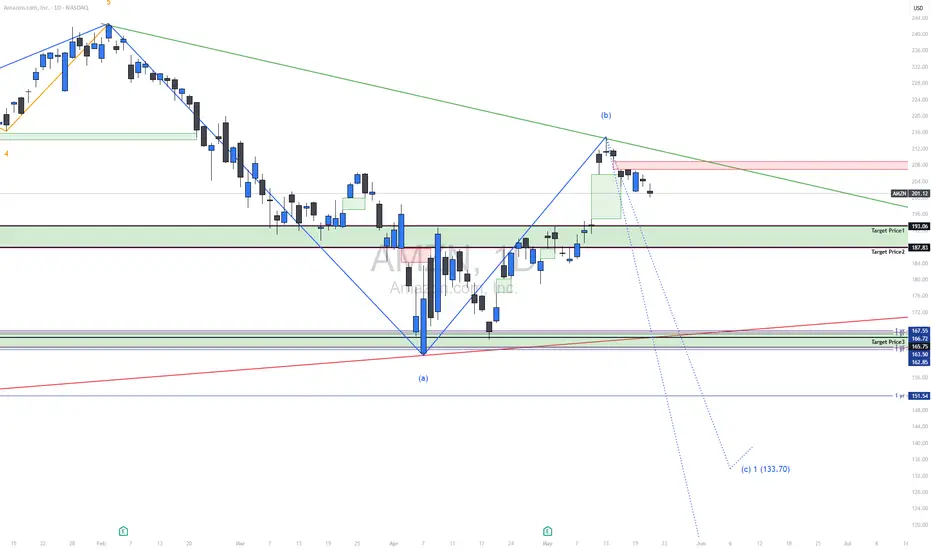
SHORT | AMZN NASDAQ:AMZN
Current Price Action:
Price: $201.12
Recent Drop: -2.95 (-1.45%)
Support and Resistance Levels:
Immediate Resistance: $208–$212 (recent rejection zone)
Immediate Support: $193.06 (Target Price 1)
Further Supports:
Target Price 2: $187.83
Target Price 3: $167.55
Target Price 4: $164.72 / $163.55
Target Price 5: $151.54
Final Wave Target (c): $133.70
Trendlines:
Green Downtrend Line: Remains respected; price rejected at confluence.
Red Long-Term Support Trendline: Still valid; could act as a structural bounce level if tested.
Recent price action shows a breakdown from the short-term bullish move, indicating possible start of wave (c) to the downside.
Wave Structure:
Completion of corrective wave (b) followed by potential impulsive wave (c) targeting lower support areas.
Elliott Wave count suggests $133.70 is a possible wave (c) extension zone under bearish pressure.
Target Prices:
Target Price 1: $193.06
This zone is a minor support where bulls may attempt a defense.
Target Price 2: $187.83
A structural level from previous consolidation and a high-probability zone for price reaction.
Target Price 3: $167.55 – $163.55
Consolidated support zone; may attract buying interest or lead to acceleration if broken.
Target Price 4: $151.54
1-year support and psychological level.
Target Price 5 / Wave (c): $133.70
If the bearish wave unfolds fully, this is the projected terminal zone.
Summary:
Amazon (AMZN) has rejected a key resistance zone and appears to be entering wave (c) of a broader correction. The structure is bearish below the downtrend line and indicates further downside. Critical support levels to watch are $193.06 and $187.83 in the short term, with deeper targets at $167.55 and possibly as low as $133.70. This correction could accelerate if key support zones are breached.
Market prep 5-21The market sold off overnight, but nothing dramatic. A further move down and then recovery is a possibility. Gold pullbacks will likely be bought.

Amazon is looking at a short-term upside continuationNASDAQ:AMZN is looking good and from the Ichimoku perspective, the stock is showing a good bullish signal after bullish bar was seen closing above the kumo. Furthermore, the stock has confirmed its oversold crossover from its mid-term stochastic oscillator and 23-period ROC.
Price action wise, the stock saw a strong bullish flag in the making and prices has revert back above the 2020 March uptrend line.
For this, we are targeting 161.8% expansion of AB=CD

Using Advanced Hybrid Leading Indicators for Swing Trading The professional side of the stock market has undergone massive infrastructural changes in the past 5 years. These changes are unknown to most retail traders and that can pose major problems for you success and profitability no matter what trading style you use.
A trading style is a type of trading that has specific parameters to which strategies can be applied based on the current market condition. Currently, we have a Bottoming Market Condition that is poised to shift to a Moderately UpTrending Market condition.
The 3 sets of data used in stock indicators are Price Time and Quantity. Most retail traders use outdated price and time indicators from the 80's and 90's.
Unfortunately these indicators no longer work in the modern, millisecond transaction market which is dominated by Dark Pools and professional traders.
Hybrid Leading indicators use all 3 data sets in a complex mathematical formula that provides a leading indicator for you to use.
The Chaikin Oscillator is an excellent Hybrid Leading Indicator that has a CENTER LINE oscillation which provides more information about price direction, change of direction, duration of the run up or down and leads price.
An indicator that LEADS price means that it signals a day or a minute ahead of the change of direction of price on the candlestick charts. This is invaluable to swing and day traders who need to be able to quickly sell or buy-to-cover to net the highest profits from each trade while reducing risk factors of whipsaw action especially intraday.
Intraday traders must use indicators that signal ahead of the price direction change. Unfortunately, most traders are using outdated price and time cross overs which ALWAYS lag as the price must move down or up before the crossover can form on the indicator chart.
To improve your profitability start using center line indicators that have all 3 data sets within the mathematical formula.

Quick View: $AMZNEMA21 at the crossover of the EMA50 and price is pulling back.
Watching for a #TopSwing Setup
Area of $215 as key resistance.
Support → $193 and $176

AMZN watch $186-189: Key Resistance zone for Recovery BounceAMZN struggling with China tariffs but trying to recover.
Now up into a key resistance zone at $186.75-188.98
Anticipating some consolidation below or within zone.
.
Previous analysis that called the TOP:
===================================================

AMZN: A Power Move for the Smart Trader | The Rebound Play?🚀 AMZN 2025 Trade Plan
After an early 2025 rally to $240+, Amazon (AMZN) has pulled back sharply to around $167, opening the door to what could be one of the most attractive rebound setups of the year.
With AWS still growing strong and net income nearly doubling in 2024, the fundamentals are on Amazon’s side. Add to that bullish analyst outlooks pointing to $226–$253 this year, and we might just be looking at a golden entry zone.
📌 Entry Points:
Start building a position at $167
Add more if it dips toward $160 or $151 (52-week low)
🎯 Profit Targets for 2025:
First stop: $210
Next: $226
Final push? $240+
This setup blends technical recovery with strong financials and long-term bullish sentiment. Patience, discipline, and solid risk management are key as AMZN finds its footing.
⚠️ Disclaimer: This is not financial advice. All trading involves risk. Always do your own research and consult with a licensed financial advisor before investing.

Amazon Partners with FedEx as UPS Pays the PriceBy Ion Jauregui – Analyst at ActivTrades
Amazon (NASDAQ: AMZN) has taken a strategic step by partnering with FedEx (NYSE: FDX) to handle part of the delivery of its bulkier packages. The multi-year agreement, signed in February, marks a significant shift in the logistics chain of the e-commerce giant, which until now had relied less on FedEx, especially after years of tension between the two companies.
This long-term contract strengthens Amazon’s position by diversifying its distribution network and allowing it to reduce operational costs compared to its other major partner, UPS (NYSE: UPS). The news comes at a critical time for UPS, which recently announced 20,000 job cuts and the closure of 73 logistics centers. These measures respond to a sharp decline in parcel volumes from Amazon, one of its key clients.
Recent Financial Results:
Amazon closed 2024 with net sales of $638.0 billion, an 11% increase from 2023. Its net income doubled, reaching $59.2 billion, while its cloud services arm, AWS, generated $107.6 billion in revenue and $39.8 billion in operating income.
FedEx reported $22.2 billion in revenue for the third fiscal quarter of 2025, with adjusted net income of $1.09 billion and adjusted EPS of $4.51.
UPS recorded $91.1 billion in revenue in 2024, with a net income of $5.78 billion — a 13.8% decrease year over year. The company also announced it expects parcel volume from Amazon to drop by more than 50% by mid-2026.
Amazon’s decision appears to pursue two clear goals: increasing control over its logistics chain and optimizing last-mile delivery costs. With an increasingly robust transport network and deals like the one with FedEx, the Seattle-based giant continues to reduce its reliance on third parties while strengthening its ability to manage demand spikes more efficiently.
For FedEx, the agreement represents an opportunity to regain ground lost to direct competitors and reestablish itself as a key player in e-commerce logistics. Meanwhile, UPS will need to rethink its strategy to adapt to an environment increasingly shaped by efficiency, automation, and margin pressure.
Amazon Technical Analysis
Since late 2023, Amazon has been trading in a bullish channel, reaching an all-time high of $242.52 in January. The stock then pulled back slightly during the first week of April, creating a new support level around the same area on April 21. Yesterday’s session opened quietly, continuing the bullish gap from the day before. The RSI shows a high overbought level at 67.98%, which could signal a correction toward the point of control (POC) near $188. The moving average crossover on April 16 reinforced a bearish trend, suggesting a possible sideways movement between $222 and the lows of $162. If the price reaches the upper range again, it may face resistance unless Amazon’s online retail performance improves by the end of the quarter.
In a sector where speed, cost-efficiency, and adaptability are key, Amazon once again demonstrates its ability to stay ahead of the curve.
*******************************************************************************************
The information provided does not constitute investment research. The material has not been prepared in accordance with the legal requirements designed to promote the independence of investment research and such should be considered a marketing communication.
All information has been prepared by ActivTrades ("AT"). The information does not contain a record of AT's prices, or an offer of or solicitation for a transaction in any financial instrument. No representation or warranty is given as to the accuracy or completeness of this information.
Any material provided does not have regard to the specific investment objective and financial situation of any person who may receive it. Past performance is not reliable indicator of future performance. AT provides an execution-only service. Consequently, any person acting on the information provided does so at their own risk.

Amazon (AMZN) shares jump more than 7%Amazon (AMZN) shares jump more than 7%
As shown in the Amazon (AMZN) share chart, the price surged by over 7% yesterday, breaking above the key psychological level of $200 and closing at its highest point since early March.
The sharp rise in demand was driven by reports of a trade truce between the US and China following talks in Geneva. According to Reuters, the US has decided to lower the “de minimis” threshold on goods from China. This move could help de-escalate a potentially damaging trade war between the world’s two largest economies. For AMZN stock, this is a bullish signal, as Amazon sells a wide range of low-cost Chinese goods.
Technical analysis of Amazon (AMZN) shares
From a bearish perspective, the AMZN price has recovered to the 0.618 Fibonacci retracement level after falling from an all-time high to the early April low. In this context, selling pressure may re-emerge with the intention of resuming the downtrend—especially as most oscillators on the chart are signalling strong overbought conditions.
From a bullish perspective:
→ The pattern of higher highs and higher lows in late April and early May may have outlined the median of an ascending channel;
→ Yesterday’s price surge in AMZN shares may point to the channel’s upper boundary.
Given these conditions, it is reasonable to expect a minor pullback before the Amazon’s stock price resumes its upward trajectory within the blue channel.
This article represents the opinion of the Companies operating under the FXOpen brand only. It is not to be construed as an offer, solicitation, or recommendation with respect to products and services provided by the Companies operating under the FXOpen brand, nor is it to be considered financial advice.

AMAZON LongAMAZON is now net long on the regression break.
I am reviewing all market options this morning.

How to Trade with Professional TradersThe most important professional side group you need to learn to trad with are the professional traders. Many work for the Sell Side Institutions on huge trading floors or from their home office. Some work for the Buy Side Institutions and trade for the Giant Pension funds companies, Mutual funds companies and Derivatives Developer companies.
There are also Independent Professional Traders which is a growing number of floor traders who now trade in the home office for themselves.
One thing about pro traders you need to remember is they are highly competitive and do not share anything. They are loners and prefer a quiet place where they can trade uninterrupted. They do not have chat groups. They do not have guru groups.
They are reclusive and you will never see them giving a retail news interview.
Their trading is to track the Dark Pool hidden quiet accumulation or quiet rotation to sell short. They do not move price in big runs up or down.
Instead the use very controlled, bracketed orders that keep a tight penny to few penny spread as their entry price. The do not use VWAP. Instead, they use TWAP Time Weighted at Average Price which sets up an order on the millisecond time frame to ping automatically at a specific price range that is very tight.
Learning to read stock charts so that you can see the pro trader setups which start often 3-5 days ahead of the actual momentum run that follows their pro trader nudges candle patterns. These candle entry signals are not in the older Candlestick books. Nudges as an entry signal started a few years ago and now is the standard for most pro traders.
When you can read a stock chart, and in particular candlesticks, then you will be able to pick out the professionals easily.
Volume is often below its average as professionals are not making the momentum, they are using their strategies for swing trading to entice smaller funds, or HFTs or retail traders to move price for them. Thus they have an easy free ride of price movement.
Instead of waiting for a big gap learn how to enter early. Learn how to be patient and wait and then learn how to exit when the pros are selling into the buying spree of smaller funds and retail groups.
