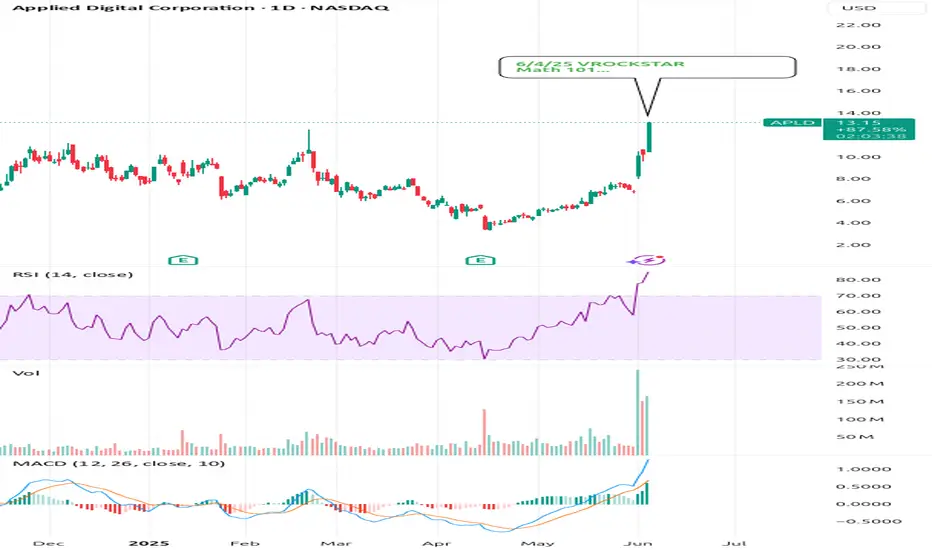
6/4/25 - $apld - Math 101...6/4/25 :: VROCKSTAR :: NASDAQ:APLD
Math 101...
- if you haven't seen by now, NASDAQ:CRWV is the last meme to come out of the money slush go wheee
- i'm not going to short NASDAQ:CRWV , but it's worth significantly less
- i'm also not going to short NASDAQ:APLD b/c it's basically a beta on NASDAQ:CRWV
- but what i'll say is... burning a billy a year and having just deep throated the last earnings release such that the stock was well on it's way to zero (it would actually be worth less than zero if equity didn't get min'd at zero)... well that's one of these situations where you "stay away"
- many times in mkts, you can buy, sell or hold
- but what you don't hear a lot of people saying is "stay away/ ignore". they want to touch the stove. it's a parlay-style degen "investment".
- take it from someone who used to play this game, you ought to know what you're doing
- if you're just guessing... remember... you'll ultimately lose it all.
- IV on this puppy is so sky high that anything can happen next
- but i'll make a friendly bet:
- this stock goes back into the single digits by year-end
- and i'll parlay it all for the degens:
- it's a donut.
enjoy the ride. but beware the animal spirits. because animal spirits can sometimes be pretty low IQ feelings. and feelings don't work out in mkts.
V
APLD trade ideas
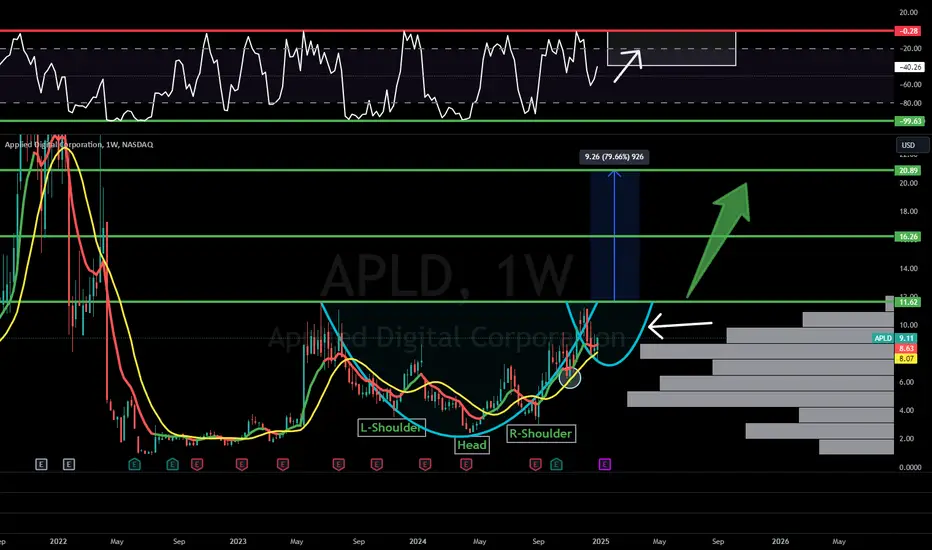
A 10x on APLD ? Applied Digital has confirmed a multi-year symmetrical triangle breakout on the weekly chart, marked by immense volume and a clean breakout above long-term downtrend resistance. The base of the triangle spans several years, with consistent higher lows forming a solid support line.
🔺 Breakout Volume: Massive volume surge confirms strong institutional or speculative buying interest.
🟠 Heavy Resistance: $28.60 identified as the next major challenge before a full trend expansion.
🧠 Measured Move Target: Triangle projection suggests potential upside toward $140.00 , a 3,000%+ move from the breakout zone.
🟨 Support Zones: $11.00 (area of demand) and $4.50 (triangle confirmation level) now act as strong support.
APLD is showing early-stage parabolic potential after confirming a multi-year consolidation breakout. With strong volume, bullish structure, and long-term accumulation patterns, it now targets a multi-bagger move.
A pullback to $11.00 would offer a high-conviction re-entry zone.

APLD $13.86 buyApplied digital has been on a tear for the past few weeks fuelled by the news that Nvidia has bought a stake in the company and the deal with wall streets latest darling Coreveave.
Digging a little deeper, looking at the options chain there are a huge number of calls all the way up to $20. The short interest is quoted at 36.2% on market beat, as the price rises short sellers will be forced to close their positions by buying back shares fuelling further gains.
In addition to these factors institutional investors have recently been buying large chunks of shares.
This could very well go parabolic

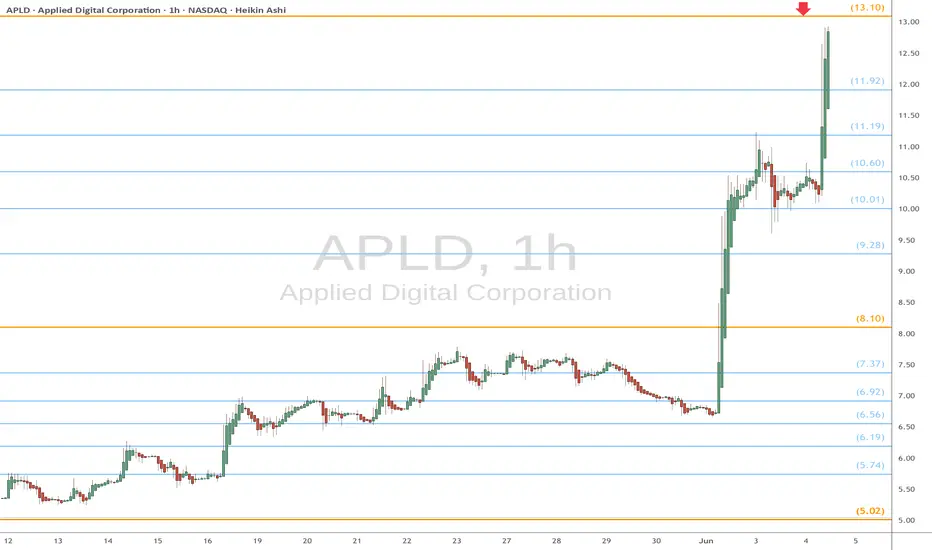
APLD heads up at $13.10: Golden Genesis fib may stop the SurgeAPLD on a massive surge over various company news.
Currently about to hit a Golden Genesis fib at $8.10
Looking for usual Dip-to-Fib or Break-and-Retest to buy.
It is PROBABLE that we "orbit" this fib a few times.
It is POSSIBLE that we get a significant dip from here.
It is PLAUSIBLE that we break and run if bulls are hyper.
.
See "Related Publications" for previous EXACT plots --------------------->>>>>>>
.
APLD - SWING TRADE BUYING ZONESAPLD. The stock was in a perfect parallel channel accumulating zone for many days. Finally we saw a breakout 8.47$
The stock rallied almost a 100 percent after the breakout and is still in a good uptrend.
Major rejection was at 10.20 to 11.65 which is the weekly bearish order block. We have seen 4 to 5 sweeps inside this bearish order block previously and now there is no liquidity left inside the order block.
The stock has made a bullish retest on the previous bearish order block at 11.65 and now its acting as a bullish buying zone.
However, there are a lot of bullish Order blocks waiting to be filled in the uptrend.
In my opinion, best way to ride this stock is to wait and buy at the order blocks.
keep adding if it goes down to fill the other order blocks that are present at the breakout.
Good buying zones for a Swing trade are 10.40 , 10.00 and 8.50 which is the strongest and most reliable.
SO WAIT AND ENJOY!

Super Performance Candidate NASDAQ:APLD , focus on AI infrastructure, landmark CoreWave ( NASDAQ:CRWV ) deal, scalable operations and Nvdia ( NASDAQ:NVDA ) backing make for it a compelling growth story. At a RS Rating of 98,
I have reasons to believe this equity value can increase

APLD – 30-Min Long Trade Setup!📈
🔹 Ticker: APLD (NASDAQ)
🔹 Setup Type: Ascending Triangle + Resistance Break
🔸 Breakout Price: ~$5.80
📊 Trade Plan (Long Position)
✅ Entry Zone: $5.75–$5.85 (break above yellow resistance zone & trendline)
✅ Stop Loss (SL): Below $5.37 (structure low / white support line)
✅ Take Profit Targets:
📌 TP1: $6.25 (red line – resistance)
📌 TP2: $6.99 (green line – prior supply zone)
📐 Risk-Reward Analysis
📉 Risk:
$5.80 - $5.37 = $0.43
📈 Reward to TP1:
$6.25 - $5.80 = $0.45 → 1.04:1 R/R
📈 Reward to TP2:
$6.99 - $5.80 = $1.19 → 2.76:1 R/R
🔍 Technical Highlights
📌 Ascending Triangle: Strong higher lows pushing into horizontal resistance
📌 Volume Confirmation: Needed for clean breakout
📌 Yellow Zone: Break and retest area for confirmation
📌 Trendline Support: Pink rising trendline continues to hold up price
⚙️ Trade Management
🔄 After TP1:
— Move SL to breakeven
— Book partial profits (~50%)
📈 Let the rest target TP2, trailing SL as new supports form
⚠️ Invalidation Signal
❌ Breakdown below $5.37
❌ Rejection from yellow zone without volume follow-through

Stock Analysis: APLD (Applied Digital Corporation) !📊 – 30-Min Chart
📉 Setup Type: Rising Wedge Breakdown (Bearish Reversal)
🔻 Trade Plan (Short Position)
✅ Entry Zone: Below $7.27 (Breakdown Confirmation)
✅ Stop-Loss (SL): Above $7.49 (Key Resistance Level)
🎯 Take Profit Targets (TPs)
📌 TP1: $7.00 (Support Level)
📌 TP2: $6.69 (Key Demand Zone)
📌 TP3: $6.60 (Major Support & Psychological Level)
📊 Risk-Reward Ratio Calculation
📉 Risk (SL Distance):
$7.49 - $7.27 = $0.22 risk per trade
📈 Reward to TP1:
$7.27 - $7.00 = $0.27 (1:1.2 R/R)
📈 Reward to TP2:
$7.27 - $6.69 = $0.58 (1:2.6 R/R)
📈 Reward to TP3:
$7.27 - $6.60 = $0.67 (1:3.0 R/R)
✅ Favorable Risk-Reward Ratio with strong downside potential!
🔍 Technical Analysis & Strategy
📌 Rising Wedge Breakdown: Price is breaking below a bearish wedge pattern, signaling weakness.
📌 Key Resistance Holding: $7.49 acts as a strong rejection zone, reinforcing downside potential.
📌 Volume Confirmation: Increasing sell volume confirms bearish sentiment.
📌 Momentum Shift: Loss of upward trend momentum suggests possible trend reversal.
📉 Trade Execution & Risk Management
✔ Wait for Confirmation: A 30-min candle close below $7.27 strengthens the breakdown.
✔ Adjust Stop-Loss: Move SL to break-even ($7.27) after hitting TP1 ($7.00).
✔ Partial Profit Booking Strategy:
✔ Take 50% profits at TP1 ($7.00) and let the rest run toward TP2 & TP3.
✔ Adjust Stop-Loss to Break-even ($7.27) after TP1 is reached.
⚠️ Risks & Considerations ❌ Fake Breakdown Risk: If price reclaims $7.27, the short setup could be invalidated.
❌ Market Conditions: Low-volume breakdowns may lead to a bounce.
🚀 Final Thoughts ✔ Bearish Setup – Strong downside potential.
✔ Rising Wedge Breakdown – High confluence setup.
✔ Favorable Risk-Reward Ratio – 1:3.0 toward TP3.
💡 Stick to the plan, manage risk, and trade smart! 🚀📉
🔗 #APLD #ShortTrade #BearishBreakdown #TradingView #ProfittoPath 💰📊

APLD/USD – 30-Min Long Trade Setup !📌 🚀
🔹 Asset: APLD (Applied Digital Corporation)
🔹 Timeframe: 30-Min Chart
🔹 Setup Type: Bullish Breakout Trade
📌 Trade Plan (Long Position)
✅ Entry Zone: Above $7.02 (Breakout Confirmation)
✅ Stop-Loss (SL): Below $6.74 (Invalidation Level)
🎯 Take Profit Targets:
📌 TP1: $7.33 (First Resistance Level)
📌 TP2: $7.76 (Extended Bullish Move)
📊 Risk-Reward Ratio Calculation
📉 Risk (SL Distance):
$7.02 - $6.74 = $0.28 risk per share
📈 Reward to TP1:
$7.33 - $7.02 = $0.31 (1:1.1 R/R)
📈 Reward to TP2:
$7.76 - $7.02 = $0.74 (1:2.64 R/R)
🔍 Technical Analysis & Strategy
📌 Downtrend Breakout: Price has broken a descending trendline (pink line), signaling a bullish breakout.
📌 Retest Confirmation: The price is hovering around $7.02, testing previous resistance as support.
📌 Support Level: $6.74 is acting as strong support, rejecting lower lows.
📌 High Volume Needed: Watch for bullish volume confirmation above $7.02 to validate the breakout.
📊 Key Support & Resistance Levels
🟢 $6.74 – Stop-Loss / Key Support
🟡 $7.02 – Breakout Level / Long Entry
🔴 $7.33 – First Resistance / TP1
🟢 $7.76 – Final Target / TP2
📉 Trade Execution & Risk Management
📊 Volume Confirmation: Ensure high buying volume above $7.02 before entering.
📉 Trailing Stop Strategy: Move SL to entry ($7.02) after TP1 ($7.33) is hit.
💰 Partial Profit Booking Strategy
✔ Take 50% profits at $7.33, let the rest run toward $7.76.
✔ Adjust Stop-Loss to Break-even ($7.02) after TP1 is reached.
⚠️ Fake Breakout Risk
❌ If the price fails to hold above $7.02 and drops back below, exit early to avoid losses.
❌ Wait for a strong bullish candle close above $7.02 before entering aggressively.
🚀 Final Thoughts
✔ Bullish Setup – Breaking out of the trendline indicates a potential reversal.
✔ Momentum Shift Possible – Watch for volume confirmation.
✔ Favorable Risk-Reward Ratio – 1:1.1 to TP1, 1:2.64 to TP2.
💡 Stick to the plan, manage risk, and trade smart! 🚀📈
🔗 Hashtags for Social Media Posting
#StockMarket 📉 #TradingNews 📰 #StockAnalysis 📊 #MarketUpdate 🔥 #Investing 💰 #Trading 📈 #Finance 💵 #ProfittoPath 🚀 #SwingTrading 🔄 #DayTrading ⚡ #StockTrader 💸 #TechnicalAnalysis 📉 #MarketTrends 📊 #StockAlerts 🔔 #TradeSmart 🤓 #Bullish 🐂 #RiskManagement ⚠️ #TradingCommunity 🤝

I am $APLD, destroyer of worlds, blaah blah etc, and so forthThere's some guy pushing => Trump----->stargate-------->data centers
I can see his logic; its fresh, sure.
Not many people know about this little gem, NASDAQ:APLD , Kinda snuck under the radar.
An OG Miner/Data Center play. Sweet.
Now would be the time to get in, Pre-palantir energy, is here, for sure.
its a no brainer, with Trump, Elon, Ai & Data-centers.
I would say, this week, ramping up, should get some reasonable price action ,.
Who knows......
$120.......Maybe, sooner than we think.

APLD explosive move to 13.4-13.6 is imminent!!looking for next buy wave to take price to 13.4-13.6 levels.
strong buy rates, increasing buying pressure among tech stocks & indices amidst volatility.
buyers returning & ready to take us higher once more.
holding long equity & call option positions.

APLD/USD – 30-Min Long Trade Setup!📌 🚀
🔹 Asset: APLD (Applied Digital Corporation)
🔹 Timeframe: 30-Min Chart
🔹 Setup Type: Bullish Breakout Trade
📌 Trade Plan (Long Position)
✅ Entry Zone: Above $8.35 (Breakout Confirmation)
✅ Stop-Loss (SL): Below $7.19 (Strong Support Level)
🎯 Take Profit Targets
📌 TP1: $10.18 (First Resistance Level)
📌 TP2: $11.91 (Final Target – Extended Bullish Move)
📊 Risk-Reward Ratio Calculation
📈 Risk (SL Distance): $8.35 - $7.19 = $1.16 risk per share
📈 Reward to TP1: $10.18 - $8.35 = $1.83 (1:1.57 R/R)
📈 Reward to TP2: $11.91 - $8.35 = $3.56 (1:3.07 R/R)
🔍 Technical Analysis & Strategy
📌 Descending Triangle Breakout: The price is breaking out of a descending trendline, signaling potential bullish momentum.
📌 Breakout Confirmation: A strong bullish candle closing above $8.35 with increased volume confirms the move.
📌 Momentum Shift Expected: If the price holds above $8.35, we expect a move toward $10.18 (TP1) and $11.91 (TP2).
📊 Key Support & Resistance Levels
🔴 $7.19 – Strong Support / Stop-Loss Level
🟡 $8.35 – Entry / Breakout Level
🟢 $10.18 – First Resistance / TP1
🟢 $11.91 – Final Target / TP2
📉 Trade Execution & Risk Management
📊 Volume Confirmation: Ensure strong buying volume above $8.35 before entering.
📈 Trailing Stop Strategy: Move SL to entry ($8.35) after TP1 ($10.18) is hit.
💰 Partial Profit Booking Strategy:
✔ Take 50% profits at $10.18, let the rest run to $11.91.
✔ Adjust Stop-Loss to Break-even ($8.35) after TP1 is reached.
⚠️ Fake Breakout Risk
❌ If price fails to hold above $8.35 and falls back below $8.00, exit early.
❌ Wait for a strong bullish candle close above $8.35 for confirmation before entering aggressively.
🚀 Final Thoughts
✔ Bullish Setup – Breaking above $8.35 could lead to higher targets.
✔ Momentum Shift Possible – Watch for volume confirmation.
✔ Favorable Risk-Reward Ratio – 1:1.57 to TP1, 1:3.07 to TP2.
💡 Stick to the plan, manage risk, and trade smart! 🚀🏆
🔗 #StockTrading #APLD #BreakoutTrade #TechnicalAnalysis #MomentumStocks #ProfittoPath #TradingView #StockMarket #SwingTrading #RiskManagement #ChartAnalysis 📈🔥

Applied Digital BullishPrice action broke throuhj medium term resitance and reclaimed position in longer term ascending channel. If/When it corrects down to the line of support, i'll be sharking up more $10 calls.

Bullish Bat on APLD?Beyond the great trade setup here, I'll mention that APLD is NVDA's 2nd largest holdings on their books. Let's hope that NVDA earrnings report shows they haven't sold and maybe that'll help this little engine that could. What's your thoughts? Do you think that APLD and its market partic NASDAQ:APLD NASDAQ:APLD ipants are going to respect levels and let this Bat fly?

Nvidia $NVDA has Revived Applied Digital $APLD StockNASDAQ:SOUN tanked today because Nvidia disclosed that they were no longer invested, and NASDAQ:APLD is rocketing higher for the exact opposite reason. Nvidia is still invested in Applied Digital, and in my view, that's VERY bullish. The stars are finally aligning again for $APLD! ⭐️⭐️⭐️
And now, we've got the bullish technicals to match the bullish fundamentals! NASDAQ:SOUN has broken above that line of conservative medium term resistance which is good, but what really excites me about today's pop is the fact that we've successfully reclaimed this long term ascending channel.💥📈🏆
I think we'll be seeing double-digits in the very near-future, and it felt incredibly good to scoop up 100 fresh call options to ride the (potential) gains with! 🌊🌊💯

APLD - retracingAI data storage APLD had dip on China's DeepSeek AI app and headed back up off last 100% take before the dip.
#datacenters
#fibonacci retracement
#40%gain
#AIbuylists (5xearnings)
#quicktrends

$APLD is Just Asking for a BreakoutThe fundamentals are strong, and the technicals are setting up beautifully. NASDAQ:APLD has just broken above that line of "absolute" medium term resistance, while also preparing to break out from this bullish short term ascending channel pattern.💥🚀
I'm glad that we have plenty of call options on deck over at WAVE$ Capital! I think that NASDAQ:APLD could be sitting well above $12 by mid-February. 😎💰🎯

APLDGraph with MACD cross and rising KDJ and EWO all bottoms up bootstraps with large volume spike on Sept 3rd on a 4D chart shows strap in.
Upcoming earnings target is -0.273 and past earnings have been off, so the recent jump has gained >100% for the big whale buyer.
#chart
#EWO
#quick100%
#APLD
#largevolumespike 4d chart
#KDJ cross-over trend
#MACD trend
Too late? No buy or sell recommendations here. Make own decision on next earnings announcement.

APLD once again in the buy zone; breakout to 11.8 by early FebAPLD has reached within the 61.8 & 78.6 fibonacci retracement levels of current buy structure on 4 hr cycle.
Based upon the strong buy rates & recent bullish activity, as well as the buy rates building on Nasdaq index, I see this retracement as a perfect discount for a long call options trade setup for 30 DTE contracts.
Long equity positions are being held speculatively with expectations for breakout rally to 34$ prior highs sometime by end of 2025/early 2026. Imminent target is shown at 11.8 zone by end of Jan/early Feb (at the latest).

APLD - A name you NEED to add to your watchlist NOW!CHARTURDAY - NASDAQ:APLD
A good name to add to your watchlist friends!
Good:
-CupnHandle Pattern
-Inverse H&S
-Volume Shelf
-Bullish Wr%
Bad:
-Red H5 indicator
-No breakouts yet.
If we get a breakout and green H5 then...
🎯$16🎯$21
Not financial advice
$APLD to $19 a share NASDAQ:APLD to $19 a share
Chart is ready and NVDA being invested in it can be a catalyst.
Idea would be invalidated with a close below $8

Applied Digital (APLD) Gains Momentum with NVIDIA's Investment
NVIDIA's Share Acquisition: NVIDIA recently announced acquiring shares in APLD, boosting investor confidence.
Bullish Continuation: APLD shows a strong bullish trend with analysts predicting significant upside potential.
Moving Average Ribbons: The Moving Average ribbons are showing a bullish signal, with multiple short-term moving averages crossing above the longer-term ones

APLD eyes on 8 bucks: return trip after longs, will not hold?Followup to my long call on $8.10 break (click).
We got out scalp long entry and exit on fibs.
We are now back to the scene of the crime.
Major support tried to hold but looks to fail.
Starting a new week so maybe new sentiment.
$ 7.97 - 8.10 remains the key support here.
$ 6.92 - 7.07 may be tested if bears step in.
$ 4.57 - 4.70 will be critical uptrend support.
==========================================
