Atos Reverse Stock Split – Another Round of Price Manipulation?Atos Confirms Bullish Continuation, Invalidating Consolidation and Bearish Retest
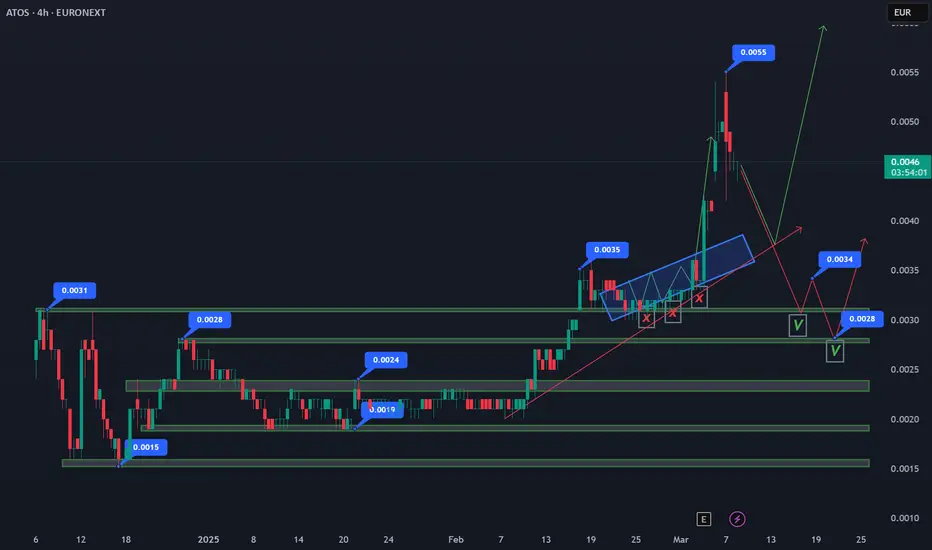
Atos has officially invalidated neutral consolidation and a bearish retest, choosing a bullish continuation as it currently trades at $0.0046.
Atos Needs a Pullback to $0.0028–$0.0034 After 84% Surge
Following a massive 84% rally from $0.0030 to $0.0055, Atos now requires a technical pullback to retest and confirm support.
Target Pullback Zone: $0.0028–$0.0034
A retracement into this range would provide a healthy consolidation, allowing bulls to regroup before another breakout.
Holding this zone would strengthen the bullish structure, preventing excessive volatility and reinforcing confidence in further upside.
If $0.0028 holds, the next bullish wave could see Atos push beyond $0.0055 and target new highs.
This pullback phase is crucial for maintaining trend stability and ensuring Atos builds a strong foundation for the next bullish leg. If buyers defend $0.0028–$0.0034, the stock could be positioned for another sharp upward move.
Atos SE Reverse Stock Split Analysis – March 2025
Atos SE has announced a reverse stock split at a 10,000-to-1 ratio, aiming to reduce the number of outstanding shares and stabilize stock price volatility. This move follows prior capital increases and a drastic decline in share value.
Key Impacts of the Reverse Split:
Structural Change, Not Value Addition:
The total market capitalization and shareholders' equity remain unchanged.
For example, a holder of 30,000 shares at €0.0049 each will receive 3 shares at €49 each, maintaining a €147 portfolio value.
Market Sentiment & Perception:
Large-scale reverse splits are often perceived negatively, as they may signal distress.
Atos must demonstrate financial stability and growth potential to prevent further investor sell-offs.
Liquidity & Trading Adjustments:
Shareholders with fractional holdings (<10,000 shares) will need to adjust positions before April 23, 2025, or risk forced liquidation.
The new shares will start trading under a new ISIN code (FR001400X2S4) from April 24, 2025.
Potential Post-Split Volatility:
If investor confidence remains weak, the stock could face renewed selling pressure despite the higher nominal share price.
However, if Atos improves its fundamentals and strategic outlook, the split could help attract institutional investors who prefer stocks with higher unit prices.
Final Take:
While the reverse split does not inherently add value, it aims to enhance trading conditions and market perception. The real impact depends on Atos' ability to execute a successful turnaround strategy beyond the technical stock adjustment.
Atos Reverse Stock Split – Another Round of Price Manipulation?
Atos SE has once again announced a massive reverse stock split (10,000-to-1), following a sharp decline in share value. While this move is framed as an effort to reduce volatility and stabilize trading conditions, history suggests a pattern of price manipulation that leaves retail investors at a loss.
A Look Back – The 2024 Split Manipulation
The last time Atos conducted a share split (13,497 new shares for every 24 old shares), the price artificially pumped from €0.15 to €1.70 right before the official announcement. This created a false sense of demand, trapping investors at high prices, only for the stock to collapse afterward. Many retail traders ended up buying high and losing money.
Current Manipulation – Selling Off Before the Split
Now, we see a similar pattern playing out again—Atos is trading at record-low levels below €0.0030 ahead of the reverse split. This suggests that once the new shares start trading at a higher nominal price, investors may again face forced sell-offs and further declines, leading to more financial losses for shareholders.
Key Takeaways:
The reverse split does not add value—it only reduces the number of shares outstanding, while total market capitalization remains unchanged.
Shareholders with less than 10,000 shares must adjust their positions before April 23, 2025, or risk forced liquidation.
Without strong fundamentals, the post-split price may drop again, just like last time.
Investors should remain cautious and consider the risks before making any decisions. Atos must prove its financial stability rather than relying on stock restructuring to create the illusion of recovery.
ATO trade ideas
Atos : Post-Split Recovery and Key Market ScenariosFollowing the massive share split (13,497 new shares for every 24 old shares), Atos experienced a significant price drop from $1 to $0.0024. The stock reached its lowest point at $0.0015 on December 17, marking a critical bottom.
From January 9 to February 11, Atos entered a consolidation phase, ranging between $0.0024 and $0.0019, indicating a period of accumulation. However, on February 18, the price broke above its post-split all-time high, reaching $0.0035, with an intraday high of $0.0039.
Now, after this sharp extension from $0.0020 to $0.0039, a pullback is necessary to stabilize price action and determine the next trend.
Potential Scenarios for Atos Price Action
1. Bullish Continuation: Uptrend Formation
If Atos holds above $0.0028, we could see a bullish channel forming, with price moving between $0.0028 and $0.0035.
This scenario would set up a gradual uptrend, signaling continued accumulation and confidence in further recovery.
Key Level to Watch: $0.0028 must hold as support to confirm the bullish momentum.
2. Neutral Consolidation: Sideways Trading Range
If the price drops below $0.0028, Atos could enter another consolidation phase, ranging between $0.0023 and $0.0029.
This would indicate that the market is still undecided, with neither bulls nor bears taking full control.
Key Level to Watch: $0.0023 should act as strong support, preventing further downside.
3. Bearish Retest: Hunting for Liquidity at $0.0018–$0.0019
In a bearish scenario, Atos could break below $0.0023 and head toward $0.0018–$0.0019.
If this zone holds, it could trigger a new buying wave, stopping the bearish momentum and potentially creating a new hype cycle.
Key Level to Watch: Price must refuse to go under $0.0018 for buyers to regain control.
Conclusion: Crucial Levels to Watch for Atos' Next Move
Bullish scenario: Hold above $0.0028, creating an uptrend between $0.0028 and $0.0035.
Neutral scenario: Drop below $0.0028, consolidating in a range between $0.0023 and $0.0029.
Bearish scenario: Test $0.0018–$0.0019, with a potential rebound if this zone holds strong.
With the recent price breakout, Atos is now at a critical turning point, where the next few trading sessions will determine whether bullish momentum continues or if the stock will enter another consolidation or correction phase.

[ATO] French Stock for lotto playHere is a bleeding stock on the French market with very bad managment and fondamental side. The shares are going for dilution soon.
So why I am speaking about it ?
Because this stock is the one from a great French Company (or was) and we potentially can except it to rise up again if great change are made. "When there is blood in the streets" is time to buy but not without a proper strategy and here we start to see a potential long level of rejection.
Great Trade !

ATOS: The stock has bottomed out and may not go any furtherThe company that specializes in technology and the Cloud has faced many difficulties in recent years, as a result from 100 euros to 7.
It seems that after the impending restructuring and the change in the management model, things are getting ....
As far as technical analysis is concerned, its chart is positive in the last quarter and it points towards things getting better in this area...

ATOS sur la bonne voieATOS respecte bien le pattern des vagues d'Elliott, nous sommes sur la dernière phase, et tout cela dans un porte-voix ascendant.
Au-dessus de la tête, il y a la résistance autour des 21.
Je vise le point E à 21.

ATOS will reverse from here?Bullish bat pattern is being completed, i think. But need wait until the end of this week to confirm this.
If so, a big reversal will be forseen.

ATOS: Selling rallies as lower prices are expectedATOS - Intraday - We look to Sell at 38.73 (stop at 41.72)
The medium term bias remains bearish. Trading within a Bearish Channel formation. A move lower has resulted in prices breaking from the previous range and confirmed our bearish expectation. The formation has a measured move target of 30.61. Further downside is expected although we prefer to set shorts at our bespoke resistance levels at 38.73, resulting in improved risk/reward.
Our profit targets will be 30.60 and 28.00
Resistance: 38.74 / 41.13 / 47.16
Support: 36.40 / 36.00 / 34.62
Disclaimer – Saxo Bank Group. Please be reminded – you alone are responsible for your trading – both gains and losses. There is a very high degree of risk involved in trading. The technical analysis, like any and all indicators, strategies, columns, articles and other features accessible on/though this site (including those from Signal Centre) are for informational purposes only and should not be construed as investment advice by you. Such technical analysis are believed to be obtained from sources believed to be reliable, but not warrant their respective completeness or accuracy, or warrant any results from the use of the information. Your use of the technical analysis, as would also your use of any and all mentioned indicators, strategies, columns, articles and all other features, is entirely at your own risk and it is your sole responsibility to evaluate the accuracy, completeness and usefulness (including suitability) of the information. You should assess the risk of any trade with your financial adviser and make your own independent decision(s) regarding any tradable products which may be the subject matter of the technical analysis or any of the said indicators, strategies, columns, articles and all other features.
Please also be reminded that if despite the above, any of the said technical analysis (or any of the said indicators, strategies, columns, articles and other features accessible on/through this site) is found to be advisory or a recommendation; and not merely informational in nature, the same is in any event provided with the intention of being for general circulation and availability only. As such it is not intended to and does not form part of any offer or recommendation directed at you specifically, or have any regard to the investment objectives, financial situation or needs of yourself or any other specific person. Before committing to a trade or investment therefore, please seek advice from a financial or other professional adviser regarding the suitability of the product for you and (where available) read the relevant product offer/description documents, including the risk disclosures. If you do not wish to seek such financial advice, please still exercise your mind and consider carefully whether the product is suitable for you because you alone remain responsible for your trading – both gains and losses.

ATOS ATO long entry for swing tradeAssuming a correction of the last movement to the 38,2% fibo level around 41,2
Level confirmed by the c target of the abc ongoing correction
stop easy under the last lows around 38,5
targets:
either we are in a impulse wave --> target at least 161,8% fibo at 49 (orange scenario)
or we are in ABC correction (red scenario) --> target when AB=BC, around 47
on the middle term we may be in a 4th wave of a bearish movement, therefore this trade is only for short term
A lower low could come on the long term to complete the pattern
see also .tradingview.com/chart/ATO/iLDRPY31-ATOS-looking-for-entry-point/

ATOS looking for entry pointThe wave I of the supercycle starting in 2009 is achieved and a correction is in place
wave II seems to come to its end slowly
the stock is very bearish so measure your risk !
Buying zone = roughly 30 to 38
limit order at about 33€ may be a good choice (23,6% fibo level) but this could go much lower.

ATO. Where is mym popcornHi,
Seems, that we need to wait a bit.
Reversed head and shoulders forming.
If it will hit the resistance line, then lets wait for a short rocket up.
AG

ATOS : target 67ATOS a chuté du fait d'un conflit entre 2 sociétés américano-indiennes dont l'une rachetée par ATOS 3.5b$ est soumise à une indemnité de 850m$
ATOS fait appel. en attendant l'appel, le titre rebondit vers sa moyenne.

Possible short AtosLes cours semblent se heurter sur une résistance à 78 euros, et dessinent une figure en double top, validée seulement si les prix cassent la ligne
de cou. Le target serait sur la MM 200 et le stop au-dessus du précédent sommet.
Qu'en pensez-vous ?

ATOS. $ATOS. Possible short position. Stocks.We could see a decline in the price of ATOS (FR) to the trending support line. SL and target are shown. Just my idea, do your own research!

ATOS - Ready to go higherATOS is showing an interesting bullish trend, with current MA compression and a short term bullish momentum that could yield the price to the high 90s euros in the next months.

Symetrical triangle on atos wait for a decisionThe figure shows an incoming exit of the symetrical triangle.
Let's wait and see before short or long


ATOS Bear flagAtos is showing us what appears to be a beautiful bear flag.
The rejection at ~116.85 looks like a wonderful setup. I'm looking at a target around 100.

ATOS UPSIDE INCOMINGIn my opinion, atos will need to first break the multi month channel (blue cyan), then target the 116.5 zone. It's a horizontal resistance and upper daily channel (pink).
Care of news release the 25th april. Will break everything or tank.

