B1C trade ideas

BIDUToday the price was quite close to the $170 level I mentioned yesterday (Yellow PivotBreak line). We can see thatthe buying energy is accumulating quite fast. I'm afraid from one thing though - that tomorrow the stock will already open on a gap up...That's why I considered loading up a little at the session end, bu being a day trader, I could not violate the number one rule - Never hold overnight!


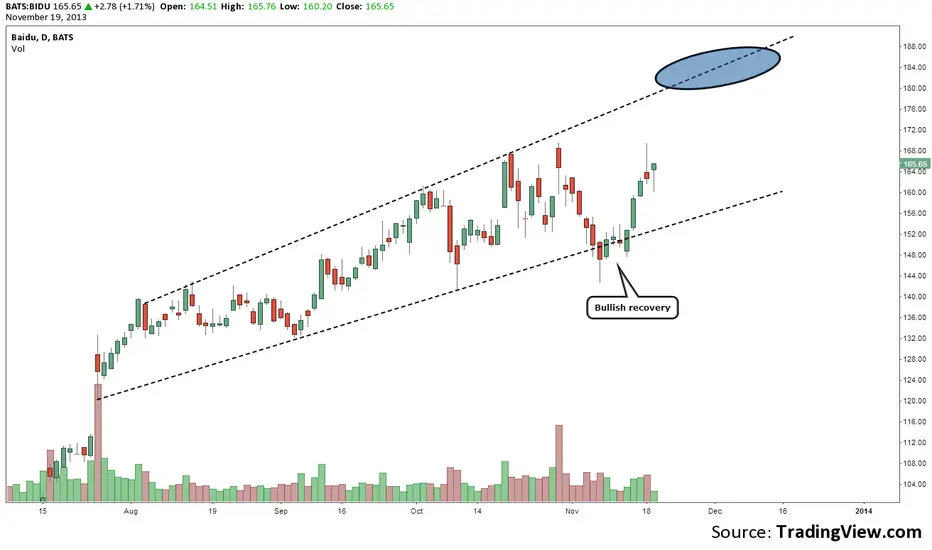
BIDUDon't take your eyes off BIDU, as it looks very Bullish, especially if it trades above 170. Notice the nice PivotBreak line that extends its effect one month back. Also, the price "sits" well above the middle SmartPoint band, I know I will watch it close...


BIDU Staged ShortsWhat's bouncing around in my mind is Staged Shorting and I'll use BIDU as an example:
Normally I'd short the entire amount of my contracts the moment I think it's going against me. If it doesn't I have 100% of my short going against me and it can quickly lose me more than I've been protecting.
I think on Saturday morning it was about $160 when I sold 10 x $150 NPs. The next day it dropped 3%, then the next day it dropped 3% and so on. What if I'd shorted 250 cfds each time it hit 25% of the buffer until it reached my strike where I would short the last 250 cds and thus be 100% covered at that point.
If it bounces up from my first short, it's not too bad because it's only a quarter bounce and would take a lot longer to lose me more than I'm protecting but I'd have a stop on that first staged short.
If it drops to the next 25% level, I would repeat. As above. But, the first stage would have a tidy profit, so the 2nd stage could have a wider SL. If it reaches the 3rd stager point, repeat, except 1 has a really nice profit and 2 stage has a tidy profit so 3 could be really wide.
If it hits the strike, repeat. If it blows through we're 100% covered, and we've probably doubled our profit after fees from all the stages and thus we actually want it drop to our strike if anything.
Stage 0: Sell 10x $150 Naked Puts when BIDU was at $160>
Stage 1: Short 250 CFDs at $157.50 (haven't picke the SL yet but add a figure here)
Stage 2: Short 250 CFDs at $155 (insert SL). Profit from S1= $595 (inc brokerage)
Stage 3: Short 250 CFDs at $152.50 (insert SL). Profit from S1+S2=$2490 (inc brokerage).
Stage 4: Short 250 CFDs at $150. Profit from S1+S2+S3= $3660
The big risky one is stage 1. Let's say it drops down to and activates then rises back up to the open price and your short is still active (no sl just for example). The Sell price for the $150 NP was .47 which is $420 profit (generally). If your stage 1 short goes up $1.70 to $159.20 that's all your NP profit gone and you have to SL before then. But what if the volatility meant it went back down again because $1.70 isn't that much of a swing with BIDU, you've lost all your profit and still not covered on a the trip down. So it def needs some thought.

BIDUAs Price dumped out to the SMA50 (Blue). SStoch. put in higher low bottom. Steam left in the tank here.

Short Idea for $BIDUBearish Harmonic Pattern
Nice MACD divergence
Stoch is showing overbought status
RSI is a downtrend
We are reaching major resistance zone. The R:R here is 3:1.

Baidu Inc (NASDAQ:BIDU) Resistance Level Quickly Approaching Baidu Inc (NASDAQ:BIDU) continues to surge higher today. The stock is trading at $157.56, +2.38 (1.53%). Baidu Inc is up from the $88.00 level since July 2013. This is a massive gain of 80% in just three months. While the bulls are cheering, smart investors may have an amazing opportunity to short it. The 2011 high on Baidu is $165-$166. This is also a max move extension level. Smart traders can short the stock here for at least a 10% pull back.
Gareth Soloway
Chief Market Strategist
www.InTheMoneyStocks.com

Baidu Inc $BIDU Breaks Out, Heads For This Target Baidu Inc (NASDAQ:BIDU) has broken out today. The stock had resistance at a gap fill price of $145.00. That has now been taken out. The next major level of resistance on BIDU is $152.00. Should it be hit in the next two days, a good shorting opportunity would arise.
BIDU is a Chinese ADR. It has run from below $90 to its current level in less than three months. A truly amazing move as it appears the Chinese economy is recovering. When euphoria is at its max, the top will be in. Matched up with this great double top at $152.00, a great risk/reward short can be had. The pull first target would be at $145.00.
Gareth Soloway
Chief Market Strategist
www.InTheMoneyStocks.com

High Volume seen on Call Options The High volume seen now with Calls with Bidu indicate that the FLAG seen on 1H would break soon forward 153 maybe in 2 weeks , i would suggest a high risk signal by Buying 13 Sep Bidu strike 145 @ 0.23 Now


BIDU-`shortOver extended, gaps to be filled- as long as price is above the oblique support line is fine.
